The dataviz skill people mean is Anthropic's chart guide that Claude reads before drawing any chart: pick the form, assign color by its job, run a palette validator, then add hover and accessibility. Anthropic also publishes a Python data-visualization skill in knowledge-work-plugins and a graphing skill for Claude in Slack. Claude Dashboards, in beta since 8 October 2026, builds live charts from your data.
Ask Claude for a chart and the result depends a lot on which instructions it has loaded. Without any, you get library defaults: the stock matplotlib colors, a legend in the corner, labels that collide. With a chart skill, Claude follows a method first.
"Dataviz skill" in a search usually means one specific skill: Anthropic's own chart guide, called dataviz. But Anthropic publishes two more chart skills, Claude now has a Dashboards feature, and the community has dozens of chart skills of mixed quality. We read all of the Anthropic ones on 14 November 2026, and we ran the palette validator that ships with dataviz against three palettes to see what it catches.
The short list
| Skill | From | Gives Claude | Output | Scripts |
|---|---|---|---|---|
dataviz |
Anthropic, via open-artifacts | A method for any chart, a default palette, a palette validator | Any medium: HTML, SVG, React, matplotlib, plotly, d3 | Palette validator, JS and Python |
data-visualization |
anthropics/knowledge-work-plugins | Chart choice and Python code patterns | matplotlib, seaborn, plotly | None; code samples Claude adapts |
graphing |
anthropics/claude-tag-plugins | Chart helpers for Claude in Slack | PNG, SVG, interactive HTML | Uses a helper library in the plugin |
| Claude Dashboards | Built into Claude | Live dashboards from connected data | Shareable dashboard | Not a skill |
If you only install one, install the first. The other two are useful in narrower settings, covered below.
Anthropic's dataviz skill
This is the skill most people are looking for. Anthropic has not published it as its own repository. The copy you can install today is in JimLiu/open-artifacts, a community project that repackages the artifact types and design skills from claude.ai for local agents. The skill's license line says it plainly: "Anthropic's dataviz skill: not MIT-licensed, rights stay with Anthropic." The project is not affiliated with Anthropic.
The SKILL.md is short, 68 lines, and points to seven reference files: choosing a form, the color formula, marks and anatomy, components such as stat tiles, interaction, anti-patterns, and the default palette. Two scripts sit next to them, validate_palette.js and validate_palette.py.
The method, in order
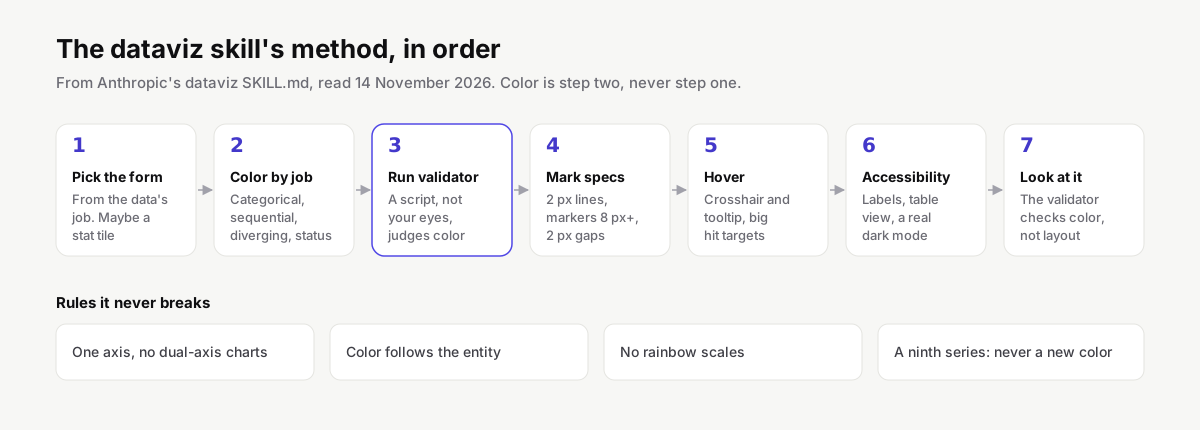
The skill's first line sets the tone: color comes last, because "most bad charts pick colors first." Then seven steps:
- Pick the form from the data's job: magnitude, identity, polarity, one headline number, or change over time. Sometimes the answer is a stat tile, not a chart.
- Assign color by the job it does. Categorical for identity, sequential for magnitude, diverging for polarity, status for state. Categorical hues go in a fixed order and are never cycled.
- Run the validator instead of judging colors by eye.
- Apply mark specs: thin marks, 2 px lines, markers of at least 8 px, a 2 px gap between filled shapes, labels only where they help.
- Add hover by default. A chart in HTML or SVG gets a crosshair and tooltip, with hit targets bigger than the marks.
- Accessibility pass: a legend for two or more series, direct labels for up to four, a table view, and a dark mode that is designed rather than flipped.
- Render it and look at it, because the validator checks color, not layout.
The rules it never breaks
A few of the non-negotiables explain most bad charts we see in AI output:
- One axis. No dual-axis charts. Two measures on different scales become two charts, small multiples, or an index to a common base. The skill calls this the number one chart mistake.
- Color follows the entity, not its rank. If a filter removes a series, the remaining ones keep their colors.
- No rainbow. Sequential means one hue from light to dark. Diverging means two hues with a neutral gray in the middle.
- A ninth series is never a new color. It folds into "Other", small multiples or another encoding.
- Text is never in the series color. Values and labels stay in the text colors; the mark beside them carries the identity.
- Status colors are reserved for good, warning, serious and critical, and always come with an icon and a label.
We ran the validator on three palettes
The validator checks five things on a categorical palette: a lightness band, a chroma floor (so no color reads as gray), separation for color-blind readers, separation for everyone else, and contrast against the background. We ran node scripts/validate_palette.js "<colors>" --mode light on each palette:
| Palette | Lightness | Chroma | Color-blind separation | Normal vision | Contrast | Result |
|---|---|---|---|---|---|---|
| dataviz default, 8 colors | Pass | Pass | Pass, worst pair ΔE 9.1 | Pass | Warn on 3 colors | Pass |
| matplotlib tab10, first 6 | Pass | Fail on brown | Fail: green and orange at ΔE 0.7 (protan) | Pass | Warn on orange | Fail |
| data-visualization skill, 6 | Pass | Fail on 2 colors | Fail: green and orange at ΔE 4.5 (protan) | Fail: brown and violet at ΔE 13.5 | Warn on 2 colors | Fail |
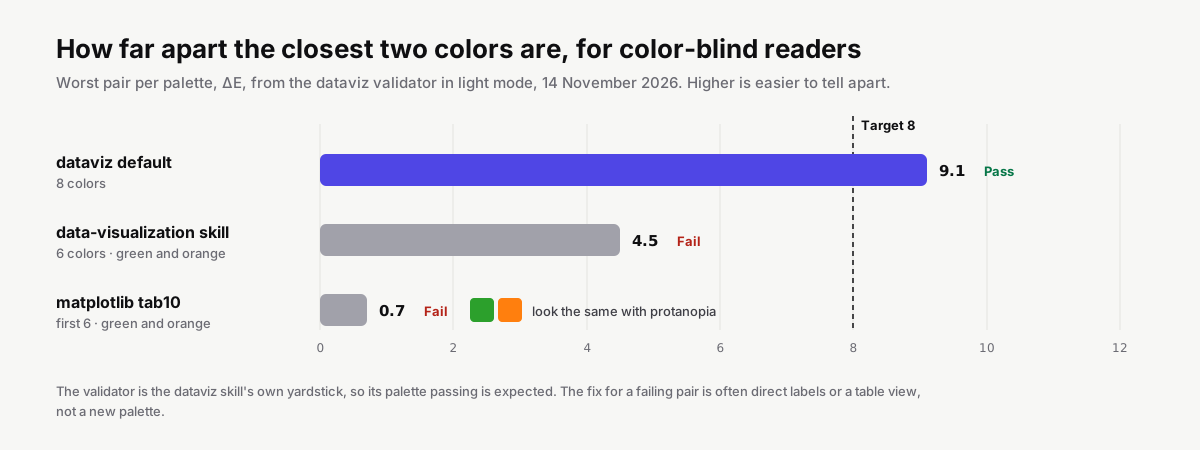
ΔE is the distance between two colors as a viewer perceives them; the skill targets 8 or more for color-blind readers and treats under 15 for normal vision as a hard fail.
Read this table with care. The validator is the dataviz skill's own yardstick, so its own palette passing is expected. What is useful is where the others fail. A ΔE of 0.7 between green and orange means a reader with protanopia sees two identical colors, so a two-line chart in tab10 green and orange is one line to them. The fix is not necessarily a new palette: direct labels on the lines, or a table view, are enough.
The data-visualization skill is a fair example of why a script beats good intentions. Its own design notes say to avoid red and green alone, because about 8% of men are red-green color-blind, and to use blue and orange as the main pair. Its palette then puts green right next to orange.
Even the default palette gets a contrast warning on three light colors against a white background. The skill's rule for that is clear: a contrast warning means you add visible labels or a table view, and it cannot be dismissed.
Install it
npx skills add JimLiu/open-artifacts --skill dataviz --agent claude-code
The skill lands in .claude/skills/dataviz/. To check a palette of your own, run the validator from that folder with your colors in place of the example. You can also swap in your brand colors; the skill has a section on plugging in a design system, and the validator tells you whether your brand palette survives.
Anthropic's data-visualization skill
anthropics/knowledge-work-plugins is Anthropic's official set of plugins for knowledge work, Apache-2.0, 35,685 stars on 14 November 2026. Its data plugin carries a skill called data-visualization, written for Claude Cowork and usable in Claude Code.
Where dataviz is a design method, this skill is practical Python. Its 305 lines cover:
- A chart selection guide: which chart for which relationship, and when not to use a chart type.
- Code patterns for matplotlib, seaborn and plotly: a style setup, line charts for time series with date formatting, sorted bar charts with value labels, histograms with mean and median lines, heatmaps, small multiples, number formatting helpers and interactive plotly charts.
- Design principles: color that encodes data rather than decorating, a title that states the insight ("Revenue grew 23% YoY" beats "Revenue by Month"), categories sorted by value, no rotated axis labels.
It is marked user-invocable: false, so you do not call it by name. Claude loads it when a request needs a chart.
claude plugin marketplace add anthropics/knowledge-work-plugins
claude plugin install data@knowledge-work-plugins
This is the better fit when you analyse data in Python notebooks or scripts and want publication-quality figures fast. Pair it with the validator above if your charts will be read by many people, because its palette fails the color-blind check.
The graphing skill for Claude in Slack
anthropics/claude-tag-plugins holds plugins for @Claude in Slack: Jira, Datadog, BigQuery, Notion and more. One of them, claude-tag-data-viz, contains a skill called graphing. It composes timeseries, bar, line, area, pie and scatter charts from tabular data using a small helper library the plugin ships, called chartkit, and outputs PNG, SVG or a self-contained interactive HTML file.
Use it if your team asks @Claude for charts in Slack threads. It is not a general replacement for the other two in Claude Code.
Claude Dashboards
Anthropic added Dashboards to Claude on 8 October 2026, in beta on paid plans, on the same day as Claude Motion. It is a product feature, not a skill you install.
You describe the dashboard in plain words, for example "Build a dashboard of this quarter's revenue by region", and Claude builds it from your connected data. Anthropic names Amazon Redshift, BigQuery, ClickHouse, Databricks, Snowflake and Salesforce as sources. The dashboard updates as the data changes, each chart shows when its data was last refreshed, and you can click any number to see the query behind it.
Dashboards can be sent to Amplitude, Grafana, Hex, Mixpanel, Omni, Perplexity, PostHog and Sigma, with Databricks Genie, Looker, monday.com and Tableau listed as coming soon. On Enterprise plans they are off by default; an admin turns them on under Organization settings › Artifacts.
If what you want is a live view of business numbers, Dashboards is the shorter path. If you want charts inside your own app, your report or your codebase, the skills are what you need.
Community chart skills
Our catalog lists dozens of skills with "chart" in the name, and a search for one shows why you should read before installing. The most-starred results are Helm chart scaffolding for Kubernetes and statecharts for state machines, which have nothing to do with data visualization.
Among the real chart skills, a few are worth knowing about:
swift-chartsfor Apple's Swift Charts framework.matlab-build-chartfrom MathWorks, for MATLAB charts.creating-data-visualizations, a general one that picks a plot type and generates the chart, which several registries list under different owners.
Copies of dataviz also circulate under the project's old name, baoyu-design. Install from the current repository, JimLiu/open-artifacts, to get updates.
Which one to use
- You want better charts from Claude, in any format.
dataviz. It changes how Claude decides, not just how it codes. - You work in Python and want figures for a report.
data-visualization, plus the dataviz validator for the palette. - Your team charts in Slack. The
graphingskill in claude-tag-data-viz. - You want a live dashboard on company data. Claude Dashboards, if you are on a paid plan with the connectors you need.
- You build charts in Swift or MATLAB. The framework-specific community skills.
dataviz and data-visualization work well together: one decides the form and the colors, the other writes the Python. Two general design skills at once is less useful, because they give Claude two sets of rules to choose between.
Before you install
The skills CLI prints a warning after every install: skills run with the agent's full permissions. For chart skills, that mostly means code the agent writes and runs to draw the chart.
- The
datavizvalidator is a single file in JavaScript and one in Python. Both only read the colors you pass and print a report. Read them once; they are short. data-visualizationcontains no scripts, only examples Claude adapts and runs. That code runs in your environment, against your data, so the usual review applies.- Check the license before using a skill at work.
datavizis Anthropic's material and not under the project's MIT license; the knowledge-work and claude-tag plugins are Apache-2.0.
HostedMCP checks every indexable skill in its catalog for scripts that download and run code, reach for credentials or hide instructions in the SKILL.md. Each skill page links to its report.
Questions people ask
What is the Claude dataviz skill?
A chart guide from Anthropic that Claude reads before it draws a chart, graph or dashboard. It sets an order (form, color, palette check, marks, hover, accessibility, a final look), a list of rules such as no dual-axis charts, a default eight-color palette and a script that validates any palette for color-blind readers.
How do I use the dataviz skill in Claude Code?
Anthropic has not published it as a standalone repository. The open-artifacts project ships a copy: npx skills add JimLiu/open-artifacts --skill dataviz --agent claude-code. Its license line says the skill is Anthropic's and not MIT-licensed, so check that before using it at work.
What is the difference between dataviz and data-visualization?
dataviz is design method for any chart medium, with a palette validator. data-visualization, in Anthropic's knowledge-work-plugins, is Python code patterns for matplotlib, seaborn and plotly: which chart for which question, and ready-made functions for line, bar, histogram, heatmap and small multiples.
Is the default matplotlib palette color-blind safe?
Not for every pair. We ran the first six colors of matplotlib's tab10 through the dataviz validator and green next to orange came out at Delta E 0.7 for protanopia, which those readers cannot tell apart. Direct labels or a table fix it.
What are Claude Dashboards?
A Claude feature in beta on paid plans since 8 October 2026. You describe a dashboard, Claude builds it from connected data such as BigQuery, Snowflake, Databricks, Redshift, ClickHouse or Salesforce, and it updates as the data changes. Each number links to the query behind it.
How do I install Anthropic's data-visualization skill?
It ships in the data plugin of anthropics/knowledge-work-plugins: run claude plugin marketplace add anthropics/knowledge-work-plugins, then claude plugin install data@knowledge-work-plugins. Claude loads it on its own when you ask for a chart, because it is not user-invocable.
Why should I not use a dual-axis chart?
Two y-scales on one chart let the scale choice, not the data, decide where the lines cross. The dataviz skill calls it the number one chart mistake and asks for two charts, small multiples or an index to a common base instead.
Do chart skills run code on my machine?
Some do. The dataviz skill includes a palette validator in JavaScript and Python. The data-visualization skill is Python examples the agent adapts and runs to draw charts. Read the scripts before approving them; skills run with the agent's permissions.