


Chrome DevTools MCP puts the DevTools panel you already know in front of an AI agent. Where most browser servers are about clicking and typing, this one is about finding out why a page is slow, what it logs, what it requests and what it keeps in memory. It is published by the ChromeDevTools organization on GitHub, has 55,670 stars, and is Apache-2.0 licensed.
We installed version 1.13.0, published on 11 November 2026, and did two things on 14 November 2026: listed its tools with different options through MCP Inspector, and drove it with a small MCP client to record a performance trace and run Lighthouse on hostedmcp.org, our own site. The numbers below are from those runs.
Install it
You need Node.js 20.19 or newer and Chrome. The browser starts on the first tool call that needs it, not when the server starts.
Claude Code:
claude mcp add chrome-devtools -- npx chrome-devtools-mcp@latest --isolated --no-usage-statistics
Cursor, Claude Desktop, Windsurf and other JSON-configured clients:
{
  "mcpServers": {
    "chrome-devtools": {
      "command": "npx",
      "args": ["chrome-devtools-mcp@latest", "--isolated", "--no-usage-statistics"]
    }
  }
}
Codex:
codex mcp add chrome-devtools -- npx chrome-devtools-mcp@latest --isolated --no-usage-statistics
The two flags are our recommendation, not defaults. --isolated gives each session a temporary profile; without it the server keeps a persistent profile under ~/.cache/chrome-devtools-mcp/chrome-profile that is not cleared between runs. --no-usage-statistics turns off the usage statistics the server sends to Google by default. Our config builder writes the same entry for several clients.
The README's suggested first prompt is a good test: "Check the performance of https://developers.chrome.com".
The tools, counted
tools/list on 1.13.0 returned 33 tools with no options, and the tool definitions came to 31,498 bytes. With --slim it returned three: navigate, evaluate and screenshot, in 1,042 bytes.
| Group | Tools |
|---|---|
| Pages and navigation | list_pages, new_page, select_page, close_page, navigate_page, wait_for, resize_page |
| Input | click, hover, drag, fill, fill_form, type_text, press_key, upload_file, handle_dialog |
| Performance | performance_start_trace, performance_stop_trace, performance_analyze_insight, lighthouse_audit |
| Network | list_network_requests, get_network_request |
| Debugging | list_console_messages, get_console_message, evaluate_script, take_snapshot, take_screenshot, get_css_styles, set_logpoints, screencast_start, screencast_stop |
| Memory | take_heapsnapshot |
| Emulation | emulate |
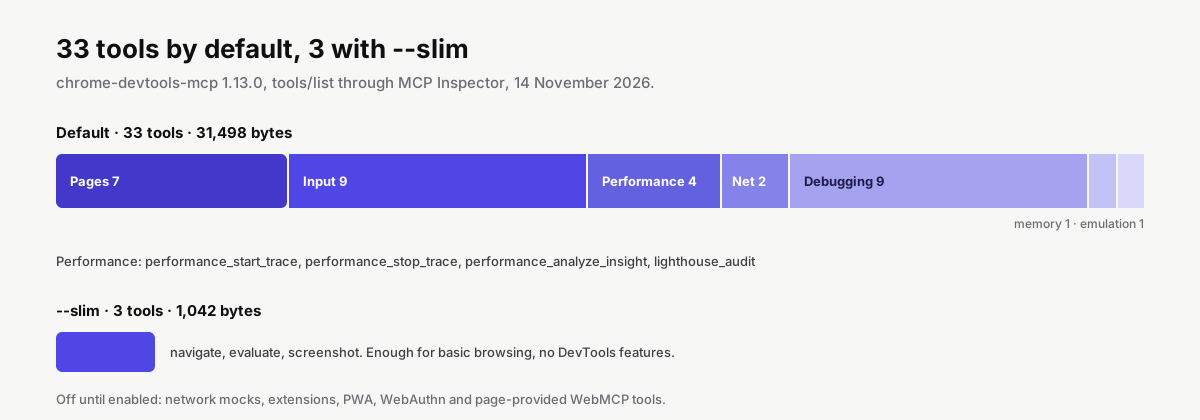
Each group can be switched off with a flag such as --categoryEmulation=false. Others are off until you turn them on: network mocking, extensions, PWA automation, virtual WebAuthn authenticators, and tools a page exposes itself through WebMCP. Turn on only what a task needs; 31 KB of definitions is small next to some servers, but it is sent with every request.
What a trace returns
We started the server headless, opened https://hostedmcp.org/ with new_page, then called performance_start_trace with reload and autoStop on, and finally lighthouse_audit.
The trace call took about 6 seconds and returned 9,436 bytes of text. It reported:
| Metric | Value |
|---|---|
| LCP | 169 ms |
| of which time to first byte | 0.8 ms |
| of which render delay | 169 ms |
| CLS | 0.00 |
Then it listed the insights it found, each with an explanation and, where it applies, an estimated saving: LCP breakdown, render-blocking requests (25 ms of FCP and LCP), the network dependency tree, image delivery, third parties, cache lifetimes and legacy JavaScript. The agent can call performance_analyze_insight on any of them for detail. The reply ends with a description of its own call-tree format, so the model can read the flame-chart data that follows.
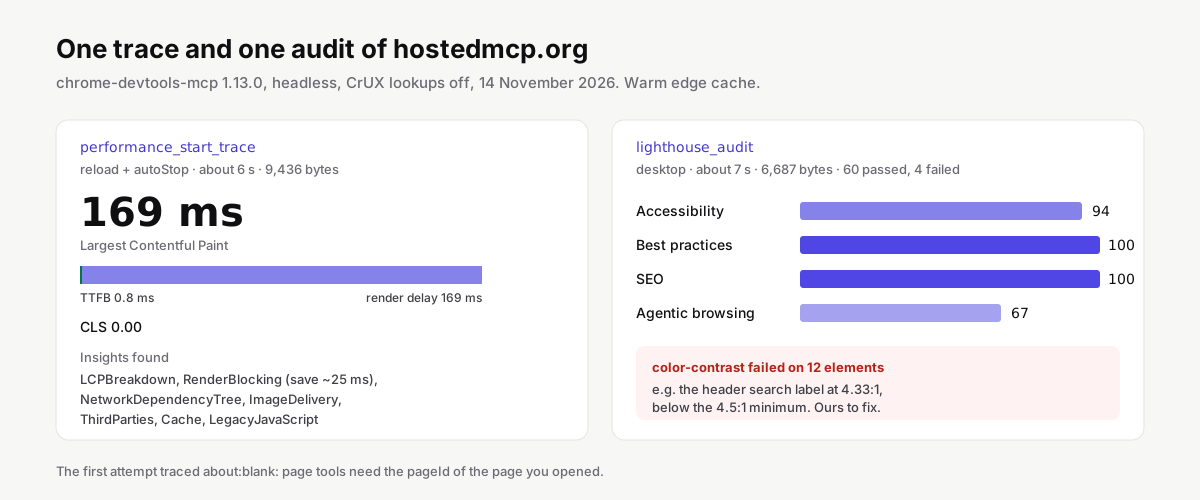
lighthouse_audit took about 7 seconds and returned 6,687 bytes: accessibility 94, best practices 100, SEO 100, and a fourth category, agentic browsing, at 67. Four audits failed. The first was color contrast: twelve elements, among them our header's search label, at a ratio of 4.33 where 4.5 is required. So the tool did its job; we have a fix to make.
Two things about these numbers. The 0.8 ms time to first byte means the page came from a warm edge cache; a cold request would be slower. And because we passed --no-performance-crux, the trace reported no field data from real users; by default the server looks up the page's URL in Google's CrUX dataset.
The pageId trap
Our first run measured about:blank. In 1.13.0, page tools take a pageId, and a new session starts with a blank page as number 1. Our new_page call opened the site as page 2 and marked it selected, but we passed 1. The trace dutifully reported a CLS of 0 for an empty page. Agents usually call list_pages first and get this right; if a trace reports about:blank, this is why.
Use your own Chrome
By default the server starts its own Chrome. It can also attach to one that is already running:
--autoConnectconnects to Chrome 144 or newer after you enable remote debugging atchrome://inspect/#remote-debugging.--browserUrl http://127.0.0.1:9222connects to a Chrome started with--remote-debugging-port=9222.
Attaching to your everyday browser gives the agent your logins, cookies and open tabs. That is the point when you want it to debug a page behind sign-in, and the risk at any other time. Use a separate Chrome profile for it.
Privacy and safety
The server prints a warning when it starts: it "exposes content of the browser instance to the MCP clients allowing them to inspect, debug, and modify any data in the browser or DevTools". Take it literally. Three defaults are worth changing:
- Usage statistics go to Google unless you pass
--no-usage-statistics. They are also off when theCIenvironment variable is set. - CrUX lookups: performance tools may send the URLs you trace to Google's CrUX API. Use
--no-performance-cruxfor internal or staging URLs. - Profile: the default profile persists. Use
--isolatedunless you need state between sessions.
evaluate_script runs JavaScript in the page, and pages can carry text aimed at the model. Approve navigation to unfamiliar sites yourself. We also noticed that 1.13.0 limits file reads and writes, such as saved traces and screenshots, to the system temp folder when the client does not share its workspace roots; --allow-unrestricted-paths lifts that. Leave it in place. More in MCP security.
Chrome DevTools MCP or Playwright MCP
| Chrome DevTools MCP | Playwright MCP | |
|---|---|---|
| Version on 14 November 2026 | 1.13.0 | 0.0.85 |
| Engine | Puppeteer | Playwright |
| Browsers | Chrome officially | Chromium, Chrome, Edge, Firefox, WebKit |
| Default tools | 33 | 25 |
| Unique strengths | Traces, Lighthouse, heap snapshots, CSS styles, logpoints | Accessibility snapshots, cross-browser, test agents |
| Telemetry | Usage statistics on by default | None stated |
Neither project has published a comparison, so this split is ours: Playwright MCP when the agent's job is to use the site, Chrome DevTools MCP when the job is to understand why the site behaves the way it does. Both work side by side; our Playwright MCP guide covers the other half.
When it does not work
| What you see | Cause | Fix |
|---|---|---|
pageId: expected number |
Page tools need a page number in 1.13.0 | Call list_pages or new_page first |
A trace of about:blank |
Wrong page selected | Pass the pageId of the page you opened |
| Lighthouse refuses the page | It cannot audit about:blank |
Navigate first, or use snapshot mode |
| Chrome does not start | No Chrome, or no display for a headed browser | Install Chrome; add --headless on servers |
--autoConnect finds nothing |
Remote debugging not enabled, or Chrome older than 144 | Enable it at chrome://inspect/#remote-debugging |
| Saved trace not where you expect | Client did not share workspace roots | Files go to the temp folder; check there |
| Logins from yesterday still present | Persistent default profile | Use --isolated |
The Chrome DevTools servers in our catalog, with checks scores, are listed at the top of this page.


