
FactGraph MCP server
Commit Nov 3, 2026Enables AI agents and analysts to collaboratively investigate security incidents by linking evidence from disparate logs into a real-time attack graph.
Also known as k3mpaxl/FactGraph
- Stars
- 5
- Tools
- —
- Downloads, 30 days
- —
- Latest version
- —
- Last commit
- Nov 3, 2026
- License
- —
What is FactGraph MCP?
FactGraph enables AI agents and analysts to collaboratively investigate security incidents by linking evidence from disparate logs into a real-time attack graph.
Summary generated from the project's README
About FactGraph MCP server
Security analysts and AI agents can collaboratively investigate complex security incidents by building real-time attack graphs. FactGraph acts as a lightweight relay service that links disparate evidence from sources like EDR, Entra ID, Key Vault, and GitHub into a single, synchronized timeline. Instead of searching through scattered logs, users can visualize how an entity like an IP address or service principal moves through a network over time.
This service is designed to be deployed out-of-band as a stateless container, such as an Azure Web App, to ensure it remains functional even if primary infrastructure is compromised. It does not use a central database; instead, all investigation data lives in the browsers of connected analysts via IndexedDB. AI agents interact with the investigation through MCP or REST, allowing them to query logs and add entities or relationships directly to the shared board. Because the server stores nothing, it provides a secure, ephemeral environment for high-stakes incident response.
What you can do with it
- 1Trace lateral movement across toolsAn analyst can link an IP from an EDR beacon to a service principal sign-in and subsequent secret access.
- 2Automate evidence gathering with agentsAI agents can use MCP to query logs and automatically populate the investigation graph with new entities and relationships.
- 3Maintain a secure out-of-band workspaceTeams can spin up a clean, stateless environment in a separate subscription to avoid using compromised internal systems.
- 4Distinguish between hypotheses and confirmed factsInvestigators can keep claims visible as hypotheses until they are verified against primary log evidence.
Written from the project's README. Every use case is checked against a quote from it.
Configuration
FACTGRAPH_BIND_IP
Automated checks
Ran Nov 15, 2026Full report →Not verified yet. A server needs a score of 80, no serious finding, and enough data for us to check. How checks work · What to fix for more points

- Source repository linked and reachablek3mpaxl/factgraph is public and reachablegithub.com/k3mpaxl/factgraph ↗Pass
- Package names this repository as its sourceNot checked
- Build provenance (Sigstore attestation)Not checked
- Open source license (OSI)No licenseFinding
- Commit or release in the last yearLast commit or release 2026-11-03github.com/k3mpaxl/factgraph ↗Pass
- OpenSSF ScorecardNot checked
- Package name not close to a popular packageNot checked
- No critical advisory in the package or its dependenciesNot checked
- No hidden instructions to the model0 tool descriptions and the README read; no override phrases, credential paths or hidden charactersPass
- Destructive tools are labelledNot checked
- Remote endpoint answers the MCP handshakeNot checked
README
View on GitHubFactGraph: collaborative, agent-native incident investigation
FactGraph is a lightweight relay service where analysts and AI agents work through larger security incidents together. The incident is modelled as a graph: entities (IPs, accounts, service principals, devices, key vaults, repositories …), the relationships and events between them, and for every claim the evidence from logs, KQL results or files. People work in the browser, agents via MCP or REST, all on the same board, synchronised live.
Why FactGraph
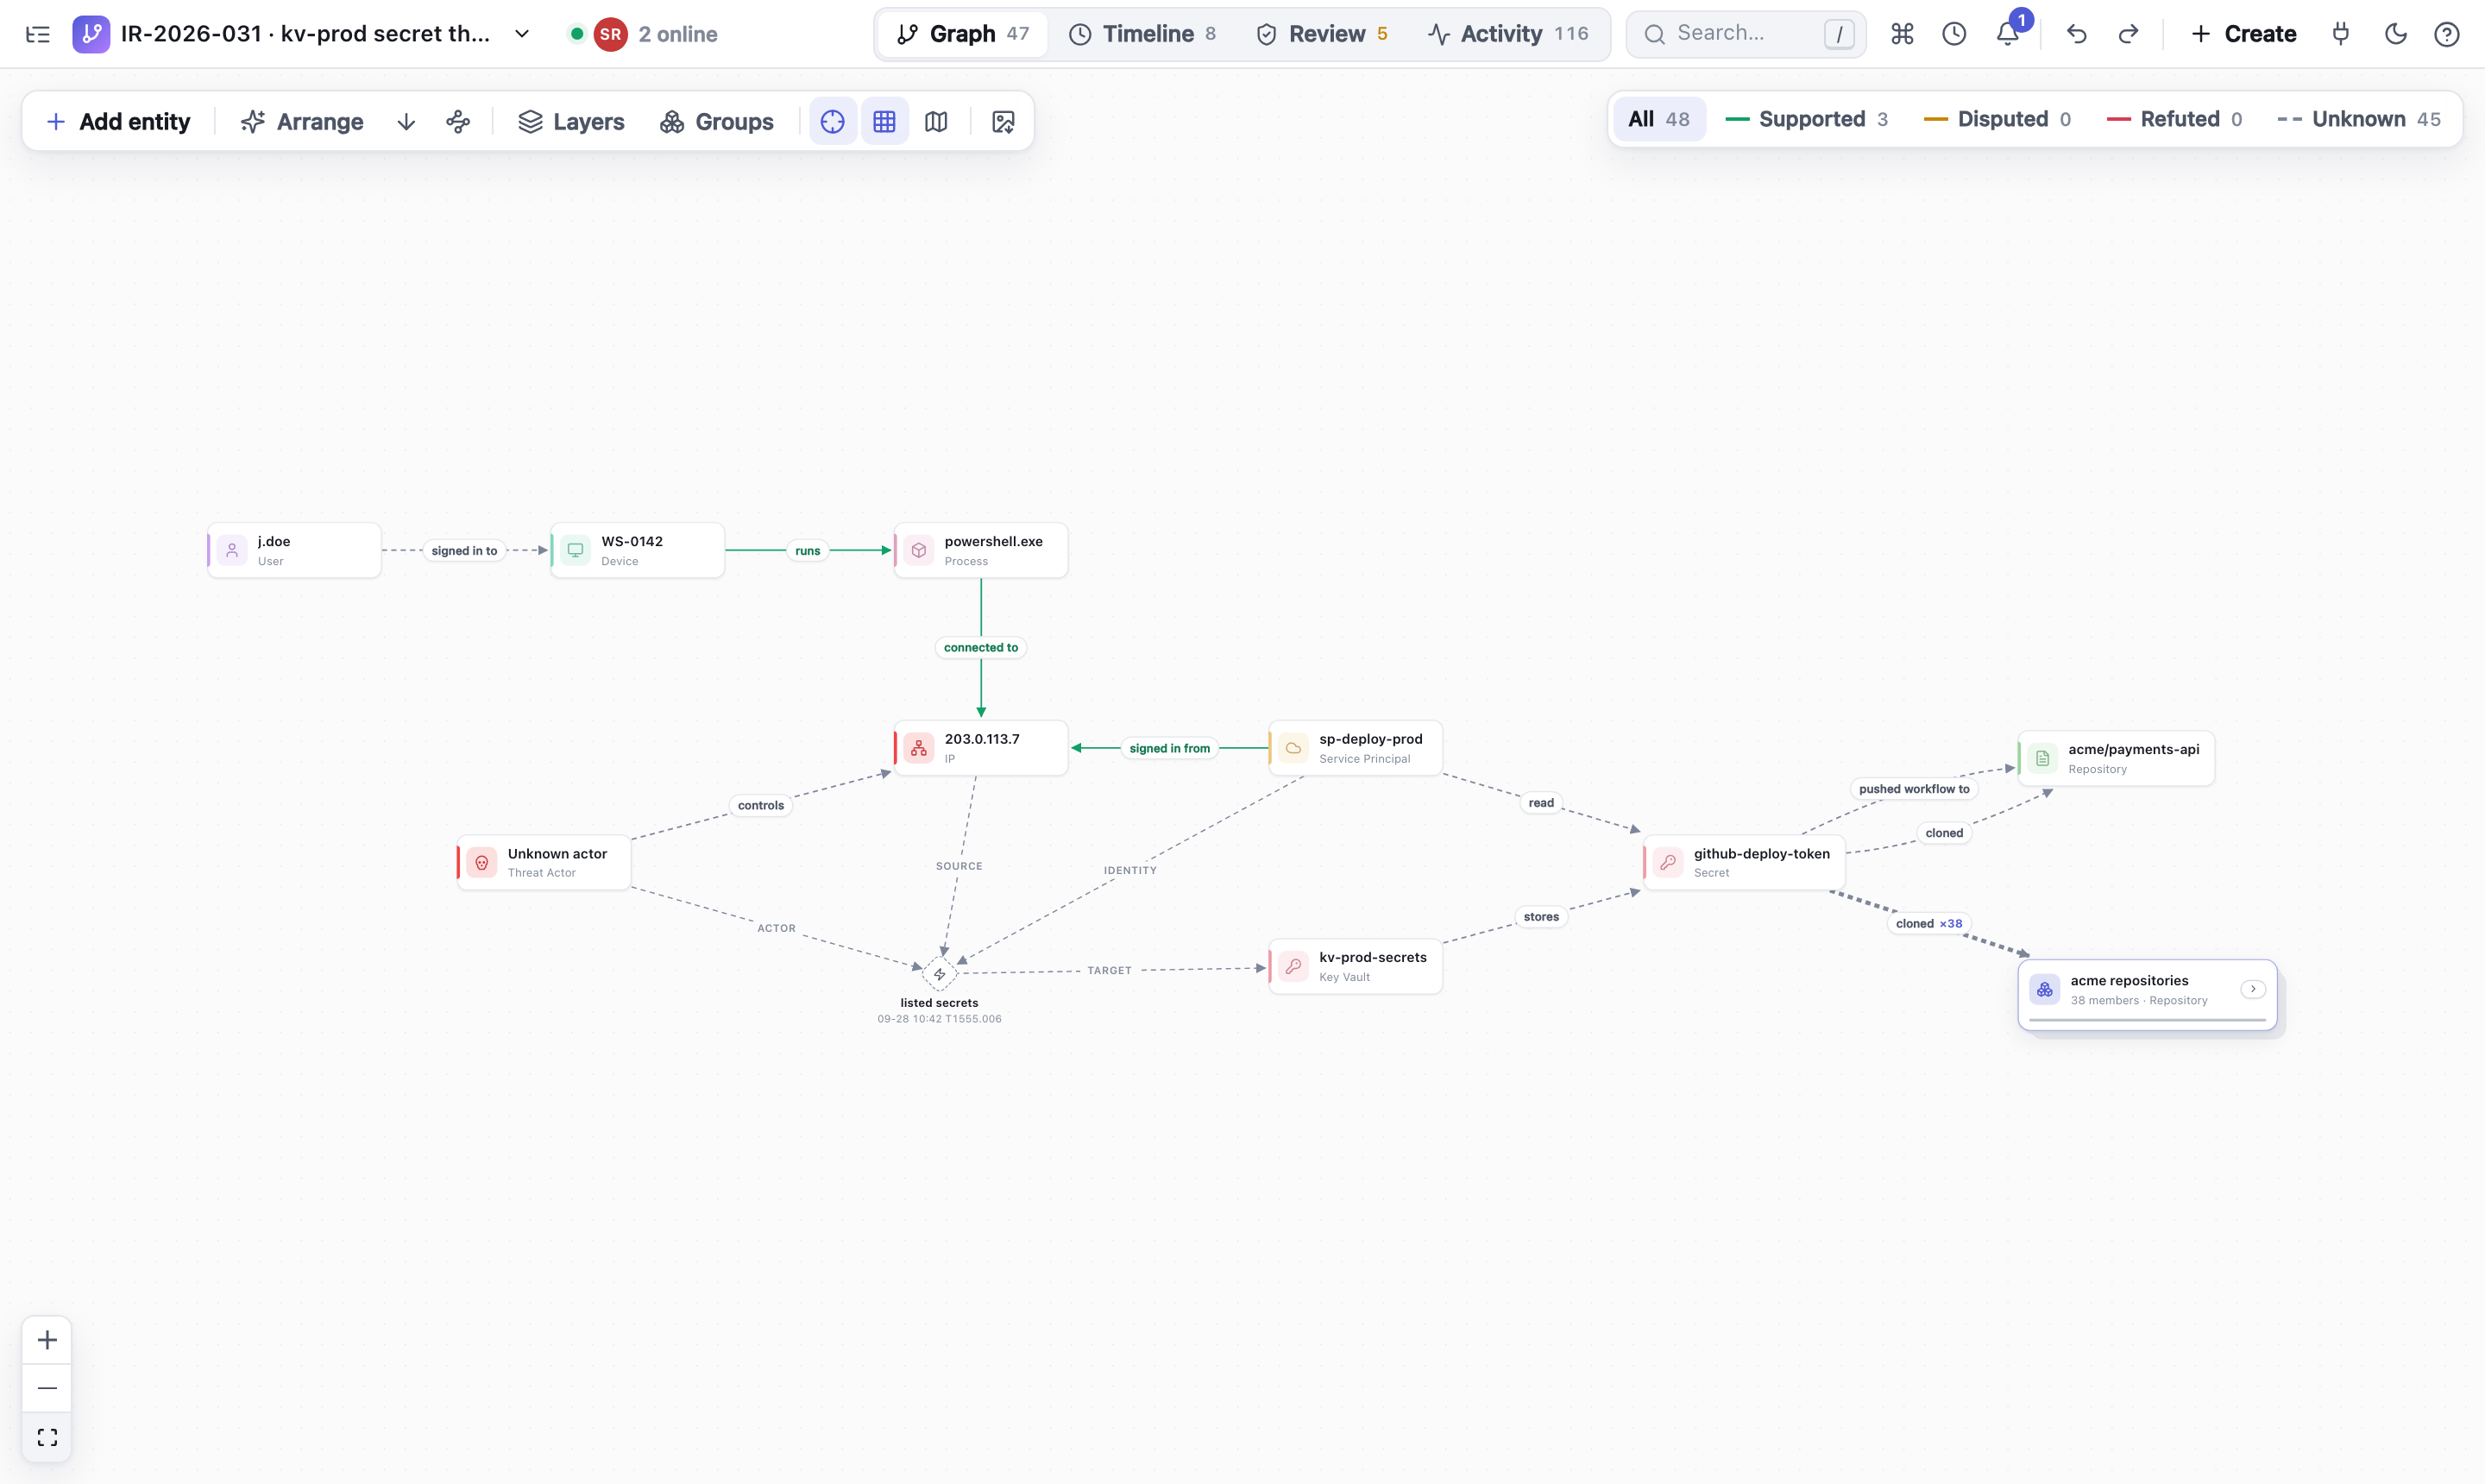
Complex attacks do not show up in a single log. A foothold on an endpoint, a callback to an IP, a service principal sign-in, a secret read from a key vault and a clone of 39 repositories land in four different systems: EDR, Entra ID, Key Vault audit and GitHub. None of these sources references the others. The connection only becomes visible when you put the events side by side as a graph and in time order.
FactGraph is built for exactly that:
- Link sources that are not linked. Every source keeps its original records. FactGraph puts their entities and events into one graph, so you can trace the path across tools: the IP from the EDR beacon is the same IP that signed in as the service principal and listed the vault's secrets.
- Follow the attack through time. Every relationship and event carries the time span the evidence shows. The timeline and the evidence time window replay the attack step by step.
- Keep claims and proof apart. A line in the graph is a claim. It becomes supported only when someone has checked confirmed primary evidence against the original record. Hypotheses stay visible as hypotheses.
- Ready when your own infrastructure is not. During a large-scale compromise you cannot trust the ticket system, the wiki or the chat of the affected environment. FactGraph is a single stateless container: spin it up out-of-band in minutes (for example as an Azure Web App in a separate, clean subscription), use it with minimal resources, and delete it afterwards. There is no database to provision, secure or wipe.
- Agent-native. Attackers already use AI to move faster. Defenders need tools that AI can accelerate too. In FactGraph, agents are first-class: they query logs, add entities, relationships and evidence through MCP or REST, and analysts see the results immediately in the same graph, review them against the source and confirm or refute them.
The result is a shared, traceable picture of the incident instead of findings scattered across chats, tickets and spreadsheets.
Architecture: a relay, not a database
 Analyst A (browser)          Analyst B (browser)
  IndexedDB ◄──────┐          ┌──────► IndexedDB
                   │ WebSocket│
             ┌─────┴──────────┴─────┐
             │   FactGraph server   │   stores no board data
             │  relay · REST · MCP  │
             └─────┬──────────┬─────┘
                   │ REST     │ MCP
          scripts / imports   AI agent (VS Code, Claude Code …)
- Board data lives only in the browsers (IndexedDB). Every change is an action with an ID and a logical clock. All browsers that have a board open exchange these actions through the server and compute the same graph from them.
- The server stores nothing. It serves the UI, relays actions in real time and provides REST and MCP. There is no external database and no login.
- REST and MCP write through an open browser. A call is forwarded to a browser that has the board open and is answered only after that browser has stored it. If no browser has the board open, the API answers
409. - Consequence: a board exists as long as at least one browser holds it. A new device receives the data only while such a browser is connected. Clearing browser data deletes the boards, so export them regularly as JSON (board menu).
Getting started
From Docker Hub (amd64 and arm64):
docker run --rm -p 8080:8080 k3mpaxl/factgraph:latest
With Docker Compose from the repository:
docker compose -f deploy/compose.yaml up --build
Directly with Python 3.11+ and Node.js 20+ (the Docker image and CI use Python 3.14 and Node.js 26):
python3 -m venv .venv
.venv/bin/pip install --require-hashes -r requirements.lock
cd web && npm ci && npm run build && cd ..
.venv/bin/uvicorn app.main:app --host 0.0.0.0 --port 8080
- UI: http://127.0.0.1:8080
- REST documentation: http://127.0.0.1:8080/docs
- MCP endpoint:
http://127.0.0.1:8080/mcp/(Streamable HTTP)
Every board URL contains a UUID (/boards/<uuid>). The board menu (top left) copies the link, creates new boards and lists the boards stored in this browser. Colleagues on the same network open http://<server-ip>:8080/boards/<uuid>. Compose binds to 127.0.0.1 by default; for the LAN:
FACTGRAPH_BIND_IP=0.0.0.0 docker compose -f deploy/compose.yaml up -d
Security: there is no user login. Anyone who can reach the server and knows a board link can read and change that board. Restrict network access (see Security by default and Azure App Service).
Configuration
| Variable | Default | Meaning |
|---|---|---|
FACTGRAPH_MCP_TOOLS |
agent |
agent = compact MCP tool set, full = one rest_* tool per REST operation |
FACTGRAPH_ALLOWED_ORIGINS |
(empty) | Extra browser origins allowed to join the relay, comma-separated (e.g. a dev server). Pages served by FactGraph itself are always allowed. |
FACTGRAPH_BIND_IP |
127.0.0.1 |
Compose only: host interface the port is published on |
Security by default
FactGraph is meant to be spun up during an incident, often in a hurry and sometimes while the regular infrastructure is compromised. The defaults are therefore as strict as possible without configuration:
Nothing at rest on the server
- The server keeps no board data, no history and no files, only the list of browsers currently connected. A seized or compromised server reveals no investigation content; when the incident is over, delete the container or the app.
- The server makes no outbound connections and runs no queries. The UI loads nothing from third parties.
Access
- The board ID in the URL is a random UUID (122 bits) and acts as the board's access key. Treat a board link like a password and share it only through a trusted channel.
- REST and MCP need the board token of a browser tab that has the board open. Tokens are random per tab and board, only valid while that tab is connected, accepted only in the
X-FactGraph-Tokenheader (never in URLs, so they do not end up in proxy or platform logs) and compared in constant time. - The WebSocket relay accepts browsers only from pages served by FactGraph itself (Origin check against cross-site WebSocket hijacking). Identity and token are sent in the first message, not in the connection URL.
Browser hardening (HTTP headers)
Content-Security-Policy: only the app's own scripts, styles, images and connections; no third-party content, no inline scripts (the one tiny theme script is allowed by hash), no framing (frame-ancestors 'none'), no plugins.Referrer-Policy: no-referrer: following a link in evidence never leaks the board URL to another site.X-Frame-Options: DENY,X-Content-Type-Options: nosniff,Cross-Origin-Opener-PolicyandCross-Origin-Resource-Policy: same-origin, a restrictivePermissions-Policy.Strict-Transport-Securitywhen served over HTTPS (also behind a TLS-terminating proxy),Cache-Control: no-storefor API responses.- The Swagger UI under
/docsloads its assets from a CDN and is therefore exempt from the CSP; it contains no board data.
Container
- Runs as an unprivileged user (UID 10001) on a slim Python image.
- No access log (request URLs contain board IDs) and no server banner. The connection lines Uvicorn still logs show
/ws/boards/<board>instead of the ID. - Logs show the client's real IP: the image trusts
X-Forwarded-Foronly from loopback and link-local proxies (169.254.0.0/16, e.g. Azure App Service front ends), so a client cannot fake it. Behind another reverse proxy, setFORWARDED_ALLOW_IPSto its address. - Single port 8080, plain HTTP; TLS is terminated in front (Azure App Service, Caddy, nginx, Traefik, an ingress). The browser automatically uses
wss://for the relay when the page is served over HTTPS.
What it does not do
- There is no user authentication. Anyone with network access and a board link has full access to that board, so restrict network access to the response team.
- Board data lives in the analysts' browsers (IndexedDB). Use trusted devices, and remember that exported JSON files contain the full investigation.
- A board token proves that a browser tab has the board open, not that a human reviewed something. Technically enforced human approval would require separate permissions.
- Provenance labels (parsed by the import, reviewed by …, confirmed by an agent, who marked a compromise) are recorded by the browsers, not signed. Anyone with the board link can connect to the relay and write actions with any author or channel, so treat these labels as reliable within a trusted team, not as proof against a hostile participant. The relay operator can also see board content in transit (it stores none).
- Agents share the tab's board token, and their changes are recorded as that analyst's agent ("MCP (Gregor)"). Only the tab that started a file upload treats its rows as the analyst's own import; the same upload by anything else (an agent, a script) is handled like any other REST write, so its evidence starts unconfirmed.
- Remove board from this browser (board menu) deletes a board's data from this browser's storage; colleagues keep their copies.
Deploying on Azure App Service
Azure App Service takes care of the certificate and TLS, scales down to a small plan and can be restricted to the responders' IP addresses. For a compromised environment, deploy into a separate, clean subscription or tenant, not into the affected one.
RG=rg-factgraph
APP=factgraph-ir-$RANDOM            # becomes https://$APP.azurewebsites.net
az group create -n $RG -l westeurope
az appservice plan create -g $RG -n plan-factgraph --is-linux --sku B1
az webapp create -g $RG -p plan-factgraph -n $APP --container-image-name docker.io/k3mpaxl/factgraph:latest
az webapp config appsettings set -g $RG -n $APP --settings WEBSITES_PORT=8080
az webapp config set -g $RG -n $APP --web-sockets-enabled true --always-on true \
  --min-tls-version 1.2 --ftps-state Disabled --http20-enabled true
az webapp update -g $RG -n $APP --https-only true
Restrict access to the response team (adding an allow rule denies everything else):
az webapp config access-restriction add -g $RG -n $APP --rule-name responders \
  --action Allow --ip-address 198.51.100.0/24 --priority 100
Notes:
- Exactly one instance. The relay keeps the list of connected browsers in memory; with several instances, analysts on different instances would not see each other. Do not scale out.
- Web sockets must be on, otherwise the board stays offline. Always On prevents the app from idling and dropping connections.
- Prefer a pinned version (
k3mpaxl/factgraph:0.6.3) overlatestduring an incident, so a restart never changes the version. - App Service HTTP logging is off by default. If you enable it, it records request URLs, which contain board IDs.
- WebSocket limits per plan: every open FactGraph tab holds one connection. App Service allows 5 per instance on F1 (Free), 35 on Shared and 350 from B1; above the limit, browsers get HTTP 429 and stay offline. Use B1 or higher. Browsers send a heartbeat, and the server closes connections that stay silent (closed laptops, changed networks), so slots are freed without restarting the app.
- App Service Authentication (Entra ID sign-in) can be put in front of the UI. Agents and scripts then also need an Entra token, and if the incident involves your own tenant, an identity provider you cannot trust is no protection. IP access restrictions are often the better choice there.
- When the incident is closed: export the boards as JSON, then
az group delete -n $RG. Nothing remains on the server side.
Working in the graph
Interface
- A slim header with the board menu, the views (Graph, Timeline, Review, Change log, Impact, keys
1–5), Find entity, undo/redo, Create and the API/MCP menu. On the left the collapsible entity explorer (grouped by type), on the right the inspector, which appears only when something is selected. - The header shows who is online: avatars of everyone connected to the board. A click lists them, together with recent authors who are no longer connected, such as agents writing via REST or MCP.
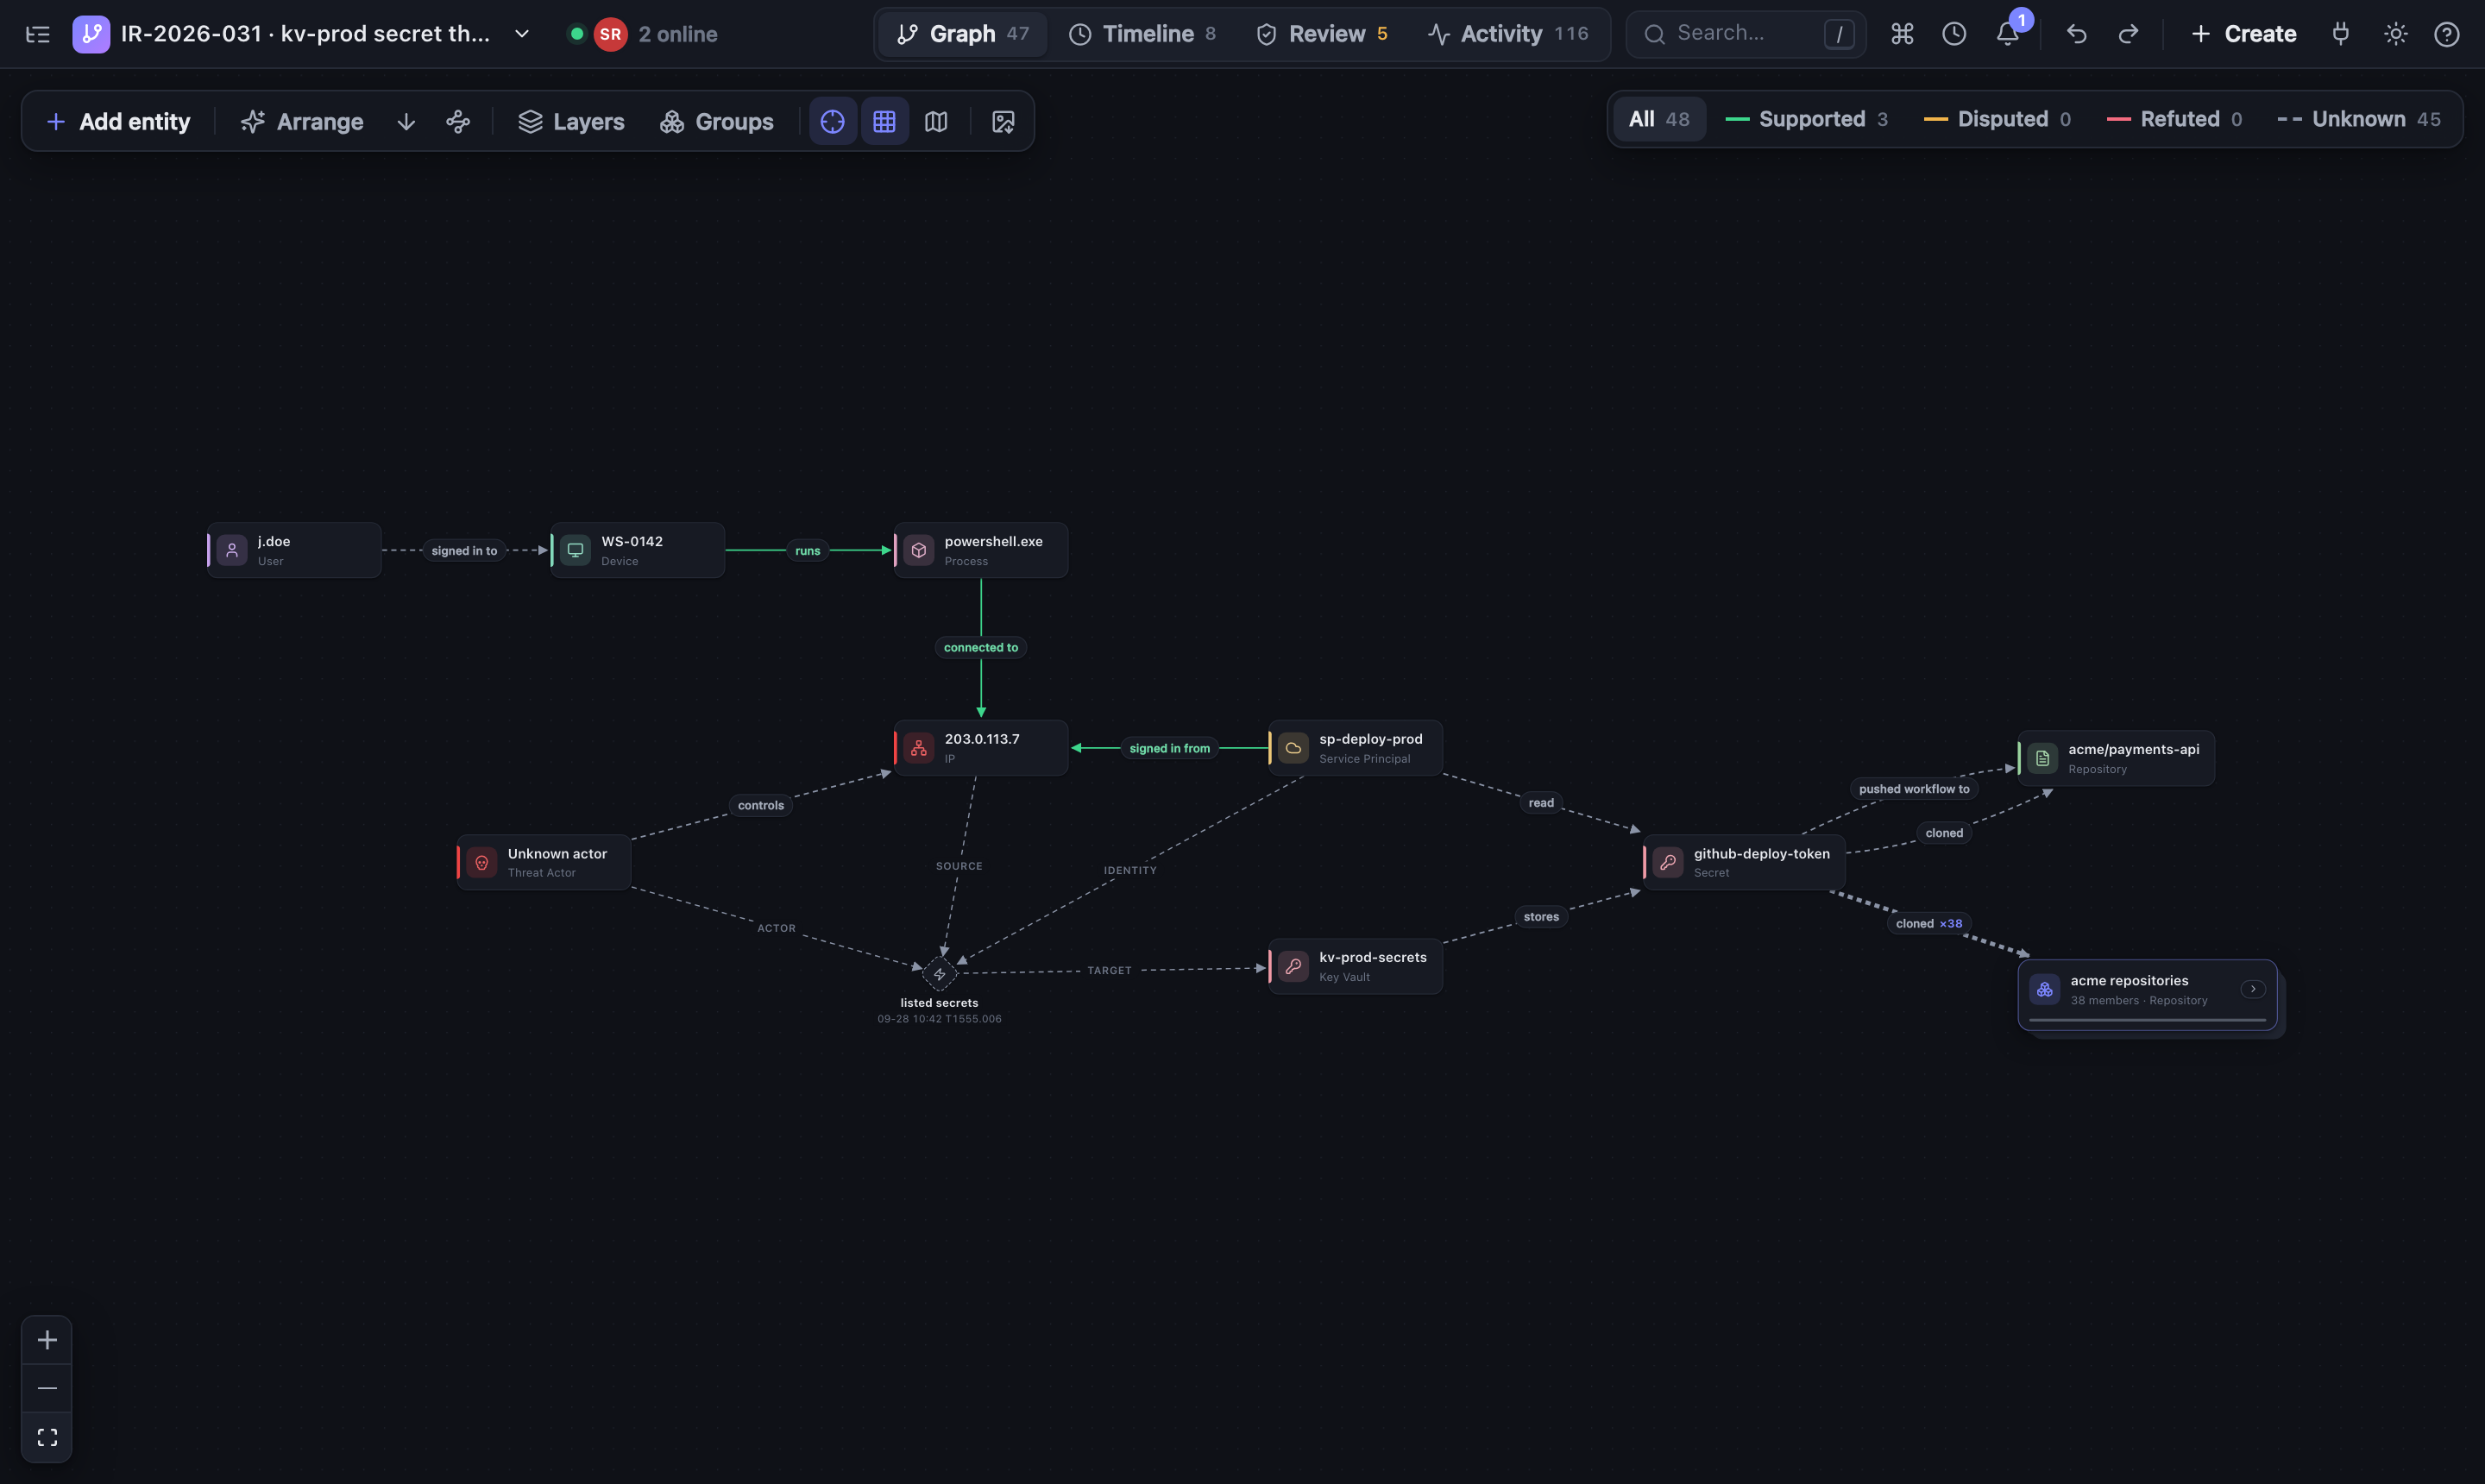
- Light mode is the default; the moon icon switches to dark mode and the choice is remembered.
- On the first visit FactGraph asks for a display name, which other analysts see in the presence list and in the history.
- The ? (top right) explains where data is stored, shows the storage used, can ask the browser for persistent storage, offers the JSON export and shows the app and server versions. The second tab lists all keyboard shortcuts, the third is a glossary of statuses, review, stance, confidence, layers and the other terms.
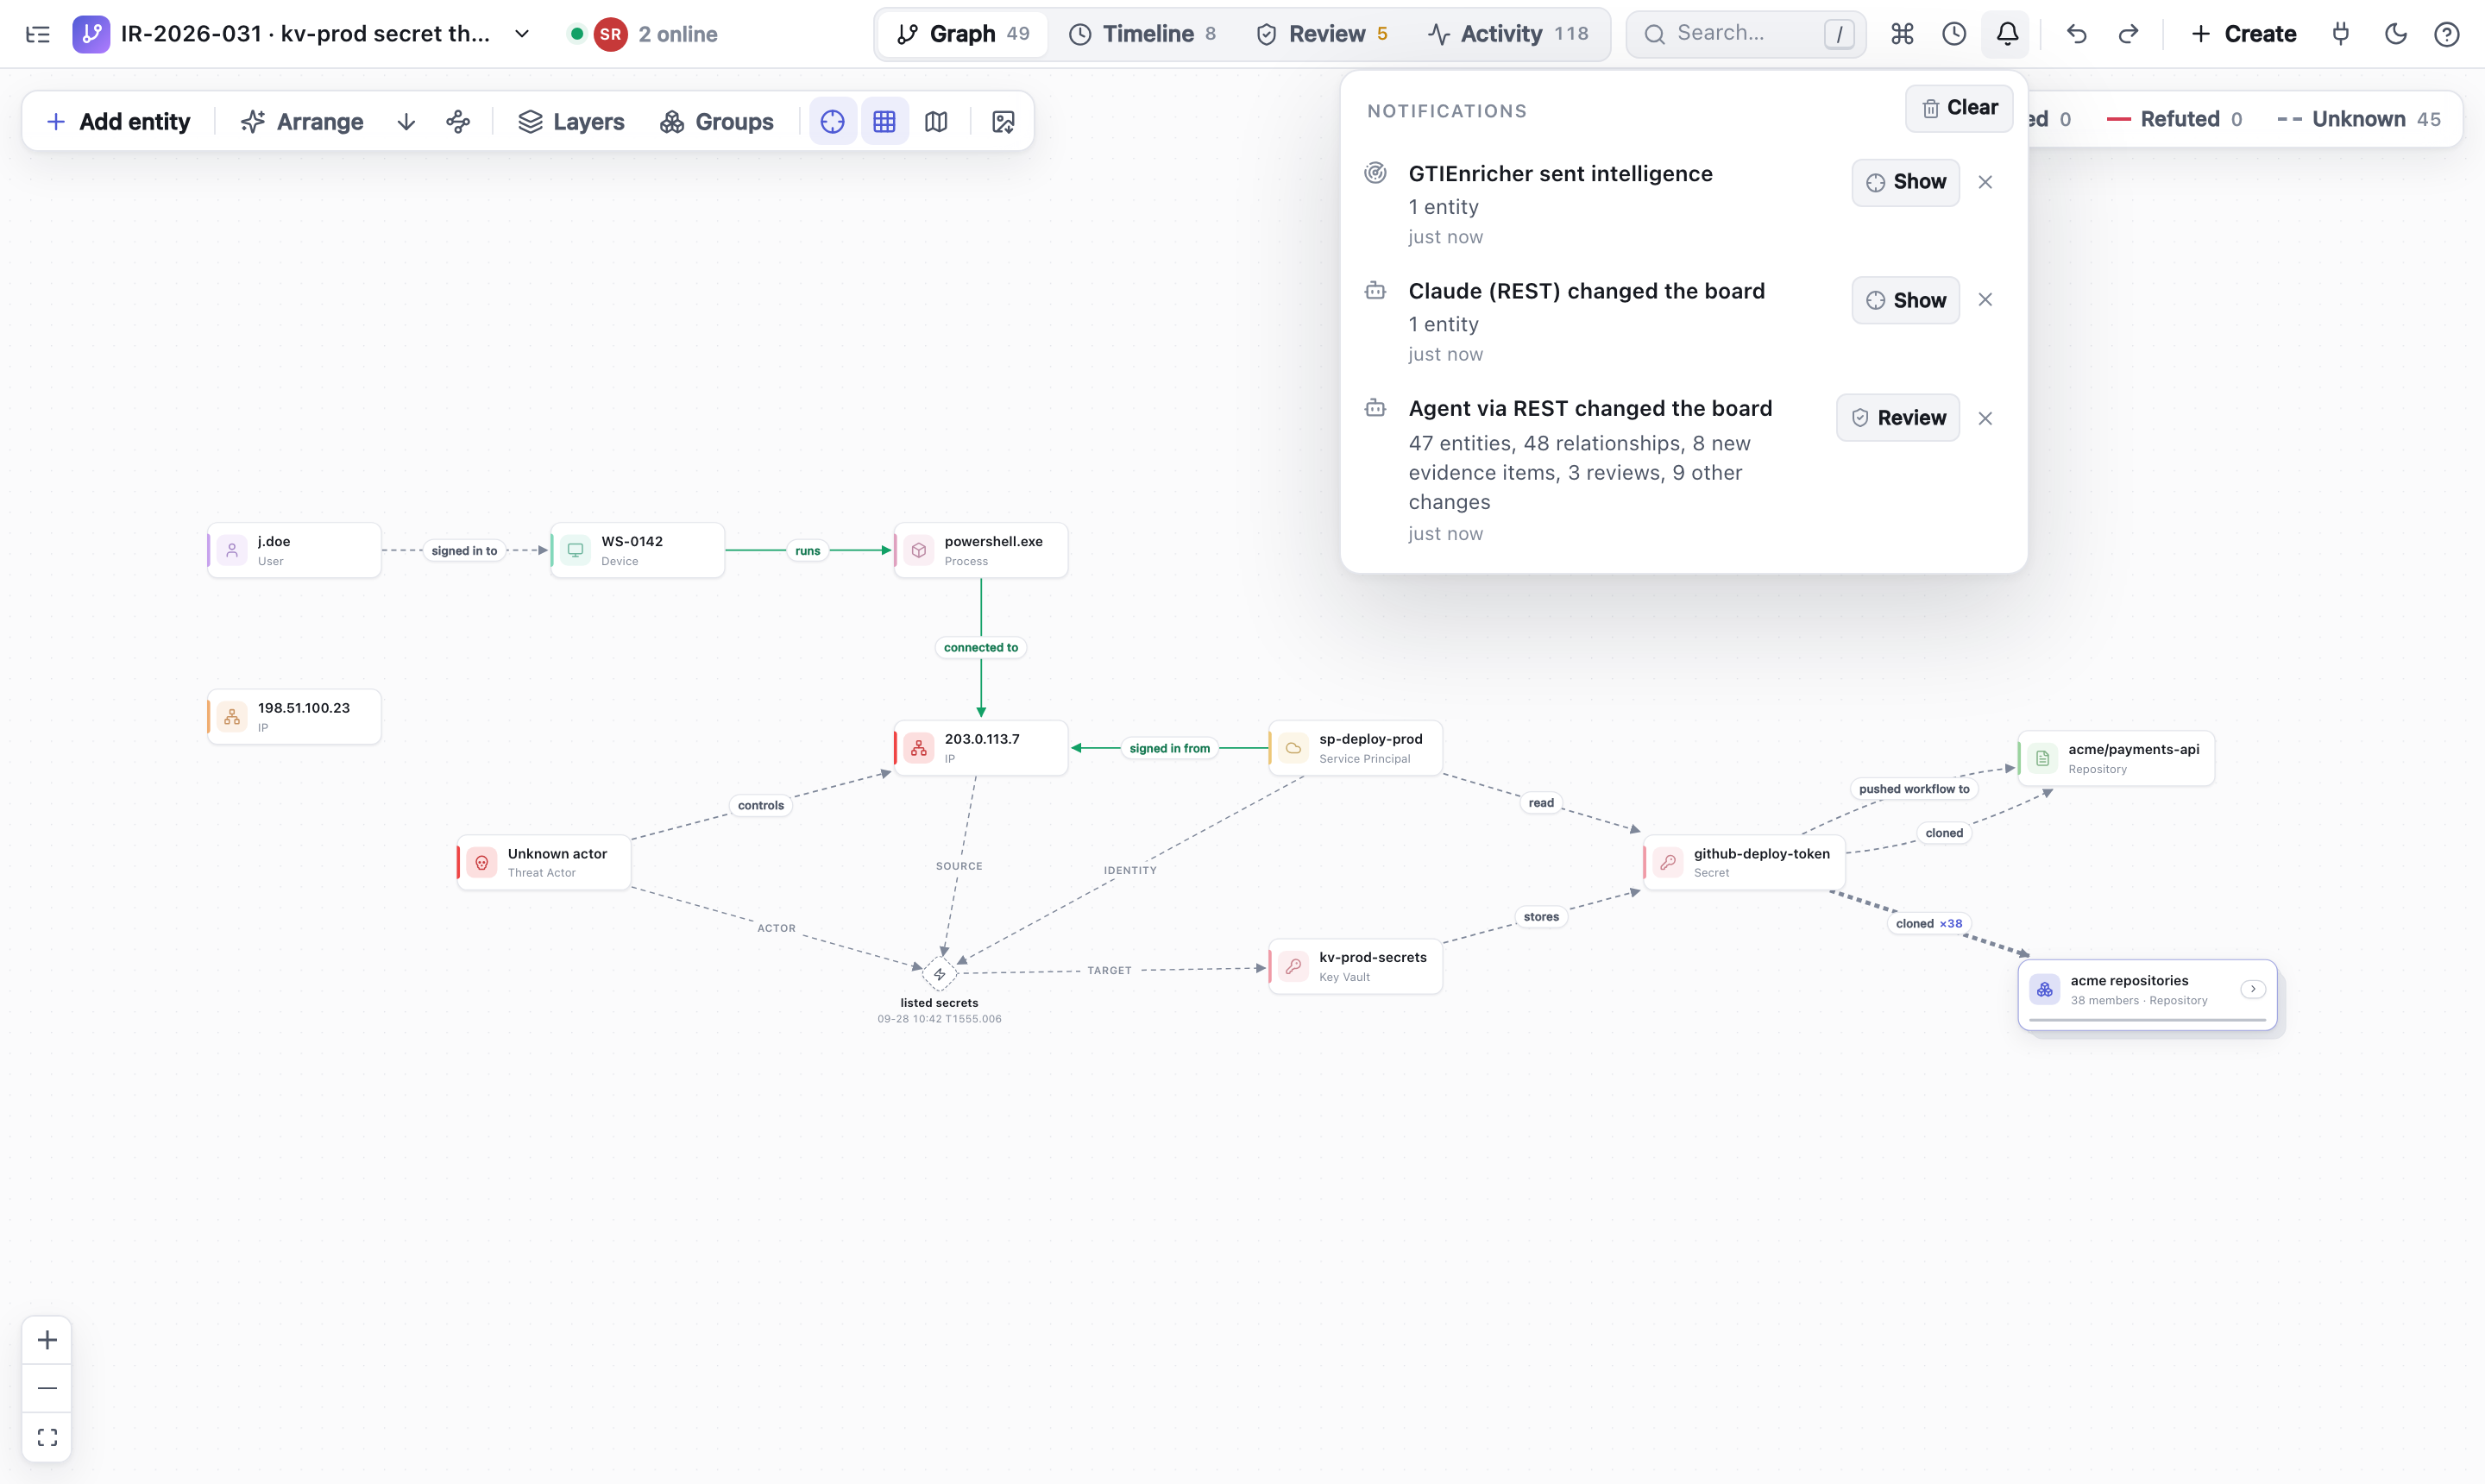
- The bell collects what happened on the board: changes by agents (REST/MCP; the calls of one agent within two minutes become one entry), intelligence sent by Enricher (formerly GTIEnricher), colleagues' changes (listed, but they do not raise the badge), your own imports and exports with progress and result, and connection or storage problems. Each entry leads to the review, the item or the change log. The badge turns red on errors; the history is kept per board in this browser.
- Your view stays yours: status filter, evidence window, layers, selection and zoom are remembered per board in this browser and restored on reload. They are never synced, so colleagues keep their own view. Board menu → Reset my view clears them. A shared perspective link still takes precedence.
Entities, relationships, evidence
- Add an entity: Add entity (pick a type or drag it onto the canvas), double-click on empty canvas, or press
N. - Connect: drag the right-hand handle of a node onto another node, or onto empty canvas to create the target and the relationship in one step.
- Double-click a title to rename it. Right-click offers type and color, merge, copy ID, pin, delete, collapse contents and taking an entity out of its group.
- Colors: the color picker offers default swatches plus the colors already used on the board, so related infrastructure (for example all C2 servers) gets the same color in one click.
- The inspector shows relationships, identifiers and evidence and navigates to neighbours on click. Copy context for agent copies IDs and context for an agent chat.
- Long edge labels are shortened; hovering or selecting an edge shows the full label.
- Dialogs pick entities by search (name, type, identifier or ID) and show what each belongs to (repository, host, subscription) and its identifiers, so two
.envfiles in different repositories are told apart; same-named entities are flagged. - Merge shows a preview before saving: which entity stays and which disappears, how many identifiers and relationships move, how many confirmed evidence items need a review again, and what is dropped (type, description, a compromise marking).
- An entity can be related to itself (for example after merging two entities that were connected); the graph draws a loop.
- Times in dialogs are UTC, whatever the browser's time zone.
Large graphs
- Focus: a selection highlights its direct neighbours and fades the rest.
- Jump:
Cmd/Ctrl+Kopens the command palette; picking a result selects it and zooms to it with its neighbours. - Level of detail: labels and node details appear as you zoom in. Edges attach to the node border; parallel relationships are curved.
- Minimap appears automatically from 60 nodes.
- Arrange: up to 250 nodes as a directed flow (left → right, or ↓ for top → bottom), above that organic (force layout: connected nodes form clusters, cards never overlap; also available directly via the node icon). 1,100 nodes take about two seconds. Pinned nodes keep their position. For a large graph with many similar entities, Group all similar first: five real Sentinel and GitLab exports (8,584 rows) made 2,822 nodes, grouped 167, which the flow layout arranges readably.
- Status filter and evidence time window (
T) filter edges by review status and time span; the time window can be played back step by step. - Performance: one projection of the action log is shared by the canvas, the inspector and every REST/MCP request; evidence times are parsed once per change. A board with 12,000 actions (2,000 entities, 5,000 relationships) projects in about 15 ms, and moving the evidence window takes about 2 ms.
npm run benchchecks this on a synthetic board.
Mouse, trackpad, keyboard
| Input | Action |
|---|---|
| Mouse wheel, trackpad pinch | Zoom |
Right mouse button drag, two-finger trackpad swipe, Space + drag |
Pan |
Shift + mouse wheel |
Pan sideways |
| Left mouse button drag on empty canvas | Box select |
Cmd/Ctrl+K |
Command palette / find entity |
/ |
Focus search |
N |
New entity |
F |
Fit graph or centre the selection |
G |
Group selection |
1–4 |
Switch view |
E / T |
Explorer / time window |
Cmd/Ctrl+Z, Shift+Cmd/Ctrl+Z |
Undo / redo |
Delete |
Delete selection |
? |
Help and shortcuts |
Activities, layers and groups
Events with several participants
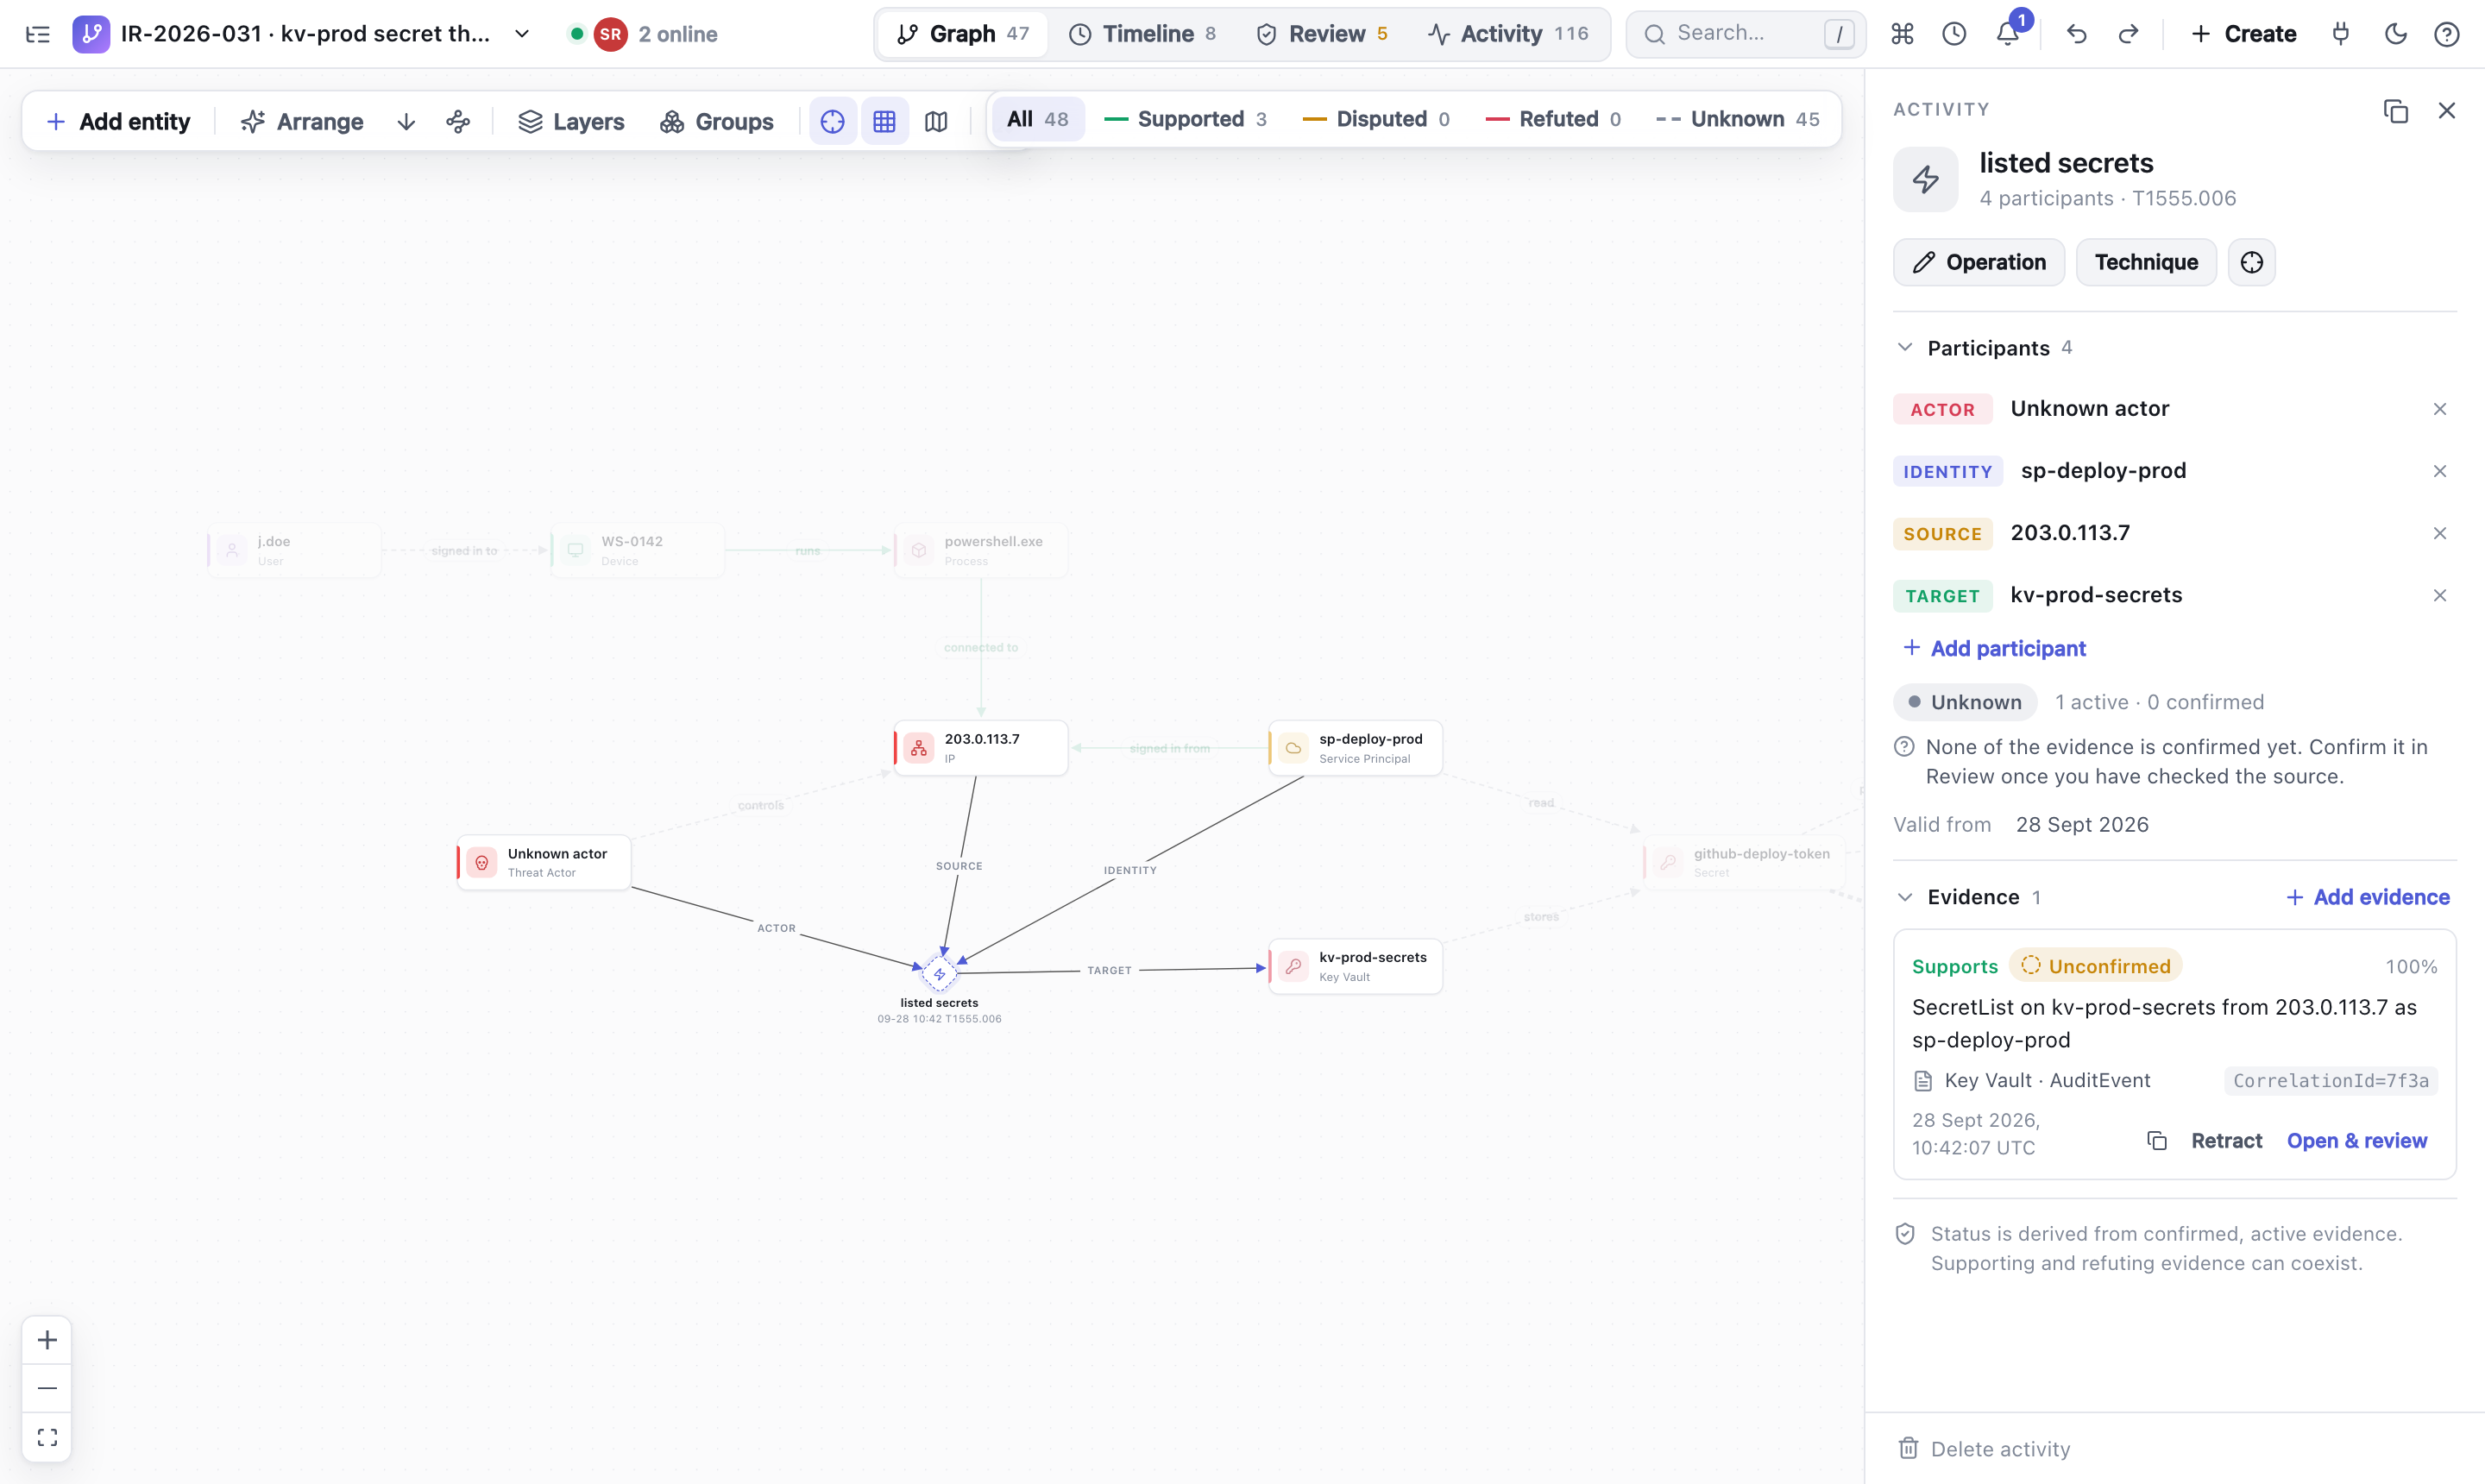
"The attacker uses IP a.a.a.a and service principal B and lists key vault C" is one event, not three edges. An activity has an operation (listed secrets), optionally a MITRE ATT&CK technique, a time span and participants with roles:
| Role | Meaning |
|---|---|
actor |
who acts (attacker, user) |
identity |
the identity used (account, service principal) |
source |
where it came from (IP, device) |
tool |
tool or process |
via |
intermediate system |
target |
what was acted upon |
other |
other participants |
Evidence is attached to the whole event; review, status, timeline and time window work just like for relationships. On the canvas an activity is a diamond with labelled spokes; under Layers it can also be shown as a simple edge. The attribution "this IP belongs to the attacker" is a separate relationship with its own evidence.
Layers and perspectives
Every type belongs to a layer: Identity & access, Network, Endpoint, Workload (Kubernetes, containers), Cloud control plane (subscriptions, key vaults), Data & storage (buckets, blobs, databases), Code & CI, Other. The layer is derived from the type and can be overridden per type or per entity.
Layers shows and hides layers (a badge on a node counts connections into hidden layers), draws swimlanes and arranges by layer. Combinations can be saved as a perspective, are synchronised with the board and can be linked with ?lens=<id>.
Collapse contents: if a device or cluster has contains, runs or hosts relationships, the context menu entry Collapse contents folds everything it contains into the node ("12 inside").
Groups
A group bundles many entities into one node, for example 699 of 700 repositories where the same thing happened. Members are explicit (multi-select, G) or rule-based (type and/or text pattern); new matching entities join automatically. Take out keeps individual entities visible outside the group, typically exactly the ones where something different happened. Edges to the group are bundled and counted (cloned ×38). Groups in the canvas toolbar suggests groups from entities of the same type with identical connections and names the outliers.
Group all similar (Groups popover or command palette) does this for the whole board in one step (one undo): first entities of one type with the same operations and the same counterparts in the same roles (41 Azure Resource · write cognitiveservices/accounts/deployments), then the rest of one type that share their counterparts with different operations, then those with the same operations and the same shared counterparts, each with partners of its own (89 files one user read from one IP, each in its own repository; a counterpart is shared when it takes part in at least four activities, and every group needs one). At least four per group; pinned and already grouped entities stay as they are, and so does the one that differs. The groups are collapsed and the smaller graph is arranged. Dropped exports do the same for the entities they add: a hub-and-spoke export such as AzureActivity (one service principal, one IP, hundreds of resources) arrives as a few groups instead of a fan of hundreds of nodes. Activities with the same operation between the same nodes are then drawn as one diamond with a count and the time span (delete ×12); expand the group to see them one by one.
When later evidence sets a member apart. A group made by Group all similar or an import remembers why its members belong together (the same links, the same counterparts, the same shared counterparts or the same network). If later evidence makes one of them different, for example the attacker also lists the keys of one of 41 resources, the group card says 1 differs and the group's inspector names it with what changed (+ listkeys) and takes it out in one click (one undo). A member is compared with what most members share now, so a change they all share (an import that adds the same activity to each) sets nobody apart. Groups are never split on their own: the badge is computed in every browser alike and nothing is written until an analyst takes members out. Groups you make by hand or by rule are not judged.
Collapsed and expanded groups share one place: drag the collapsed card and the members appear there when you expand it; drag an expanded group by its frame header and all members move along. Members that were scattered (collected by Group all similar or an import from all over the board) are laid out as a grid sorted by name right next to the card, growing away from the middle of the graph so the neighbouring cards stay visible; members you arranged yourself keep their arrangement. Activities that were drawn as one while the group was collapsed are placed between their participants again. Groups and perspectives change only the view, never claims or evidence.
FactGraph MCP questions
Does FactGraph store investigation data in a database?
No, the server is a stateless relay that stores no board data; all information lives in the users' browsers using IndexedDB.
How do AI agents interact with the investigation?
Agents can query logs and add entities, relationships, and evidence through MCP or REST interfaces, making their findings immediately visible to human analysts.
Is there a user login system for FactGraph?
There is no formal user authentication; access is controlled by a unique, random UUID in the board URL which acts as an access key.
Can I run FactGraph without provisioning a database?
Yes, it is a single stateless container that can be spun up in minutes without any database to provision, secure, or wipe.