
Dash MCP server
Commit Nov 14, 2026Provides a CI/CD feedback loop and guardrail for AI agents to prevent hallucinations by exposing build statuses, logs, and wait commands via MCP.
Also known as adamoutler/dash
- Stars
- 2
- Tools
- —
- Downloads, 30 days
- —
- Latest version
- —
- Last commit
- Nov 14, 2026
- License
- MIT
What is Dash MCP?
Dash provides a CI/CD feedback loop and guardrail for AI agents to prevent hallucinations by exposing build statuses, logs, and wait commands via MCP.
Summary generated from the project's README
About Dash MCP server
Dash acts as a centralized hub and safety mechanism for autonomous AI agents interacting with CI/CD pipelines. It provides a feedback loop that allows agents like Claude, Gemini, or GPT to verify their work by accessing real-time build statuses and logs. This prevents agents from making incorrect assumptions about code changes or pushing broken updates to main branches.
Developers can deploy the system using a single docker-compose up command. The server supports GitHub, Forgejo, Gitea, and Jenkins as CI providers. It features a built-in MCP server at the /mcp endpoint that exposes specific tools including get_status, get_logs, and wait. These tools allow agents to programmatically check project health, retrieve debugging information, and pause execution until a pipeline completes.
For human users, the platform offers a visual dashboard with color-coded statuses and deep links to specific logs or deployments. Security is managed through role-based access, supporting Basic Auth, Bearer Tokens, and Google OAuth to ensure that administrative controls remain protected while providing read-only visibility to teams.
What you can do with it
- 1Preventing broken code pushesAn AI agent can verify that its changes passed all tests before finalizing a task.
- 2Autonomous debugging of failuresAn agent can automatically retrieve and analyze build logs when a CI pipeline fails.
- 3Automated CI pipeline monitoringAn agent can pause its workflow to wait for a specific build to finish.
- 4Centralized build oversightA developer can view the current status of all tracked repositories on a single screen.
Written from the project's README. Every use case is checked against a quote from it.
Automated checks
Ran Nov 16, 2026Full report →Not verified yet. A server needs a score of 80, no serious finding, and enough data for us to check. How checks work · What to fix for more points

- Source repository linked and reachableadamoutler/dash is public and reachablegithub.com/adamoutler/dash ↗Pass
- Package names this repository as its sourceNot checked
- Build provenance (Sigstore attestation)Not checked
- Open source license (OSI)MITspdx.org/licenses/MIT.html ↗Pass
- Commit or release in the last yearLast commit or release 2026-11-14github.com/adamoutler/dash ↗Pass
- OpenSSF ScorecardNot checked
- Package name not close to a popular packageNot checked
- No critical advisory in the package or its dependenciesNot checked
- No hidden instructions to the model0 tool descriptions and the README read; no override phrases, credential paths or hidden charactersPass
- Destructive tools are labelledNot checked
- Remote endpoint answers the MCP handshakeNot checked
README
View on GitHub🛑 Stop AI Hallucinations! Your Ultimate Dash & Agent Guardrail 🚀


The essential CI feedback loop and guardrail for autonomous AI development.
Tired of your AI agent confidently hallucinating: "I changed it, so now it works. I'll push the changes!" only to break the main branch? 🤦
Welcome to the Dash—a beautifully simple, Dockerized hub that gives you an at-a-glance view of your projects, while serving as the ultimate guardrail for your AI agents (Claude, Gemini, GPT). Without a feedback loop from your Continuous Integration (CI) pipeline, agents fly blind. This dashboard serves as a foundational building block to provide immediate, factual build feedback to autonomous agents, stopping regressions in their tracks.
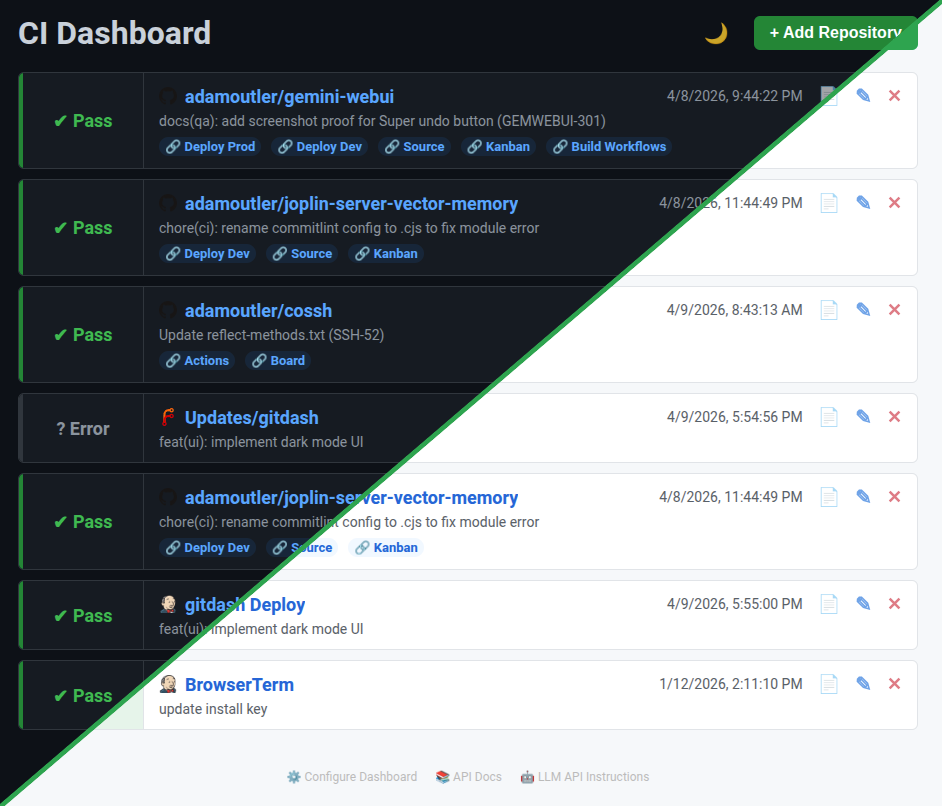
"A unified dashboard for your autonomous agents, beautifully designed for your workflow—whether you prefer the light of day or the terminal dark."
✨ Key Features
- 🔐 Secure & Authenticated: Role-based access with Basic Auth and Bearer Token management. (Highly recommended: See our Security & Authentication Guide to lock down your dashboard).
- 🤖 AI-Ready MCP Server: Built-in JSON-RPC 2.0 endpoint (
/mcp) exposing essential macros (get_status,get_logs,wait) for agents. - 📜 Agent Discovery: Includes
llms.txtat the root so autonomous agents can self-discover capabilities. - 🚦 Unified Visual Dashboard: A clean, centralized UI to view build statuses across all tracked repositories at a glance.
- 🔌 Multi-Provider Support: Seamlessly integrates with both GitHub and Forgejo CI/CD pipelines.
- 🛡️ Autonomous Guardrail: Allows agents to estimate wait times, wait for CI runs, and fetch logs autonomously to prevent broken pushes.
- 🐳 Dockerized Simplicity: Easy to deploy with a single
docker-compose upcommand.
🤖 For AI Agents: The Guardrail API
By pointing your agent to the repository URL and our llms.txt (see a raw example of what the LLM sees here), you instantly give them superpower hooks to interact with your CI/CD pipeline. No more blind pushes! Your agent can now:
-
📚 Comprehensive AI Guide: See the full AI/Agent Journey for detailed automated workflows.
-
⏱️ Estimate wait times for CI runs.
-
⏳ Wait patiently for the CI pipeline to finish.
-
📥 Receive immediate results the second the build passes or fails.
-
📜 Request full CI logs to autonomously debug failures.
-
🔗 Access important URLs and check the current build status programmatically.
🔌 MCP Server (Model Context Protocol)
The dashboard natively supports the Model Context Protocol (MCP). Autonomous agents (like Claude Desktop or Gemini) can connect directly to the /mcp endpoint via JSON-RPC 2.0.
get_status: Get a clean, markdown-formatted status report of any configured project, keeping your terminal tidy while the agent gets raw JSON context.get_logs: Retrieve the direct log URL for a failing build.wait: Instruct the agent to sleep and wait for the CI pipeline to complete before proceeding.- Self-Discovery: The
repoandworkflowparameters for these tools support a"help"argument, allowing agents to automatically discover what repos they can track without guessing!
🔌 Pro-Hacks: Setting Up Agent Hooks
Agents can discover how to use the dashboard simply by reading the llms.txt file at the root URL. You can use standard prompts to wire up these hooks:
Hack 1: The "Push & Wait" Hook
Instruct your AI (Claude/Gemini/GPT) to run a script after pushing code that waits for the build and echoes the result:
"After pushing code, run a script to wait for the build. Fetch the results using
curl -N -s 'https://your-dashboard-url/api/wait?provider=github&owner=your_user&repo=your_repo' | jq .statusand report back to me."
Hack 2: The "Tooling" Hook
Give your agents a custom tool to gather build results across all your projects so they can check statuses before deciding what to work on next:
"Before marking the task as complete, gather build results from the Dash using
curl -s https://your-dashboard-url/api/statusto verify that your changes did not break the build."
💻 For Humans: The Visual Hub
Beyond acting as an API for AI, the Dash provides a clean, unified graphical experience for human developers. It's all about peace of mind:
-
🗺️ Comprehensive User Guide: See the full User Journey for detailed human workflows.
-
🎨 Visual Sanity & At-a-Glance Status: A clean, large-font UI to view the current build status of all your projects on a single screen.
-
🚦 Color-Coded Statuses: Instantly see what's Running, Passed, or Failed. Stop digging through nested CI provider menus just to see if your
mainbranch is green. -
🎯 Deep Linking & Quick Actions: Custom quick-action links (Deploy, Source, Kanban) get you exactly into the specific failing pipeline, commit, or log output you need to investigate with zero friction.
➕ Adding Repositories in the UI
When clicking + Add Repository in the dashboard, the input format depends on the CI provider you select:
- GitHub / Gitea / Forgejo:
- Owner: The username or organization name (e.g.,
adamoutler). - Repo: The repository name (e.g.,
dash).
- Owner: The username or organization name (e.g.,
- Jenkins:
- Owner: A custom display name for the dashboard (e.g.,
dash DeployorBrowserTerm). - Repo: The full URL to the main project/job page (e.g.,
https://jenkins.adamoutler.com/view/Upgrades/job/Updates/job/dash/job/master/).
- Owner: A custom display name for the dashboard (e.g.,
🚀 Get Started
For AI Agents:
Just point your agent to <your-dashboard-url>/llms.txt and tell it to read the docs. It will know exactly what to do! 🧠
For Humans (Deployment):
- Clone the repo:
git clone <repository-url> cd ci-dashboard - Set your
GITHUB_TOKEN,FORGEJO_URL, and/orFORGEJO_TOKENin your environment (or.envfile). - Run via Docker Compose for a stress-free setup:
docker-compose up -d
(Note: Keep it safe! Run locally or on an internal network, not the public internet).
📸 Contextual Screenshots & Visual Tour
Dash enforces a 4-Domain Authentication Architecture that keeps build statuses and logs effortlessly viewable while locking down all write operations, configuration settings, REST API tokens, and MCP OAuth agent sessions behind dedicated security boundaries.
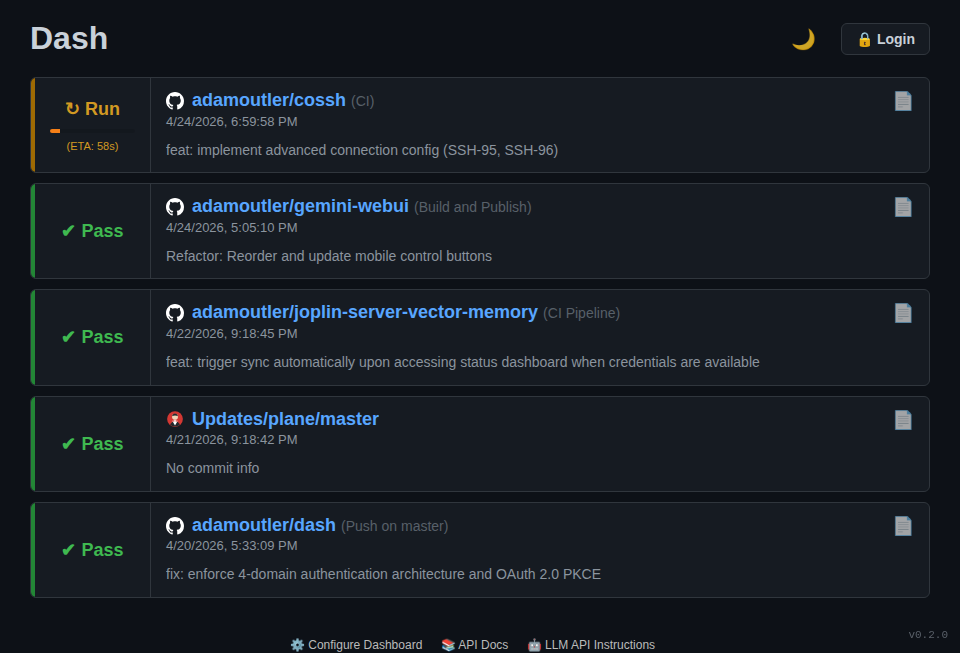
1. Public Read-Only Dashboard (dash-public.png)
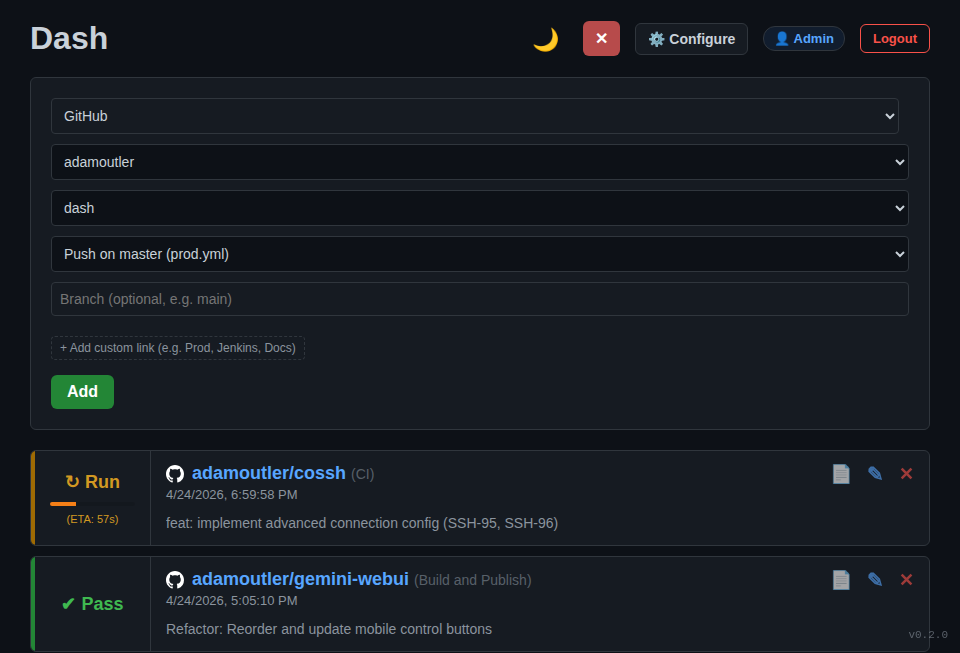
Unauthenticated visitors get an immediate, zero-popup read-only view of all tracked repositories across GitHub, Gitea/Forgejo, and Jenkins. Team members can inspect Pass, Fail, and Run cards (complete with live ETA progress bars), follow custom quick-action links, and open build logs (📄) while all administrative write controls (✎ Edit, ✕ Remove, + Add Repository, and ⚙️ Configure) remain strictly hidden until sign-in.
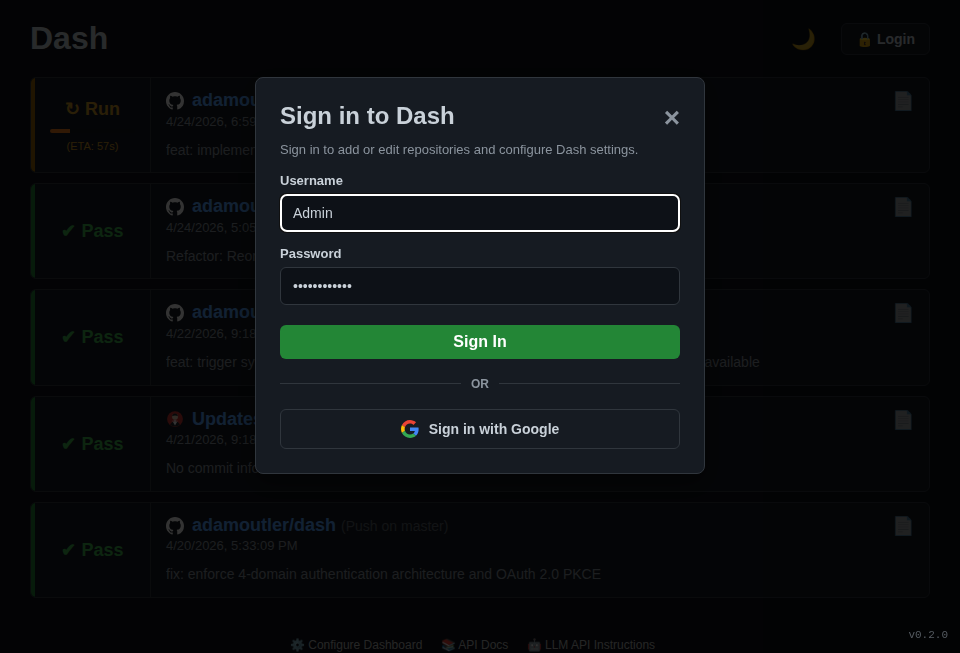
2. Website Login & Google OAuth (dash-login.png)
Clicking 🔒 Login opens the authentication modal supporting two independent human authentication domains: Domain 3 (Website Login) via local administrator username/password (POST /api/auth/login with HttpOnly signed session cookies and CSRF protection) and Domain 4 (Website OAuth) via Sign in with Google (OpenID Connect Relying Party restricted to an explicit allowlist of verified email addresses).
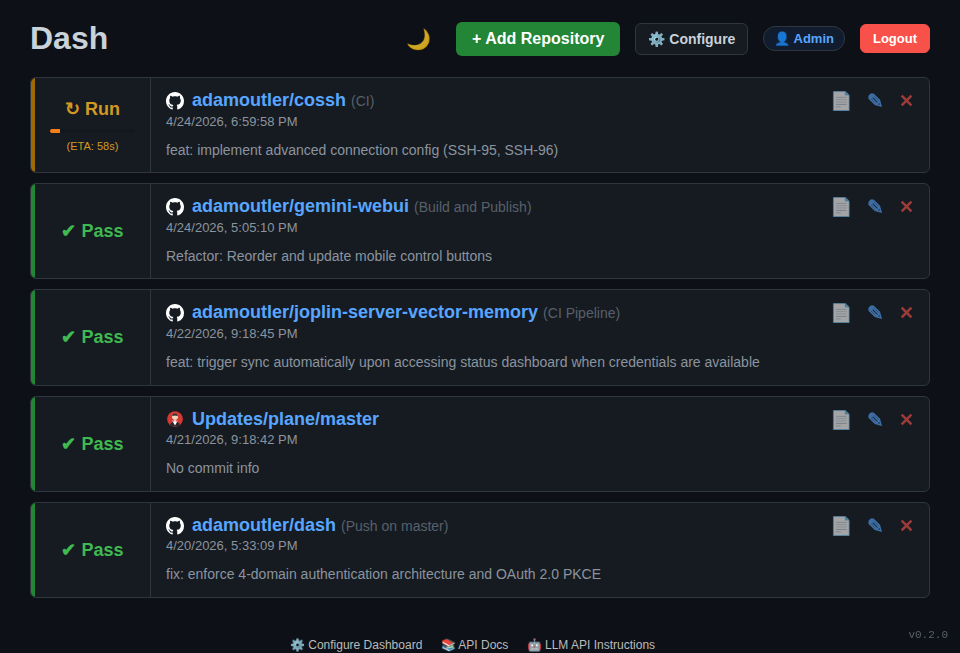
3. Authenticated Admin Dashboard (dash-home.png)
Once signed in, the dashboard unlocks full administrative controls in-place: the header displays the active administrator badge (👤 admin), + Add Repository, ⚙️ Configure, and Logout, while each repository card reveals ✎ Edit and ✕ Remove actions.
4. Adding & Editing Repositories (dash-add-repo.png)
Clicking + Add Repository opens the interactive cascading path browser. Administrators can select GitHub, Gitea/Forgejo, or Jenkins, drill down through organizations, repositories, folders, and workflows, filter by branch, and attach custom quick-action links (such as production deployments, issue trackers, or coverage reports).
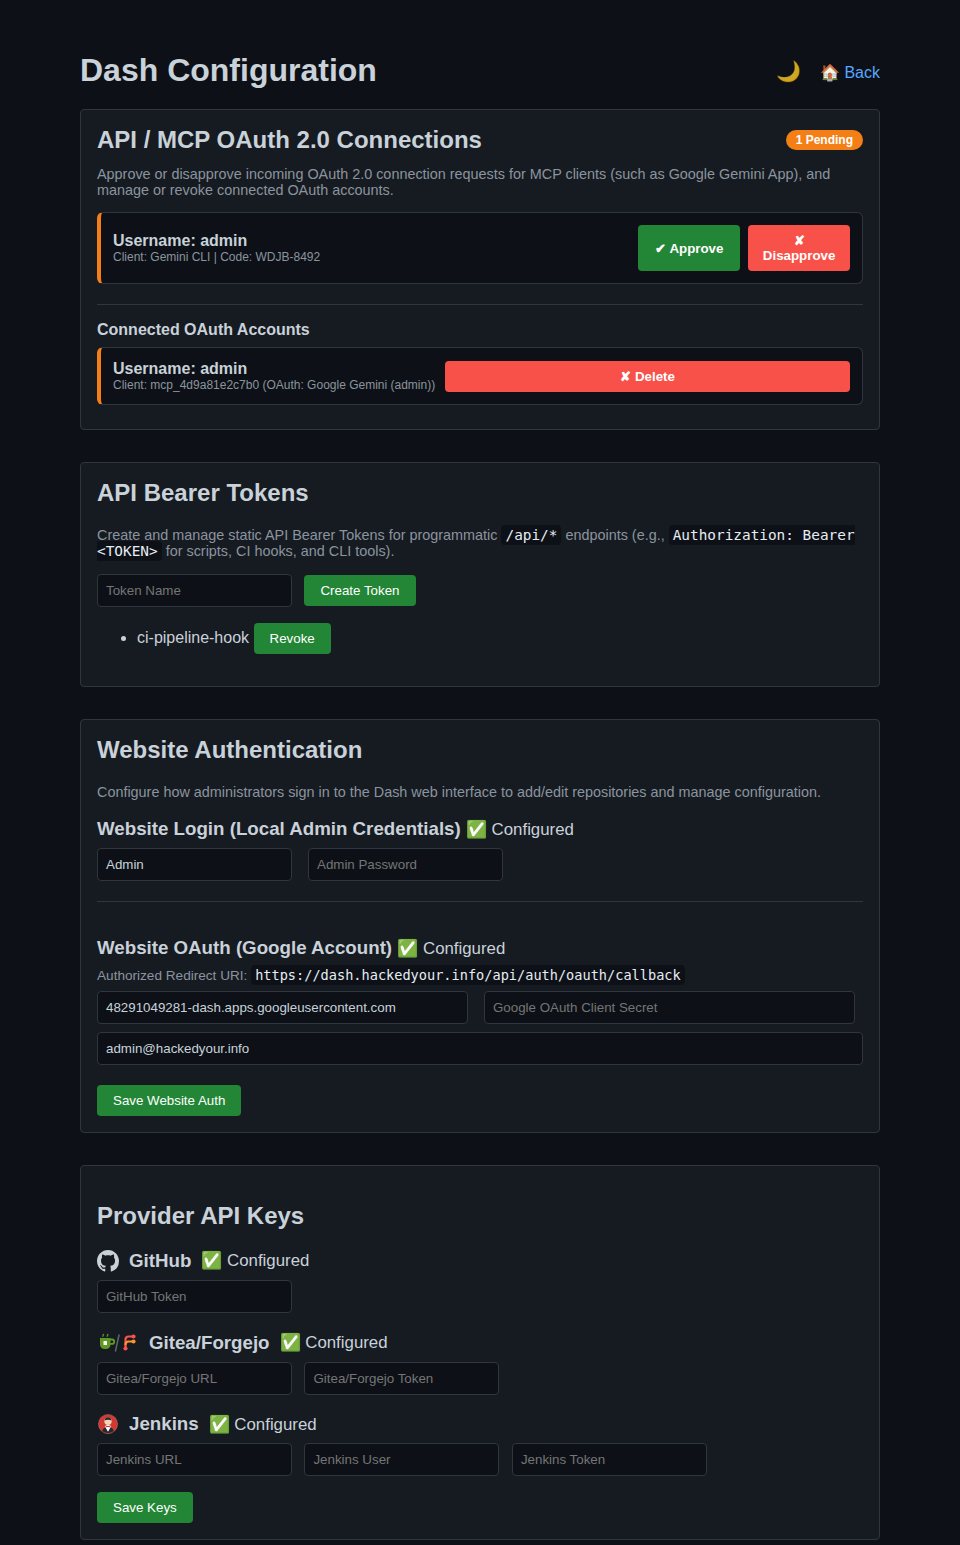
5. 4-Domain Security & Configuration Console (dash-configure.png)
The ⚙️ Configure console (/configure) provides centralized management across all four security domains and CI providers:
- Domain 2 — API / MCP OAuth 2.0 Connections: Real-time approval queue (
✔ Approve/✘ Disapprove) with verification codes (DASH-XXXX-XXXX) for incoming AI agent connections (such as Google Gemini App, Gemini CLI, and Claude via RFC 9728 / RFC 8414 / RFC 7591 + PKCES256) and active session revocation. - Domain 1 — API Bearer Tokens: Generation and revocation of SHA-256 hashed Bearer tokens (
tok_...) scoped exclusively to programmatic REST/api/*endpoints and CI hooks. - Domains 3 & 4 — Website Authentication: Configuration for Local Admin credentials and Website OAuth (Google Client ID, Client Secret, and comma-separated Allowed Emails).
- Provider API Keys: Credential management for GitHub, Gitea/Forgejo, and Jenkins.
💡 Loving the seamless workflow? Drop a ⭐ on the repo and share your favorite AI automated workflows in the issues!
Dash MCP questions
What specific tools are available for agents via MCP?
Agents can use get_status to get markdown reports, get_logs to retrieve failing build logs, and wait to pause until a CI pipeline completes.
Which CI/CD providers does Dash support?
Dash integrates with GitHub, Forgejo (and Gitea), and Jenkins.
How do I deploy Dash?
You can deploy it easily using Docker Compose with a single command.