
cpcxray MCP server
Commit Oct 25, 2026An Amstrad CPC emulator designed for reverse engineering that allows AI clients to trace code, inspect memory, and generate reassemblable source code.
Also known as SerErris/cpcxray
- Stars
- 5
- Tools
- —
- Downloads, 30 days
- —
- Latest version
- —
- Last commit
- Oct 25, 2026
- License
- GPL-3.0
What is cpcxray MCP?
cpcxray is an Amstrad CPC emulator designed for reverse engineering that allows AI clients to trace code, inspect memory, and generate reassemblable source code.
Summary generated from the project's README
About cpcxray MCP server
Reverse engineering Amstrad CPC software becomes a collaborative process when using this emulator with an AI client. Developers can use Claude Code to drive the entire machine, allowing the AI to boot the system, type commands, set breakpoints, and inspect memory or registers. Unlike general-purpose emulators meant for gaming, this tool focuses on deep code analysis and insight by providing a Z80 core that tracks every bus access and instruction execution.
The server provides 99 individual MCP tools that enable an AI to perform complex debugging tasks, such as stepping through code, reading traces, and running analysis on ROM or RAM ranges. It is specifically designed to handle scrambled ROMs, such as those using the Vortex X-module scheme, by decoding bytes based on whether they are fetched as opcodes or data. This allows the system to transform raw bytes into documented, reassemblable sjasmplus source code through a structured five-phase project workflow.
What you can do with it
- 1Generate documented source codeAn AI client can transform a ROM or RAM segment into a readable sjasmplus source file with comments and labels.
- 2Trace execution historyDevelopers can use the AI to record and review every instruction executed or every bus access made by the CPU.
- 3Automated debugging with breakpointsAn AI can control the machine by setting various types of breakpoints to stop execution at specific memory or I/O events.
Written from the project's README. Every use case is checked against a quote from it.
Automated checks
Ran Nov 15, 2026Full report →Not verified yet. A server needs a score of 80, no serious finding, and enough data for us to check. How checks work · What to fix for more points

- Source repository linked and reachablesererris/cpcxray is public and reachablegithub.com/sererris/cpcxray ↗Pass
- Package names this repository as its sourceNot checked
- Build provenance (Sigstore attestation)Not checked
- Open source license (OSI)GPL-3.0spdx.org/licenses/GPL-3.0.html ↗Pass
- Commit or release in the last yearLast commit or release 2026-10-25github.com/sererris/cpcxray ↗Pass
- OpenSSF ScorecardNot checked
- Package name not close to a popular packageNot checked
- No critical advisory in the package or its dependenciesNot checked
- No hidden instructions to the model0 tool descriptions and the README read; no override phrases, credential paths or hidden charactersPass
- Destructive tools are labelledNot checked
- Remote endpoint answers the MCP handshakeNot checked
README
View on GitHubCPC X-Ray
An Amstrad CPC 464 / 664 / 6128 emulator built for reverse engineering. It runs the real firmware, BASIC, AMSDOS and any expansion ROM, lets you stop, step and inspect everything the machine does, and turns the code you select - a ROM or a piece of RAM - into a documented, reassemblable source. Claude Code can drive all of it through an MCP server.
Not a general-purpose emulator. CPC X-Ray is not meant for playing games or running everyday CPC software - mature emulators exist for that. It is not built for speed (it runs at about real time, slower with the analysis and traces on) or for cycle-exact video tricks. It is built for insight: watching and analysing code at a depth that a CPC emulator has not offered before.
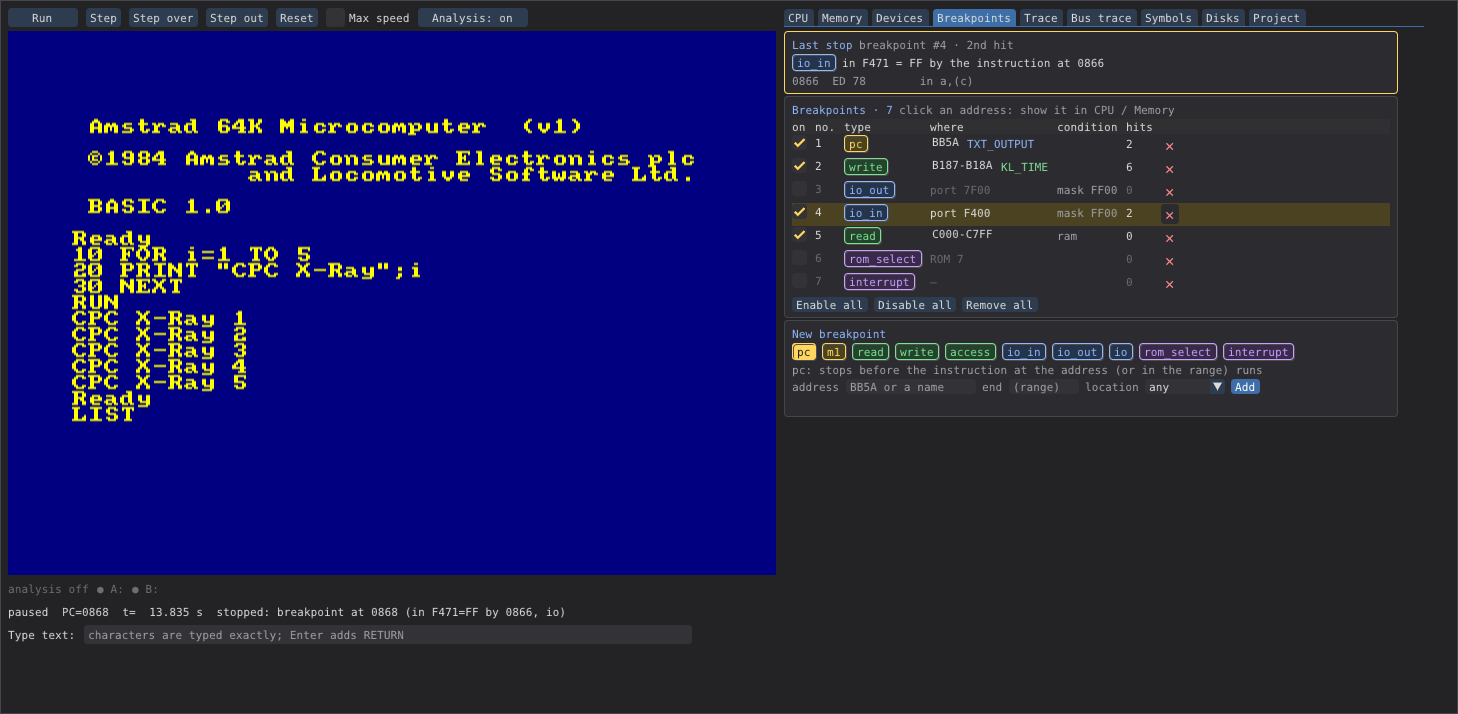
The window: the running CPC on the left, the debugger on the right - here the Breakpoints tab
with breakpoints of several types (PC on the firmware's TXT_OUTPUT, a write to the variable
KL_TIME, I/O to the Gate Array and the keyboard port, a read of screen RAM, ROM select,
interrupt), their hit counts and the last stop.
What it is
The main use case: disassembling and commenting existing CPC code - a ROM, a game, a utility - until you have a readable, documented source that assembles back to the original bytes. And doing that together with Claude Code: through the MCP server Claude Code steers and controls the whole machine - it boots it, types on it, inserts disks, sets breakpoints, steps through the code, reads registers, memory and both traces, and runs the analysis. It sees everything the machine does, so it can follow what the code really does at run time and help you name routines and variables, write the comments and check the result.
CPC X-Ray is a CPC with the lid off. The machine is software compatible - the real ROMs boot to BASIC, AMSDOS reads and writes disks, programs run as on the hardware - and every part of it can be watched: each instruction, each memory and I/O access, each ROM switch. On top of that it collects what it sees into an analysis of the code you are interested in - which bytes are code, which are data, where code was copied and run - and that analysis becomes the source.
It was built to take apart ROMs whose code is scrambled: the Vortex X-module scheme encodes opcode bytes and data bytes differently, so a ROM dump alone cannot be disassembled. CPC X-Ray decodes such a ROM on every access, depending on whether the CPU fetches an opcode (M1) or reads data, and records which byte was read how. The same tools work for any ordinary ROM or RAM program.
What it can do
The machine
- CPC 464, 664 and 6128 (with 128 KB RAM banking), configured in a
machine.toml; the standard Amstrad ROMs come with it, your own ROMs go intoroms/. - A Z80 core written from scratch that behaves exactly like the real CPU towards software - documented and undocumented behaviour, every bus access in the real order - verified with 1.6 million single-instruction tests, ZEXALL and z80test.
- Gate Array, CRTC, ROM select, keyboard and the µPD765 floppy controller with two drives: 3" disks (DSK, EDSK) in A:, 80-track disks in B:. Real disk images are inserted read-only.
- Real-time display, and your PC keyboard types on the CPC by character, whatever your layout.
The debugger
- Run, step, step over, step out, run to an address; every run is bounded and reports why it stopped.
- Breakpoints of ten types - PC, M1, memory read / write / access, I/O in / out, ROM select, interrupt - with ranges, port masks and conditions on what is paged in (a ROM, a RAM block).
- Memory views of the CPU, RAM blocks, ROM images and decoded ROMs, coloured by the known
firmware and AMSDOS variables; the paging of each 16 KB quarter; the stack; the devices'
state;
.snasnapshots. - Firmware names for all three machines, your own labels, comments, comment blocks above and below a line, and variables; groups for programs that use the same RAM differently (code contexts decide which name an address gets); you decide whether an operand is a number or an address.
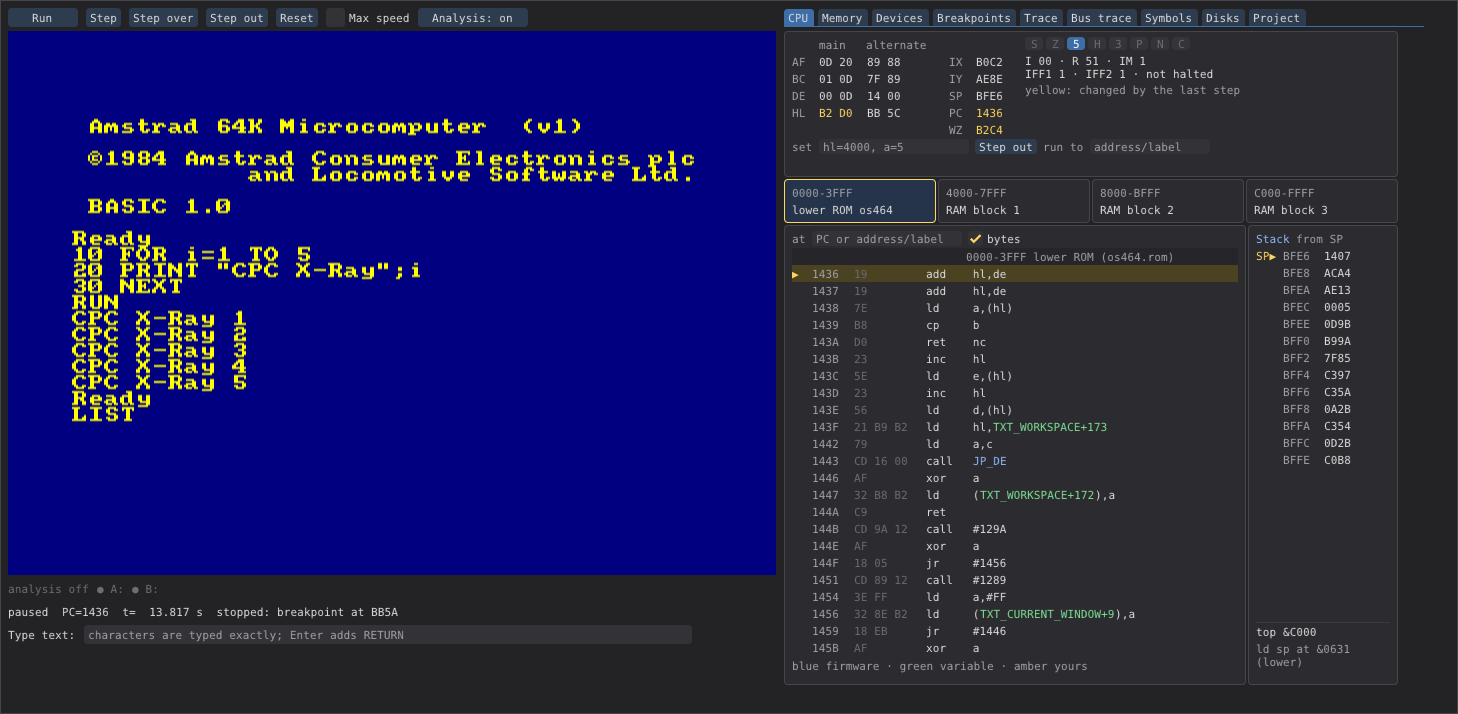
The CPU tab, stopped inside the firmware's text output: registers (main and alternate, changed
ones in yellow) and flags, what is paged into each 16 KB quarter, the disassembly with firmware
names (blue) and variables (green), and the stack from SP up to its top - the return address
&1407 of call TXT_OUT_ACTION above the four pushed registers, and the ld sp that set the
top.
Tracing: what ran, and what happened on the bus
- The instruction trace records every executed instruction with its bytes, the registers before it, where it ran (lower ROM, ROM n or RAM - and for code copied to RAM, the ROM it came from) and calls and returns. After a stop you can go back through the history and see how the program got there; steps are always recorded. Limit it to an address range or to the code under analysis, and write it to a file as text, CSV or JSON Lines.
- The bus trace records every bus access - opcode fetches (M1), memory reads and writes, I/O in and out, interrupt acknowledges - with the instruction that made it, in a ring buffer of up to a million accesses. Browse anywhere in its history, grouped per instruction and explained: the variable a read or write touched, a return address pushed or popped, the device a port belongs to and what the value does there.
- For a stepped instruction you see exactly what it read and wrote; "Follow CPU" shows what was written to memory since the last stop.
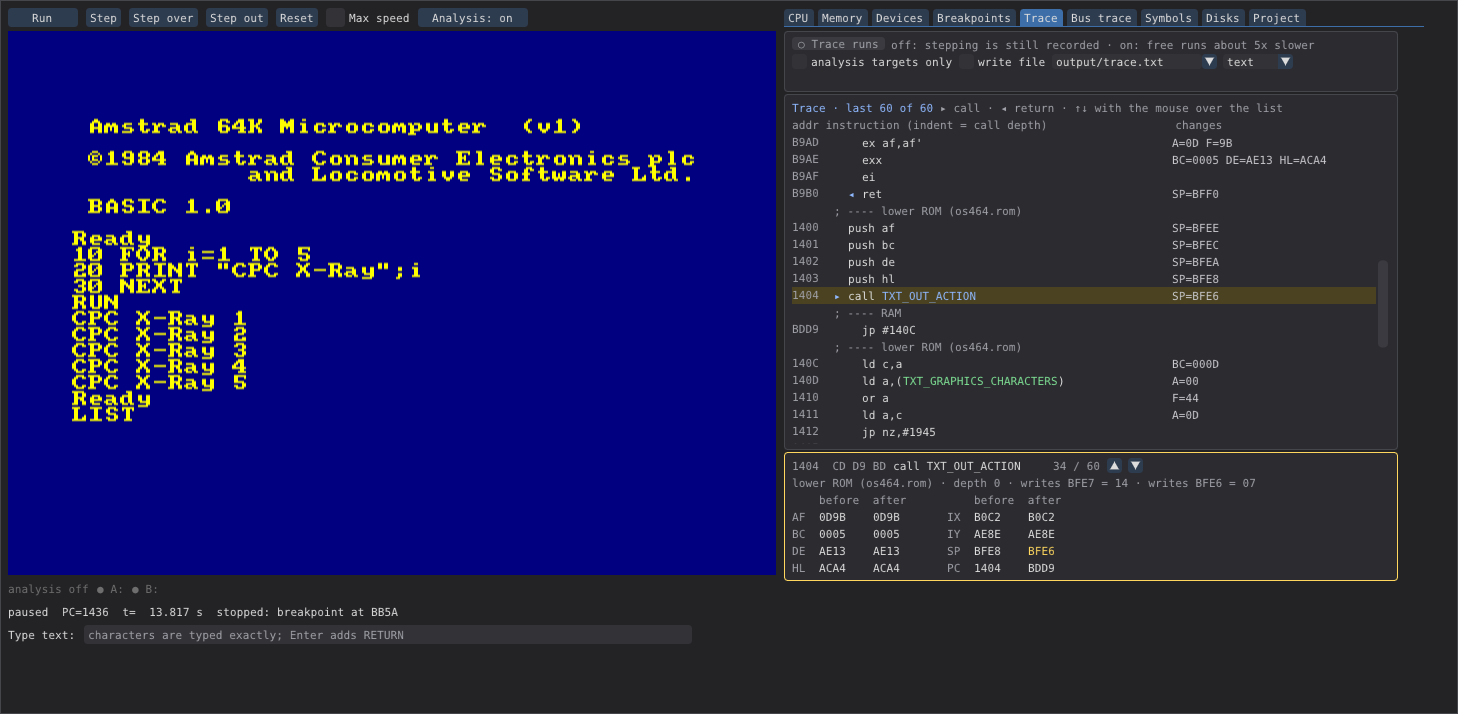
Back in time: the Trace tab after stepping into the firmware's TXT_OUTPUT. The instructions
are indented by call depth (▸ call, ◂ return), a separator marks each move between the lower
ROM and RAM, firmware names and variables are coloured, and each line shows the registers it
changed. The selected call TXT_OUT_ACTION, 26 instructions back, shows its two stack writes
and the registers before and after.
The analysis
- Analysis targets: any ROM or RAM range. The run collects instruction starts, code copied to RAM and run there, relocated blocks, RST calls with inline data and far addresses.
- Scrambled ROMs: the decoded image, the access map (which byte was read as opcode, as data, both or never), conflicts, a ROM map (HTML / text) and coverage figures.
- A classifier that turns these facts into code and data, and a source generator that writes an sjasmplus source, with firmware names, variables and your labels. A round-trip check assembles it and compares it with the original byte for byte.
- The Project tab leads through the five phases: collect, decode, save, generate, verify.
Claude Code and automation
- Every function is one MCP tool (99 of them): Claude Code can boot the machine, type, set breakpoints, read memory and traces, and run the analysis - headless or attached to the open window.
- A command line for the window, the MCP server, checking a configuration and the round trip.
Documentation
- Install guide - downloading a release, the project folder, first start
- User guide - the window and its tabs, a typical analysis session from collecting to the verified source, file formats, troubleshooting
- Command line - every command and option, its output and exit codes
- MCP reference - the MCP server and all its tools, grouped by task
- Claude Code with cpcxray - connecting Claude Code (headless or to the window) and working with it
- Developer guide - how cpcxray is built, the path of one instruction through the code, where each part lives, tests and conventions
- Architecture - the session layer, the machine and the Z80 core as block diagrams, with what each layer does and how the CPU model relates to the real chip
Install
Each release on the releases page offers:
-
The Python package (
cpcxray-<version>-py3-none-any.whl), for any system with Python 3.12 or newer. With pipx:pipx install "cpcxray[gui,mcp] @ https://github.com/SerErris/cpcxray/releases/download/v0.9.4/cpcxray-0.9.4-py3-none-any.whl" -
A ready-made program for Linux (
…-linux-x86_64.tar.gz) or Windows (…-windows-x86_64.zip), no Python needed: unpack it and runcpcxray(cpcxray.exe) in the unpacked folder - it is a project folder already.
Start
cpcxray init my_cpc        # a project folder: configs, the standard ROMs, disk/, project/, output/
cd my_cpc
cpcxray gui                # the CPC 464 boots to BASIC
cpcxray gui --config config/cpc6128.toml   # or the 664 / 6128
The standard Amstrad ROMs (OS, BASIC, AMSDOS of the 464, 664 and 6128) come with cpcxray. Put
other ROMs into roms/ and disk images into disk/; the Project tab's machine editor adds
them to the configuration. cpcxray config checks a configuration.
Type on your own keyboard layout: the character you type is typed on the CPC.
Claude Code (MCP)
- Headless: add to the project's
.mcp.json:{"mcpServers": {"cpcxray": {"command": "cpcxray", "args": ["mcp"]}}}. - Attach to the running window:
claude mcp add --transport http cpcxray-gui http://127.0.0.1:8765/mcp.
Requirements
- sjasmplus on the PATH, only for the round-trip check
of generated sources (
cpcxray source-verify, the Verify phase). - The window uses OpenGL (Dear PyGui); under WSL it runs with WSLg.
Licence
GPL-3.0-or-later (see LICENSE). Third-party parts (the Amstrad ROMs, the DejaVu font):
see THIRD_PARTY.md.
cpcxray MCP questions
Is this a general-purpose emulator for playing games?
No, it is specifically built for reverse engineering and code analysis rather than speed or cycle-exact video tricks.
What kind of breakpoints are available?
The debugger supports ten types of breakpoints, including PC, M1, memory read/write, I/O, ROM select, and interrupts.