
FaultDebug MCP server
Commit Oct 17, 2026Enables AI clients to inspect C/C++ crash artifacts and source-verified execution-flow reports through a read-only MCP server.
Also known as lsh235/FaultDebugMCP
- Stars
- 1
- Tools
- —
- Downloads, 30 days
- —
- Latest version
- —
- Last commit
- Oct 17, 2026
- License
- Apache-2.0
What is FaultDebug MCP?
FaultDebug enables AI clients to inspect C/C++ crash artifacts and source-verified execution-flow reports through a read-only MCP server.
Summary generated from the project's README
About FaultDebug MCP server
Analyzing C/C++ crashes through source-verified execution-flow reports is what FaultDebugMCP enables for developers using AI clients. This read-only MCP server allows an AI model to inspect captured fault artifacts and evidence stores to explain why a program failed. It works by connecting a local stdio MCP server to an AI client like Claude Code or Codex CLI, providing the model with tools to query process groupings, session data, and RPC/IPC relationships.
Users must first run their target programs with FaultDebug instrumentation to generate .fault artifacts on disk. The server does not perform the tracing itself but acts as a bridge for the AI to examine existing data. It focuses on providing structured evidence, such as per-thread event rings and signal metadata, while explicitly marking missing events or incomplete snapshots. This ensures the AI understands the limits of the captured data rather than guessing causality.
What you can do with it
- 1Investigate native C crashesAsk the AI to examine a SIGSEGV artifact to find the fault location and execution flow.
- 2Trace cross-service failuresHave the AI follow recorded calls across multiple services to identify where a timeout or crash occurred.
- 3Verify source code alignmentUse the AI to confirm that the captured execution matches the specific build and source version.
- 4Identify missing execution evidenceRequest the AI to check for dropped events or incomplete snapshots in a crash report.
Written from the project's README. Every use case is checked against a quote from it.
Configuration
FD_LAUNCHER
| Name | Description | |
|---|---|---|
| FD_LAUNCHER | — |
Automated checks
Ran Nov 15, 2026Full report →Not verified yet. A server needs a score of 80, no serious finding, and enough data for us to check. How checks work · What to fix for more points

- Source repository linked and reachablelsh235/faultdebugmcp is public and reachablegithub.com/lsh235/faultdebugmcp ↗Pass
- Package names this repository as its sourceNot checked
- Build provenance (Sigstore attestation)Not checked
- Open source license (OSI)Apache-2.0spdx.org/licenses/Apache-2.0.html ↗Pass
- Commit or release in the last yearLast commit or release 2026-10-17github.com/lsh235/faultdebugmcp ↗Pass
- OpenSSF ScorecardNot checked
- Package name not close to a popular packageNot checked
- No critical advisory in the package or its dependenciesNot checked
- No hidden instructions to the model0 tool descriptions and the README read; no override phrases, credential paths or hidden charactersPass
- Destructive tools are labelledNot checked
- Remote endpoint answers the MCP handshakeNot checked
README
View on GitHubFaultDebug
Turn C/C++ crashes into source-verified execution-flow reports. Follow recorded calls across services, inspect the fault location, and see which evidence is missing.





Guides: English · 한국어 · 简体中文 · 日本語
Try the interactive demos · Watch the 42-second walkthrough · Run the fixture locally · Share feedback
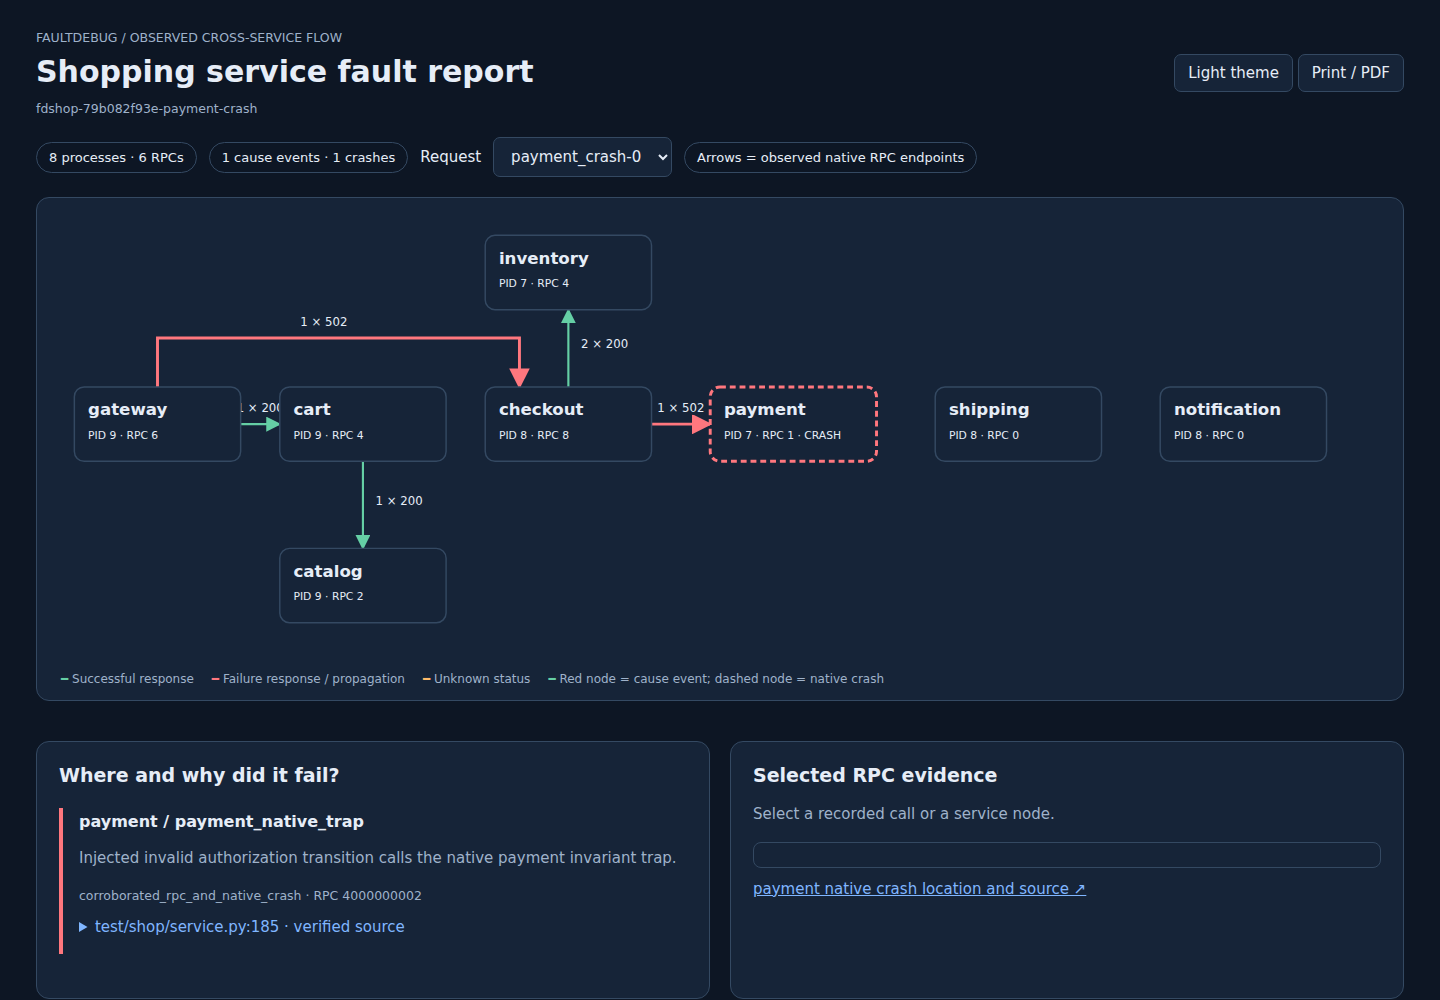
Explore a successful checkout, payment SIGILL, inventory timeout, or native C SIGSEGV. The online examples are recorded synthetic executions; the local fixture reproduces real Docker service interactions and native captures.
Try the prebuilt demo
Requires Linux x86_64, a local Docker Engine and Docker Compose. After cloning, one script downloads the checksummed development demo image, runs eight services through three outcomes and serves the reports. No host Python, Clang or CMake installation is needed.
git clone https://github.com/lsh235/FaultDebugMCP.git
cd FaultDebugMCP
./scripts/try-demo.sh
Open http://127.0.0.1:18870/index.html when the script prints the report URL. Ctrl+C stops the report server. The analyzer uses the local Docker socket to manage its own fixture containers. See requirements and overrides. The shopping app is Python with an instrumented C++ boundary; these are native boundary events, not Python stacks. Incomplete captures remain marked incomplete.
Native tracing and inspection
FaultDebug combines a small C11 runtime, C/C++ build integration, and a Python
CLI/MCP inspector. The runtime records bounded function-entry and function-exit
events while an instrumented program runs. After the target exits, the local
launcher collects and validates the shared-memory trace and may write a
.fault artifact for a supported fatal signal or partial termination.
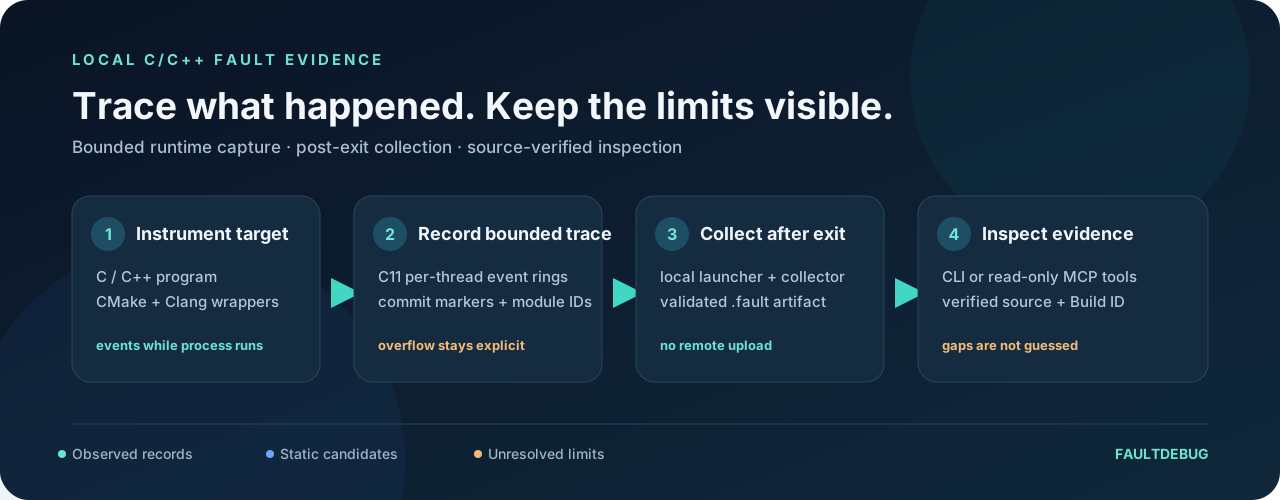
FaultDebug is designed to preserve evidence and its limits. It does not guess missing events, infer causality from process names or shared IDs, or present static call-graph candidates as observed execution.
Project status
The native package is 1.2.0rc1; v1.2.0-rc.1 is a pre-release candidate.
Main also includes offline service reports and generation-counter fixes.
Current-source core/gRPC and Docker N=8/16 gates pass locally and on GitHub;
see the current-source validation.
The prebuilt demo is a separate development snapshot, not a stable release.
Final independent acceptance and a fresh 30-minute soak after the generation fix remain pending. The earlier RC soak was incomplete; its counts and source scope are in the historical validation. See the v1.3 plan for remaining work.
What it provides
- Bounded runtime tracing: per-thread event rings, committed-record checks, module identity, signal metadata, and explicit overflow/partial status.
- Post-exit collection: the launcher owns the shared-memory descriptor and readiness handshake; collection happens after the target exits.
- Verified source lookup: immutable source snapshots, compile databases, Build IDs, and hashes are checked before source-backed inspection.
- Local evidence workflows: CLI and read-only MCP tools for artifact inspection, process/session grouping, evidence-store queries, and explicitly supported RPC/IPC relationships.
- Build integration: CMake helpers and compiler wrappers for C/C++ builds, including opt-in source-selection profiles.
Normal successful runs do not write a fault artifact unless
--collect-success is requested. A crash artifact may still be incomplete;
check its trace, dropped-event, snapshot, and collector status before relying on
it.
Why FaultDebug
- Record function-level runtime events in a bounded C11 recorder without requiring a tracing daemon or remote service.
- Tie source lookup to captured build inputs, hashes, and module Build IDs so a changed checkout is not mistaken for the source that produced an artifact.
- Use a local CLI or read-only MCP server to inspect artifacts and explicitly separate observed events, static candidates, and unresolved evidence.
- Keep overflow, incomplete snapshots, and missing optional evidence visible.
Practical examples: payment process crash, inventory timeout, and native C SIGSEGV.
The runtime currently targets Linux on Ubuntu 24.04 x86_64. It is a diagnostic and forensic aid, not a lossless recorder: inspect artifact completeness and drop counts before drawing conclusions.
Supported environment
The documented support target is Ubuntu 24.04 x86_64 with Python 3.12, Clang 18, CMake 3.20 or newer, and Ninja. The recorder is C11; the native fixtures also exercise C++17. Other platforms and compiler versions are outside the current support commitment.
Python dependencies are pinned in pyproject.toml:
libclang, pyelftools, and the MCP SDK. Fault artifacts, source bundles, and
the MCP interface are local-only. Remote transport and encryption are not
provided.
Quick start
Clone the repository:
git clone https://github.com/lsh235/FaultDebugMCP.git
cd FaultDebugMCP
Install the native toolchain and Python environment:
sudo apt-get update
sudo apt-get install clang-18 llvm-18-tools cmake ninja-build python3.12 python3.12-venv

python3.12 -m venv .venv
.venv/bin/python -m pip install --upgrade pip
.venv/bin/python -m pip install -e .
If you prefer uv, replace the three Python
environment/install commands above with the following. The apt-installed
native toolchain is still required for tracing builds:
uv venv --python 3.12 .venv
uv pip install --python .venv/bin/python -e .
Configure and build the runtime plus the native fixtures:
cmake -S . -B build -G Ninja \
  -DCMAKE_C_COMPILER=clang-18 \
  -DCMAKE_CXX_COMPILER=clang++-18 \
  -DFAULTDEBUG_PYTHON_EXECUTABLE="$PWD/.venv/bin/python" \
  -DFAULTDEBUG_BUILD_TESTS=ON
cmake --build build --parallel 2
Check the local environment and run a fixture:
.venv/bin/fault-debug doctor
.venv/bin/fault-debug capabilities
.venv/bin/fault-debug run --artifact-dir artifacts -- build/test/fd_c_chain 16
The normal fixture exits successfully and does not create a .fault file.
To exercise a SIGSEGV capture, run:
.venv/bin/fault-debug run --artifact-dir artifacts -- build/test/fd_signals 11
The target's SIGSEGV produces the usual signal-based shell status (139) and a
fault-<pid>.fault artifact under artifacts/. The artifact is evidence of
the recorded run, not a guarantee that every event was retained.
For builds without system packages, see the repository's
Clang 18 setup. For the complete validation matrix, see
test/README.md.
Inspecting and sharing evidence
Inspect an artifact locally:
.venv/bin/fault-debug inspect artifacts/fault-<pid>.fault
Source and call-relation lookup requires a verified bundle. Create an index from the CMake compilation database and bundle the captured source and target binary:
.venv/bin/fault-debug index build/compile_commands.json -o build/index.json
.venv/bin/fault-debug bundle \
  --source-root build/faultdebug-source-snapshot/files \
  --index build/index.json \
  --binary build/test/fd_c_chain \
  --output build/bundle
.venv/bin/fault-debug inspect artifacts/fault-<pid>.fault --bundle build/bundle
Bundles bind source and index data to the binary Build ID and hashes. Missing or mismatched inputs fail explicitly; the current worktree is not substituted for missing captured source.
Create a shareable fault document and interactive execution-flow view:
.venv/bin/fault-debug fault-report artifacts/fault-<pid>.fault \
  --bundle build/bundle --output reports/incident-001
# Open reports/incident-001/report.html; document: report.md; evidence: report.json
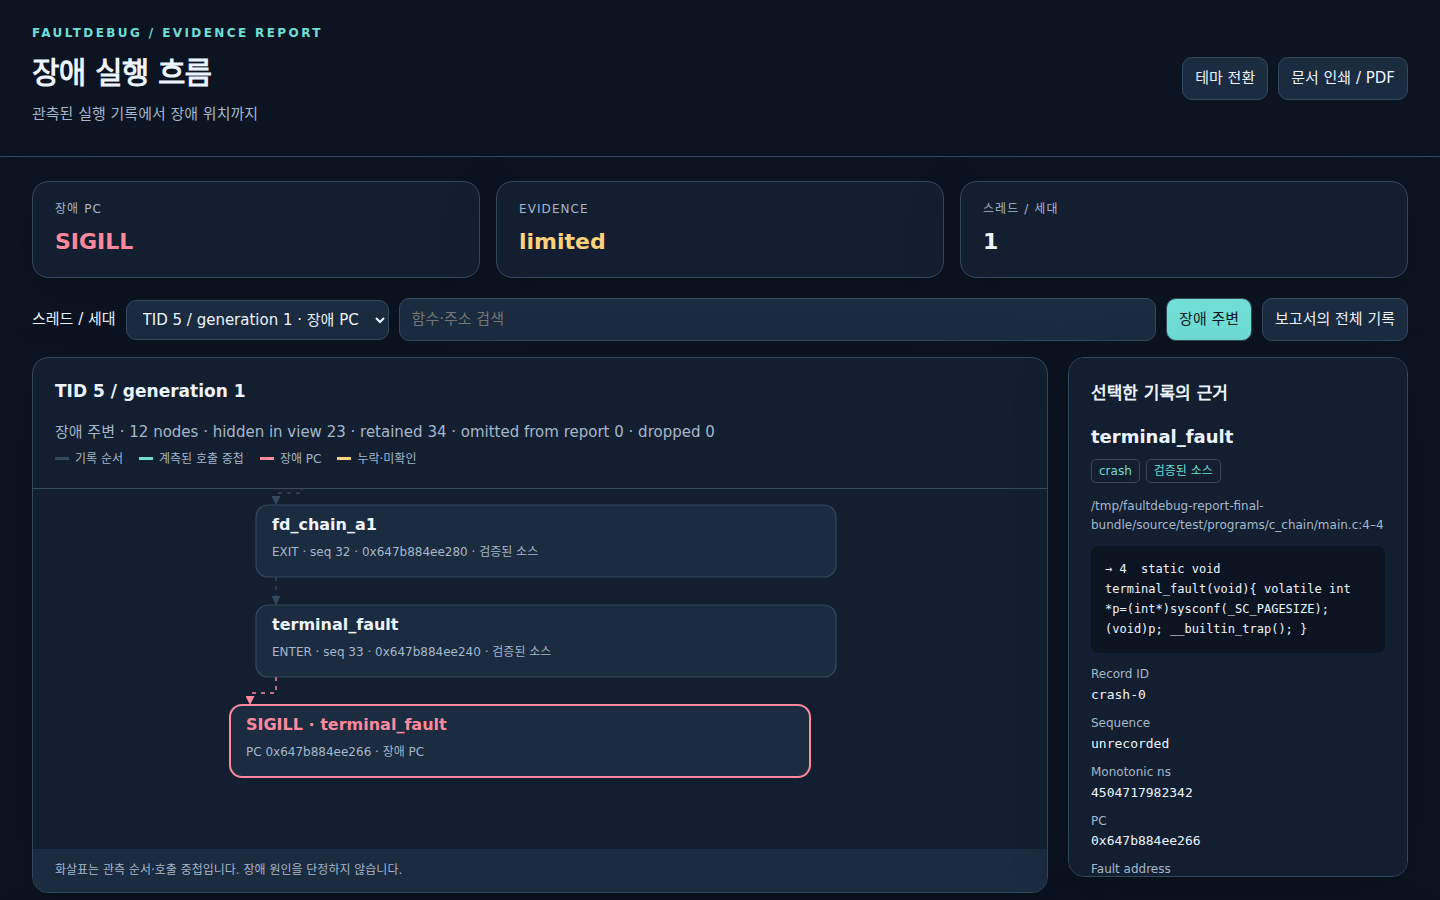
The standalone HTML highlights the captured fault PC and retained function
events, supports thread selection, search, dark/light themes, and document
printing to PDF. Gaps, unresolved addresses, and static call candidates remain
explicit. Use --language ko for Korean and --max-events 200 for a larger
window. See the fault-flow report guide.
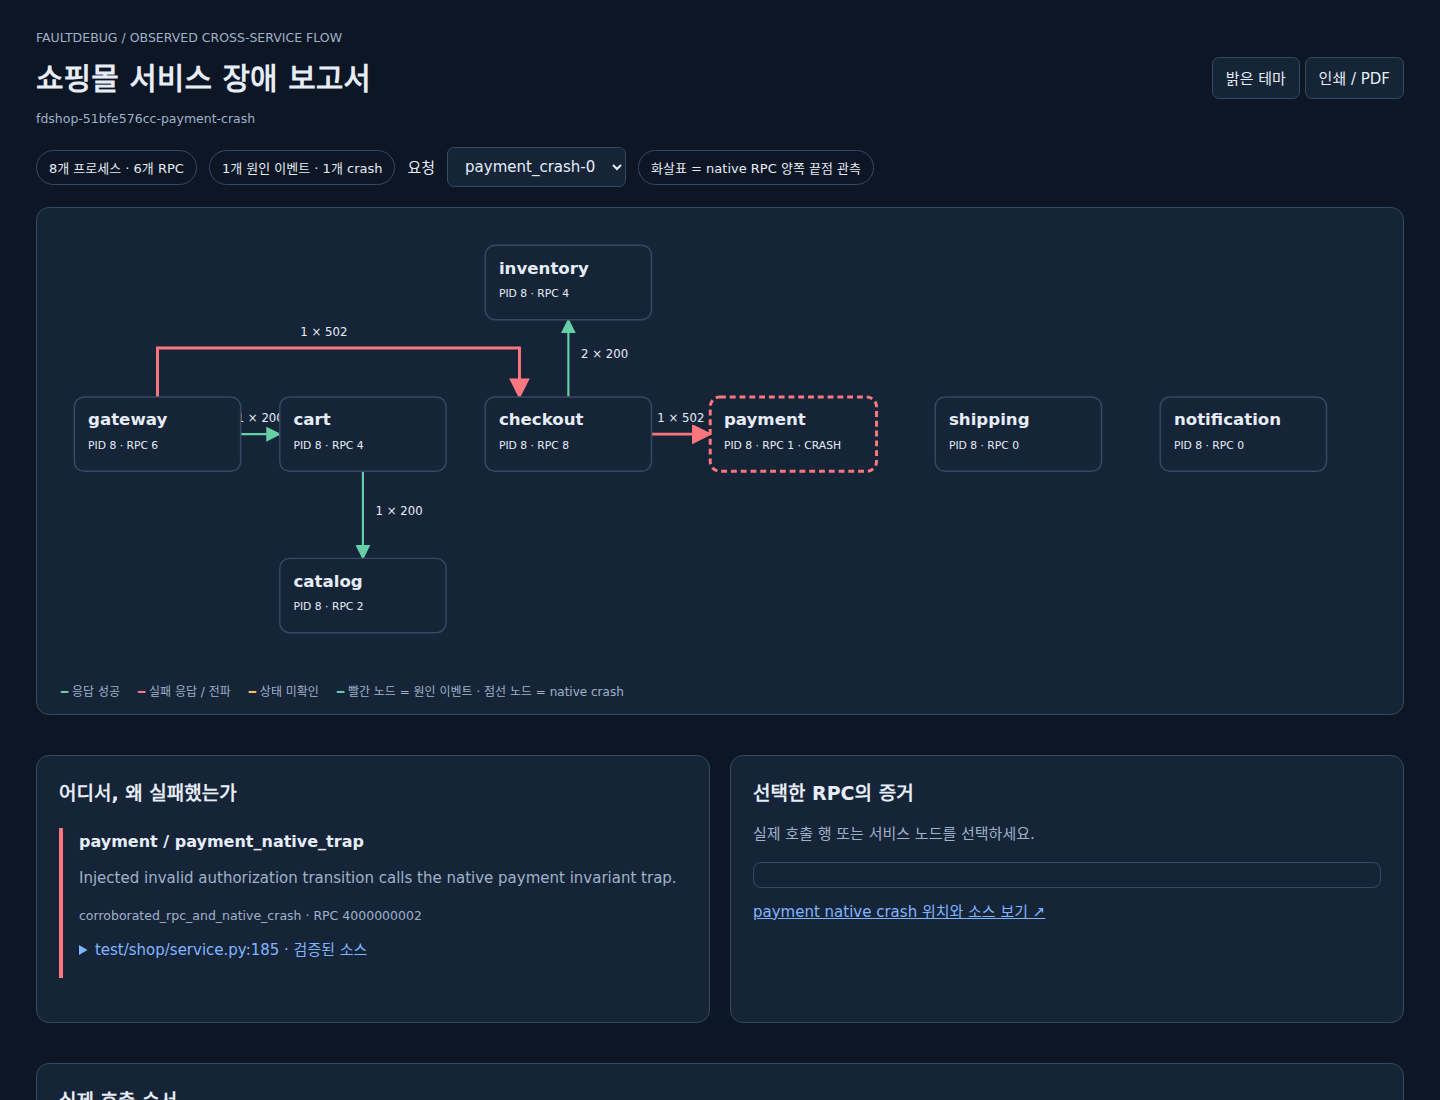
Try a larger, real cross-process workload with the N-process shopping fault lab: eight core Docker services plus optional risk workers, concurrent orders, controlled failures, and a report of observed service-to-service RPC flow and failure evidence.
docker build -f test/shop/Dockerfile -t faultdebug-shop:dev .
.venv/bin/python test/shop/run.py --processes 16 --requests 24 --concurrency 4 \
  --scenarios success payment_decline --output build/shop-scale
Use FaultDebug from an AI session
FaultDebug does not run an AI model or send data to an AI provider. Codex CLI, Claude Code, or another MCP client runs the model conversation. When you ask it to investigate a captured failure, the client can start this local stdio MCP server, expose its read-only tools to the model, and pass tool results back into the same conversation. The model decides which available tools to call and explains the returned evidence.
The AI client can send these tool results to its configured model provider; local MCP transport does not imply local AI inference.
The target program must already have been run with FaultDebug instrumentation,
and its .fault captures or evidence store must be available on disk. Connecting
an AI session does not start tracing or create those runtime captures. “AI
session” means the Codex/Claude conversation; a FaultDebug runtime session is a
separate group of captured process evidence.
flowchart LR
    A[Run instrumented program] --> B[.fault captures / evidence store]
    C[Codex CLI or Claude Code session] --> D[Model selects a FaultDebug tool]
    D --> E[Local stdio MCP server]
    E --> F[Read-only artifact inspection]
    F --> G[Structured evidence and limits]
    G --> C
    C --> H[AI explanation in the conversation]
    B --> E
    B --> I[Optional fault-debug CLI report]
Codex CLI
After installing the project with pip install -e ., register the server with
absolute paths to the installed CLI and the directory containing the captures:
codex mcp add faultdebug -- \
  /absolute/path/to/FaultDebugMCP/.venv/bin/python \
  -m faultdebug.cli mcp --root /absolute/path/to/artifacts
codex mcp list
Restart or open a Codex session in a trusted project, then use /mcp in the
Codex TUI to inspect connected servers. Codex CLI and its supported desktop/IDE
surfaces share MCP configuration. Alternatively, add the server to
~/.codex/config.toml:
[mcp_servers.faultdebug]
command = "/absolute/path/to/FaultDebugMCP/.venv/bin/python"
args = ["-m", "faultdebug.cli", "mcp", "--root", "/absolute/path/to/artifacts"]
Claude Code
Claude Code can register the same local stdio command. Project scope stores the entry in the project configuration; Claude Code may ask you to approve it when you open the project.
claude mcp add --scope project faultdebug -- \
  /absolute/path/to/FaultDebugMCP/.venv/bin/python \
  -m faultdebug.cli mcp --root /absolute/path/to/artifacts
claude mcp list
In Claude Code, run /mcp to check the connection and available tools. To keep
the server only in your user configuration, replace --scope project with
--scope user.
Ask about a captured failure
Once connected, ask the AI to inspect a concrete artifact. For example:
Inspect
fault-1234.fault. Show the recorded execution flow to the fault, identify which observations are direct evidence versus static candidates, and state what cannot be established from this capture.
For a single-process capture, the model can call open_fault and
get_fault_flow; for recorded RPC observations it can call get_rpc_trace.
For multiple process captures, it can use get_session_manifest,
get_process_relations, or get_incident_report. To inspect indexed source it
can use get_function_source with a verified bundle. Tool results include
evidence categories and known gaps so the model can explain the actual recorded
flow without treating a static candidate or inferred grouping as proven
causality.
The MCP tools only return data to the conversation; they do not write report files. To create a durable Markdown, JSON, and interactive HTML report, run the CLI separately:
.venv/bin/fault-debug fault-report artifacts/fault-1234.fault \
  --output reports/incident-001
For other MCP clients that accept the common mcpServers configuration shape,
use absolute paths:
{
  "mcpServers": {
    "faultdebug": {
      "command": "/absolute/path/to/.venv/bin/fault-debug",
      "args": ["mcp", "--root", "/absolute/path/to/artifacts"]
    }
  }
}
The server is read-only. It does not upload artifacts or contact a remote service. Do not expose sensitive fault artifacts, bundles, or source paths in public issues. To run the MCP inspector in a container with a read-only artifact mount, see the Docker MCP guide.
This CLI registration pattern follows the client-specific MCP commands in the Codex MCP guide and Claude Code MCP guide. The separate manual-start note and explicit tool workflow follow common local-stdio MCP project documentation such as denysvitali/codex-mcp.
The 25 MCP tools publish parameter descriptions, validated limits/enums and read-only annotations. Their stdio definitions and non-mutating behavior are checked in CI. See MCP definition verification and Glama for the local audit command and registry re-evaluation steps.
Evidence rules
FaultDebug keeps these result classes separate:
- Observed: committed runtime records and explicitly matching RPC/IPC endpoints present in the captured evidence.
- Static candidates: possibilities from source or compilation data; these are not proof that a function executed.
- Unresolved: missing, ambiguous, partial, malformed, or untrusted evidence.
A shared trace ID, parent PID, function name, or timestamp alone does not prove cross-process causality. The semantic RPC sidecar is optional and versioned; older artifacts remain readable and report unavailable RPC evidence as unresolved. See the RPC evidence contract and artifact format.
Development
Run the named native tests and launcher acceptance suite:
ctest --test-dir build --output-on-failure
FD_LAUNCHER="$PWD/.venv/bin/fault-debug" \
  .venv/bin/python test/run_tests.py --suite smoke --output test-results/smoke
Changes to artifact, ABI, source-bundle, or MCP contracts should include
malformed-input and compatibility coverage. The v1.2 profile runner and
scheduled/manual GitHub Actions workflow are documented in
docs/clang18-ci.md. Report files, build trees, and
.fault artifacts are generated locally and are not part of the source upload.
Before opening a pull request, read
CONTRIBUTING.md and
SECURITY.md. The project is licensed under
Apache-2.0; third-party notices are in NOTICE.
Documentation
FaultDebug MCP questions
Does FaultDebug run an AI model?
No, FaultDebug does not run an AI model or send data to an AI provider; it provides tools for an AI client to inspect local crash artifacts.
Can the MCP server start the tracing process?
No, the target program must be run with FaultDebug instrumentation first to create the .fault captures before connecting an AI session.
What operating systems are supported?
The runtime currently targets Linux on Ubuntu 24.04 x86_64.