
Enables coding agents to reproduce intermittent test failures, minimize reproduction inputs, and verify code fixes with empirical evidence.
Also known as LBarimi/FailTrace
- Stars
- 0
- Tools
- —
- Downloads, 30 days
- —
- Latest version
- 1.5.0
- Last commit
- Sep 7, 2026
- License
- MIT
What is FailTrace MCP?
FailTrace enables coding agents to reproduce intermittent test failures, minimize reproduction inputs, and verify code fixes with empirical evidence.
Summary generated from the project's README
About FailTrace MCP server
FailTrace provides a way for coding agents to handle intermittent test failures by creating empirical evidence for debugging. It works through a local stdio MCP server or a CLI, allowing developers to capture a failing baseline, minimize reproduction inputs, and verify code patches. The tool runs locally on your machine using Node.js 22.12+ and npm, meaning it requires no external AI APIs, accounts, or telemetry to function.
Agents can use seven specific MCP tools to manage the investigation lifecycle, including regression search, minimization, and verification. The system keeps track of failure signatures and investigation evidence across multiple attempts. It supports existing test runners and assertions, including specific support for NUnit and Unity EditMode tests. To prevent data bloat, the server caps retained stdout and stderr at 16 MiB per trial and 256 MiB per run or minimization process.
What you can do with it
- 1Minimize reproduction inputsAn agent can reduce a complex set of inputs down to the smallest possible data required to trigger a specific test failure.
- 2Verify code patchesA developer can use the tool to check if a proposed fix actually resolves the target failure compared to a saved baseline.
- 3Identify regression sourcesThe system can help find which specific Git change introduced a failing test through a bisect process.
- 4Capture intermittent failuresUsers can run a command to repeat a test multiple times to capture a consistent failure signature.
Written from the project's README. Every use case is checked against a quote from it.
How to install FailTrace MCP
Formats verified 10 Nov 2026Add to CursorAdd to GooseInstall FailTrace MCP in Claude Code
$ claude mcp add failtrace -- npx -y failtraceInstall FailTrace MCP in Cursor
~/.cursor/mcp.json
{
  "mcpServers": {
    "failtrace": {
      "command": "npx",
      "args": [
        "-y",
        "failtrace"
      ]
    }
  }
}Install FailTrace MCP in VS Code
.vscode/mcp.json
{
  "servers": {
    "failtrace": {
      "type": "stdio",
      "command": "npx",
      "args": [
        "-y",
        "failtrace"
      ]
    }
  }
}Install FailTrace MCP in VS Code CLI
$ code --add-mcp '{"name":"failtrace","type":"stdio","command":"npx","args":["-y","failtrace"]}'Install FailTrace MCP in Claude Desktop
claude_desktop_config.json
{
  "mcpServers": {
    "failtrace": {
      "command": "npx",
      "args": [
        "-y",
        "failtrace"
      ]
    }
  }
}Install FailTrace MCP in Codex
$ codex mcp add failtrace -- npx -y failtraceInstall FailTrace MCP in Codex config.toml
~/.codex/config.toml
[mcp_servers.failtrace]
command = "npx"
args = ["-y", "failtrace"]
Install FailTrace MCP in Gemini CLI
$ gemini mcp add -s user failtrace npx -- -y failtraceInstall FailTrace MCP in Gemini settings.json
~/.gemini/settings.json
{
  "mcpServers": {
    "failtrace": {
      "command": "npx",
      "args": [
        "-y",
        "failtrace"
      ]
    }
  }
}Automated checks
Ran Nov 15, 2026Full report →Passed our automated checks. That is not a security audit: read the code and give the server the narrowest access it needs. How checks work

- Source repository linked and reachablelbarimi/failtrace is public and reachablegithub.com/lbarimi/failtrace ↗Pass
- Package names this repository as its sourcefailtrace names lbarimi/failtrace as sourcenpmjs.com/package/failtrace ↗Pass
- Build provenance (Sigstore attestation)No build attestation published for this releaseNot checked
- Open source license (OSI)MITspdx.org/licenses/MIT.html ↗Pass
- Commit or release in the last yearLast commit or release 2026-09-07github.com/lbarimi/failtrace ↗Pass
- OpenSSF ScorecardNot checked
- Package name not close to a popular packageNo popular package one edit away from failtracePass
- No critical advisory in the package or its dependencies6 resolved dependencies checked; no critical advisoryosv.dev ↗Pass
- No hidden instructions to the model0 tool descriptions and the README read; no override phrases, credential paths or hidden charactersPass
- Destructive tools are labelledNot checked
- Remote endpoint answers the MCP handshakeNot checked
README
View on GitHubFailTrace
Reproduce the failure. Check the fix.
A test fails intermittently. Your coding agent changes the code. One passing retry leaves you guessing.
FailTrace repeats the same check, saves a failing baseline, and checks the proposed fix against it. Use the CLI or MCP tools to get trial results, a smaller reproducer, and evidence your agent can inspect before accepting a patch.


Local execution. No AI API, account, or telemetry required. Keep your existing test runner and assertions.
Quick start
With Node.js 22.12+ and npm, run this in any working directory:
npx --yes failtrace demo
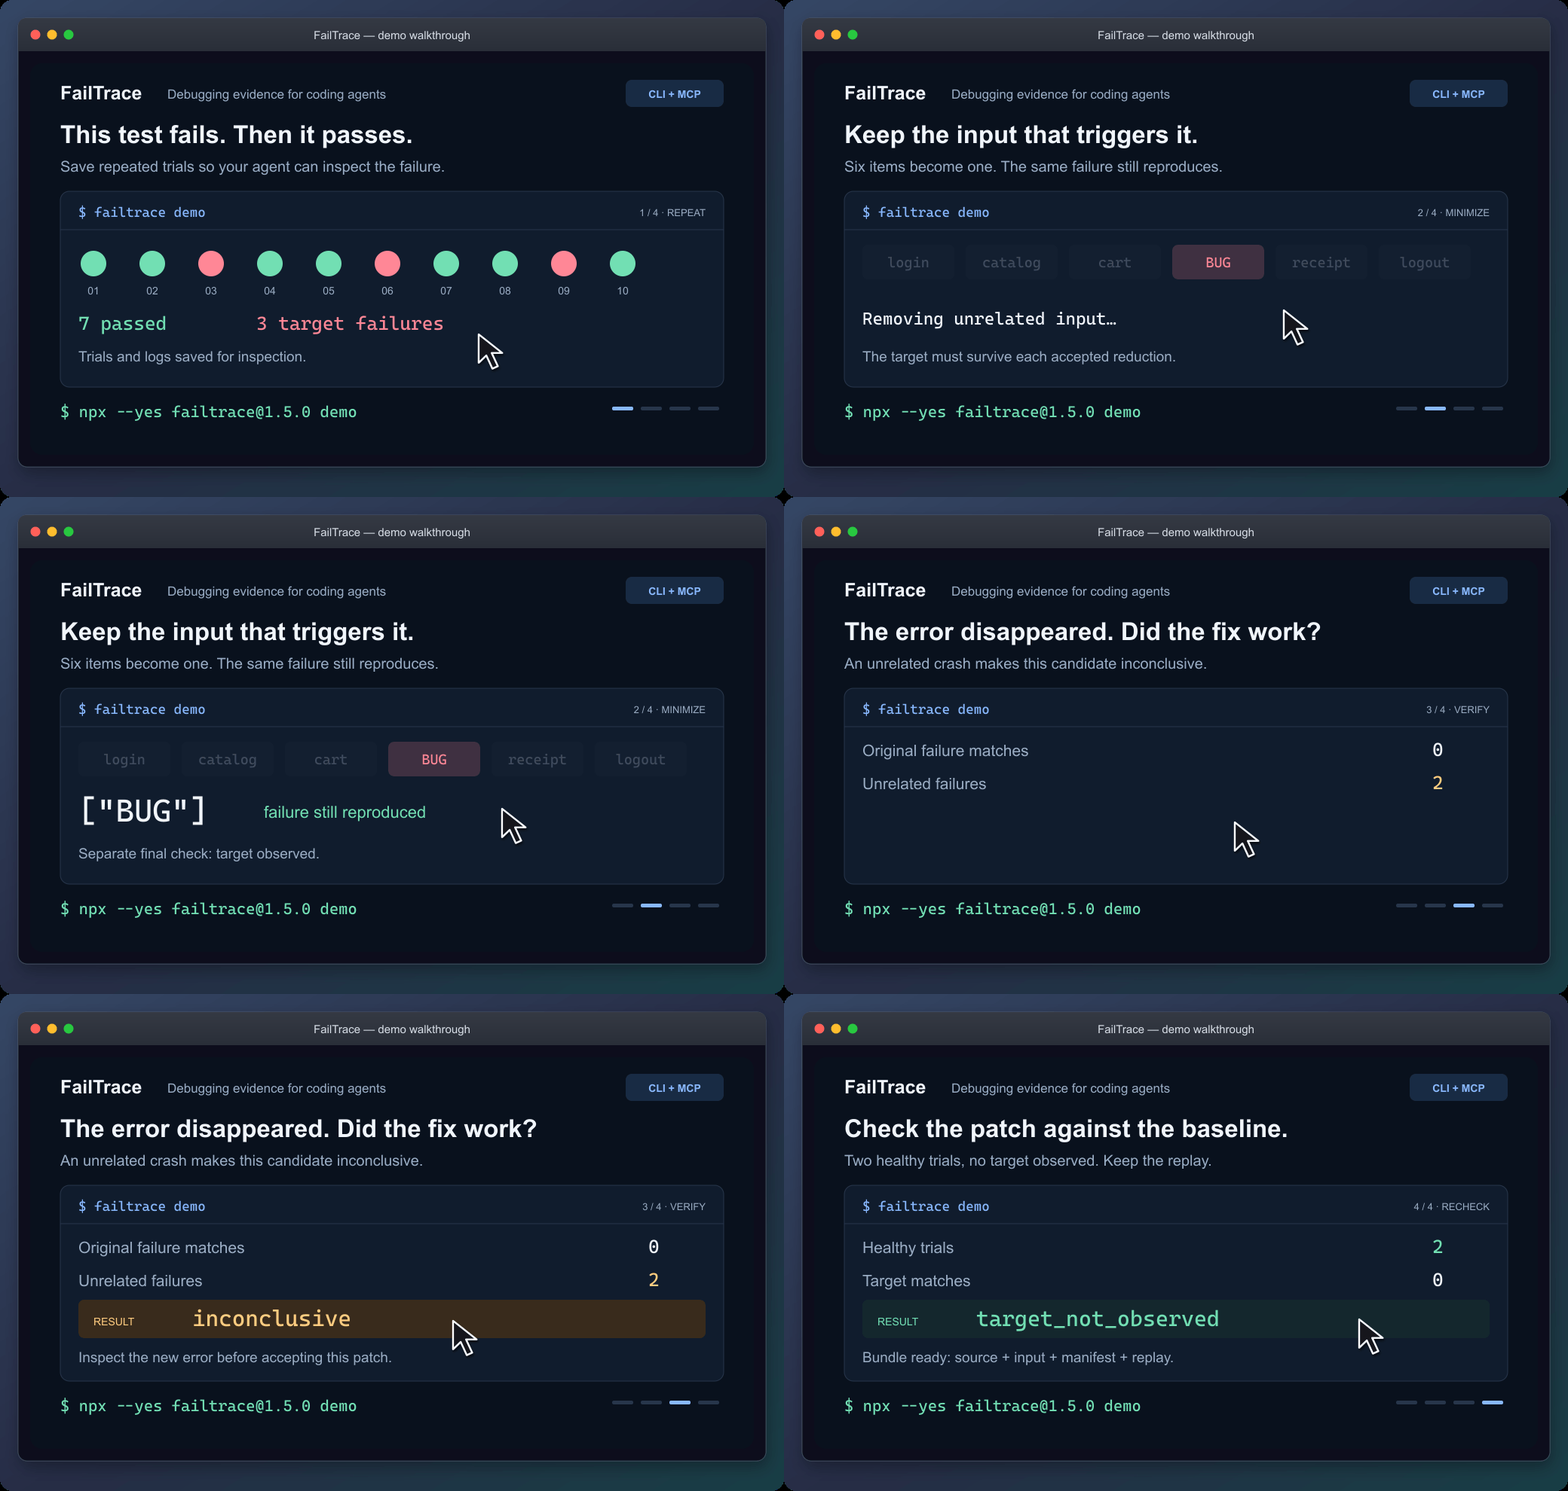
Static walkthrough · Static poster · Demo guide
The demo reduces six input items to ["BUG"], rejects a patch that crashes for another reason, and checks a working patch. It saves the evidence in .failtrace/ and prints a replay command.
For coding agents
Connect the local stdio MCP server through your client's configuration:
npx --yes failtrace@1.5.0 mcp --cwd "/absolute/path/to/your/project"
Copy the MCP configuration and check the connection →
Your client launches this command. Running it alone in a terminal waits for MCP requests. The guide includes Windows setup.
Then ask your agent:
Use FailTrace to capture this test failure before editing. Choose the exact test or failure message, save a bounded baseline, and inspect the matching trial. After the change, verify against that baseline and explain any unrelated errors or incomplete evidence.
The seven MCP tools share the CLI's Core engine. They retain the failure signature and investigation evidence across repetition, comparison, regression search, minimization, verification and replay. Agents can retrieve saved trial and log pages without rerunning the command. Shell-capable agents can also use the CLI with --json.
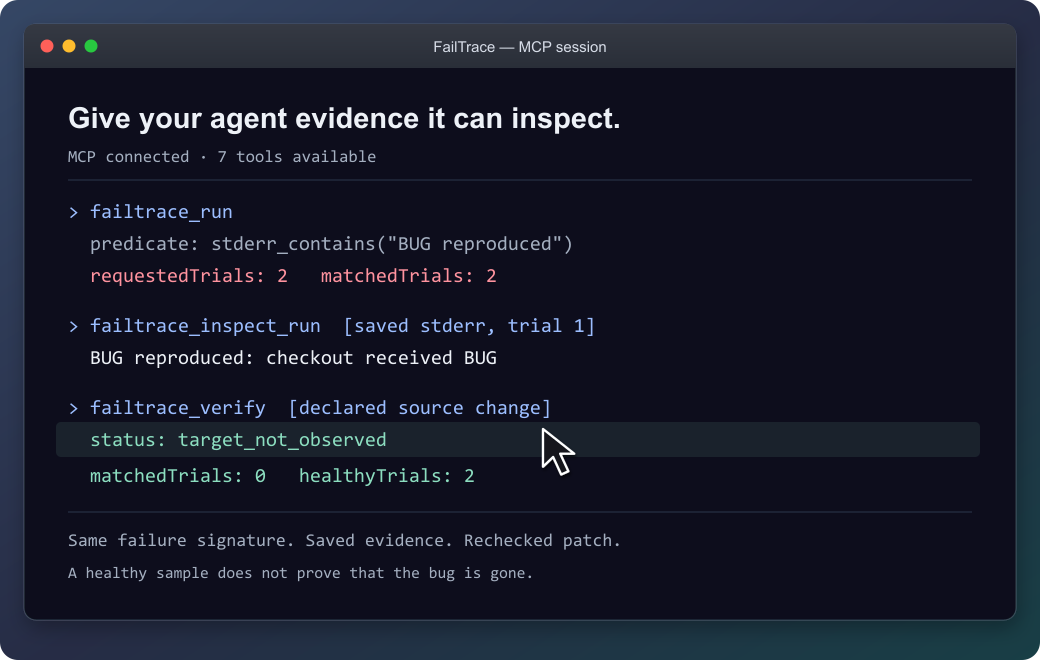
The agent can inspect the saved failure before checking the patch.
Recheck an existing unit test
Follow an exact NUnit or Unity test through a fix. Each attempt gets a fresh NUnit 3 report. Missing or skipped tests and unrelated failures stay inconclusive, so an agent cannot accept them as evidence that the selected test passed.
Connect your test or try the original EditMode example →
NUnit support is included in 1.3.0 through CLI and MCP. The documented Unity validation covers the Windows EditMode example.
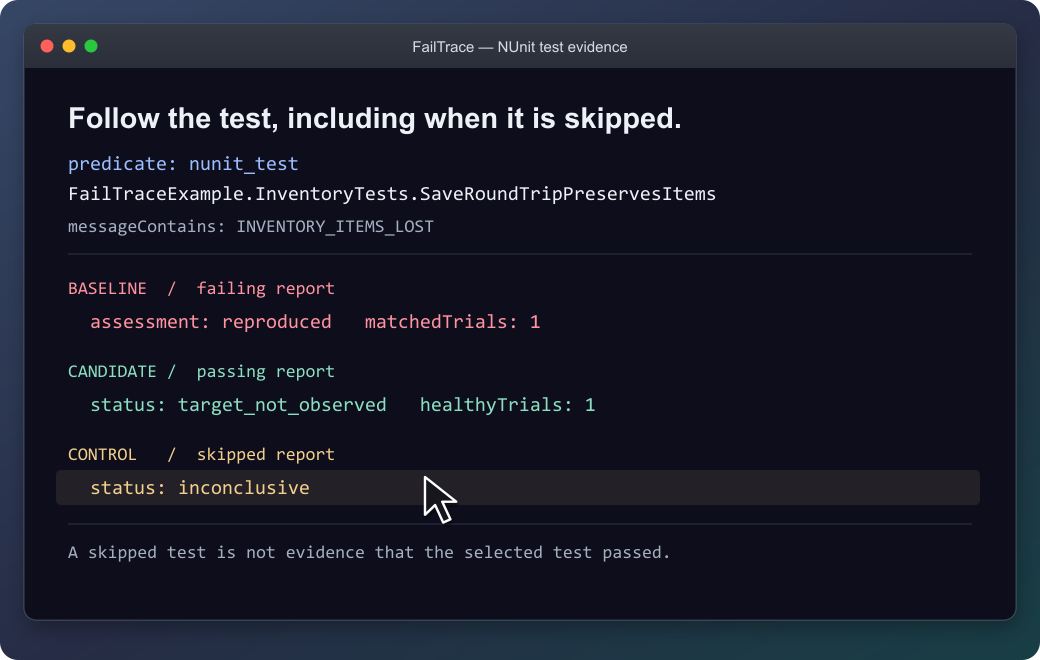
The selected test stays the same; a skipped report is not accepted as a passing test.
Use it on your own failure
From your project, replace the command and message with your own:
npx --yes failtrace@1.5.0 run "npm test -- checkout" --repeat 20 --stderr-contains "checkout failed" --capture-context
Run this before editing in a Git project. --capture-context records source identity for Verify; outside Git, select files with --context-source. Each trial saves its output, and exit 1 can mean the target was captured successfully. Then edit and verify the patch →
| Your next question | Command |
|---|---|
| How often does this failure appear? | run |
| What differs between a healthy and failing trial? | compare |
| Which Git change introduced it? | bisect |
| What input is enough to reproduce it? | minimize |
| What happened after the proposed fix? | verify |
| How can I replay this investigation? | bundle |
Command reference · Literal executable arguments · Reusable project scripts
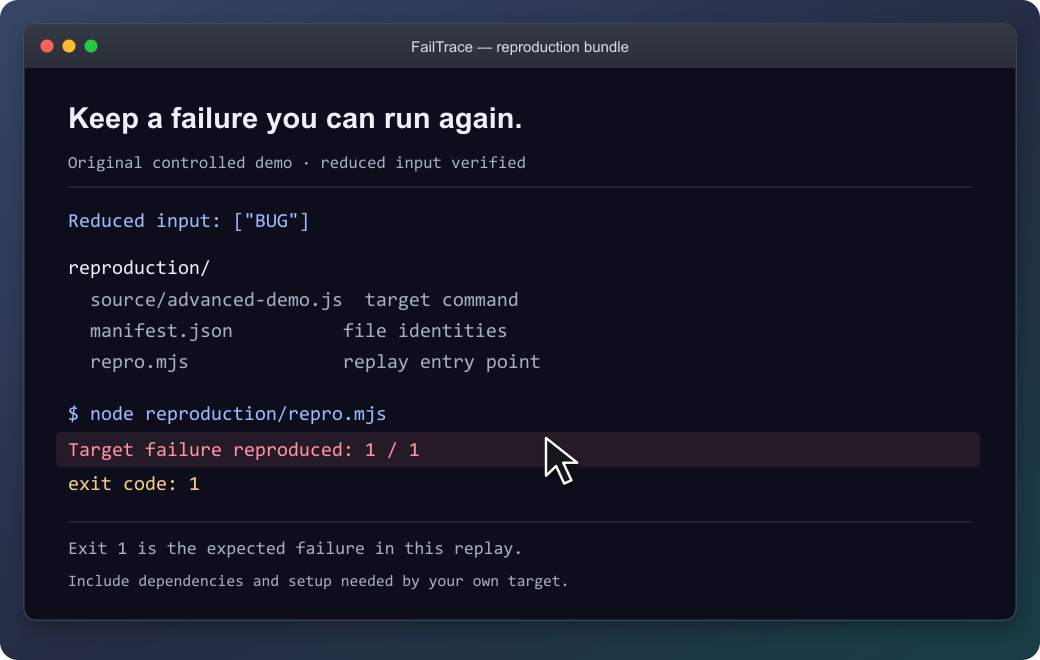
The demo's bundle reproduces its original failure with exit 1. Keep the source, input and replay together; supply the target's prerequisites when packaging your own investigation.
What the results establish
FailTrace reports observations under the chosen settings. Verify separates a target observed, a healthy sample without that target, and inconclusive evidence. Bisect reports a sampled first-parent boundary; minimization rechecks its result without promising the smallest possible input.
The demo shows controlled example outcomes, not performance measurements. A passing sample does not prove a bug is gone.
Commands run with your permissions, and process cleanup is best effort. Retained stdout/stderr is capped by default at 16 MiB per trial and 256 MiB per run or bisect/minimization. Previous investigations accumulate separately. Review logs, commands and selected files before sharing; bundles still require the target's dependencies and setup.
Result and exit-code reference · Resource limits · Storage inventory · Bundle guide
Availability and contributing
The quick start uses npm's latest release; the verified version is 1.5.0. MCP configuration and repeatable installation examples keep that exact version pinned: installation options, GitHub release, and MCP Registry entry.
Version 1.5.0 adds: short run references, Verify readiness and next-step guidance, and intermittent-minimization guidance. See the changelog.
Documentation: choose your next task →
Development instructions · Compatibility · Roadmap · Third-party notices
FailTrace MCP questions
How do I add FailTrace MCP to Claude Code?
Run claude mcp add failtrace -- npx -y failtrace in your terminal. Add --scope user to make it available in every project.
How do I add FailTrace MCP to Cursor?
Open ~/.cursor/mcp.json and add the server under mcpServers, using the Cursor config shown in the install section above.
Does FailTrace require an AI API or account?
No, it performs local execution without requiring any AI API, account, or telemetry.
Can I use FailTrace with NUnit tests?
Yes, NUnit support is included in version 1.3.0 and higher through both the CLI and MCP.
What are the resource limits for logs?
Retained stdout/stderr is capped at 16 MiB per trial and 256 MiB per run, bisect, or minimization.
Does a passing sample prove a bug is fixed?
No, a passing sample does not provide absolute proof that a bug is gone.