
Provides read-only access to Rust profiling reports from CI, including benchmark history, diffs, and performance policies.
Also known as hotpath-rs/hotpath, hotpath
- Stars
- 1,925
- Tools
- —
- Downloads, 30 days
- —
- Latest version
- 1.0.3
- Last commit
- Nov 14, 2026
- License
- MIT
What is hotpath-cloud MCP?
hotpath-cloud provides read-only access to Rust profiling reports from CI, including benchmark history, diffs, and performance policies.
Summary generated from the project's README
About hotpath-cloud MCP server
Developers and AI coding agents can monitor Rust application performance by accessing profiling data through this server. It provides read-only access to reports generated by hotpath-cloud, allowing users to track how code changes affect execution speed and memory usage. By connecting to the cloud service, an AI client can inspect benchmark history and performance diffs directly from continuous integration workflows.
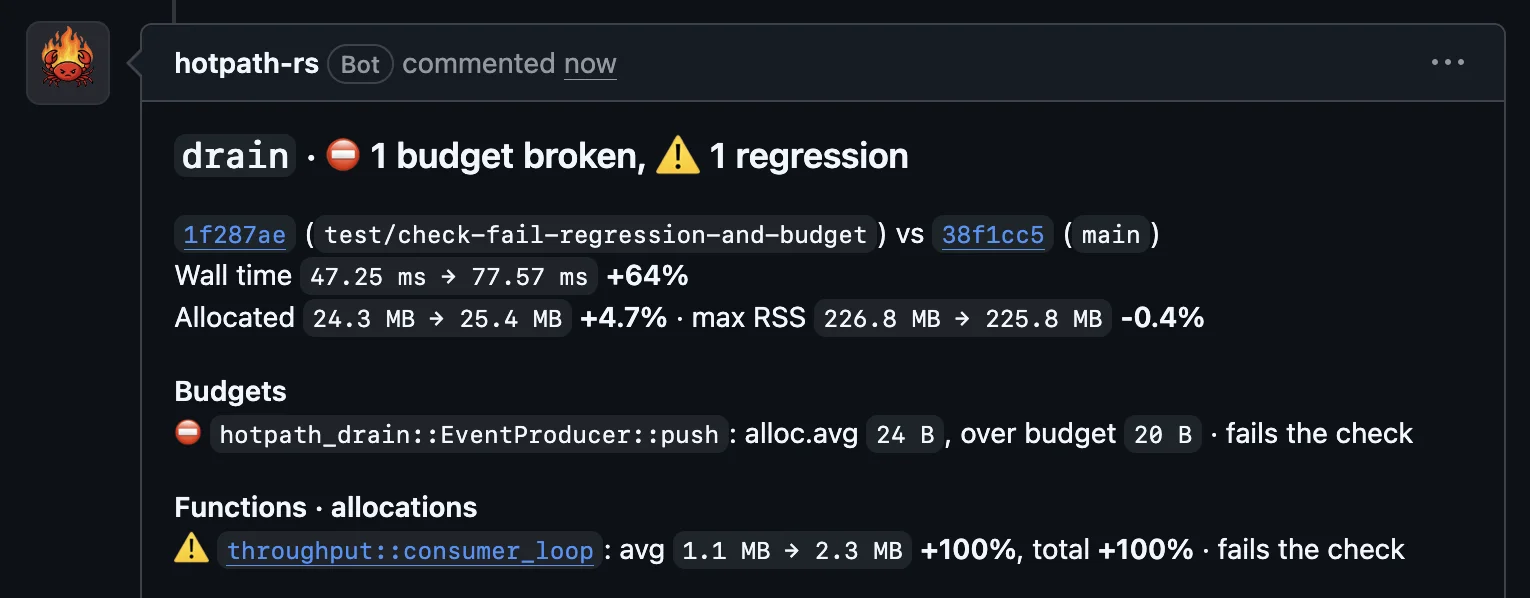
The server is designed to help identify regressions in pull requests by comparing wall time, allocation, and RSS changes against the main branch. It bridges the gap between local profiling with hotpath-rs and remote monitoring, enabling agents to understand why specific functions are slow or memory-intensive. This setup is particularly useful for teams using automated CI pipelines to maintain performance standards without manual report inspection.
What you can do with it
- 1Analyzing memory and timing diffsA developer can ask an AI to compare wall time and allocation metrics between branches.
Written from the project's README. Every use case is checked against a quote from it.
How to install hotpath-cloud MCP
Formats verified 10 Nov 2026Add to CursorAdd to GooseInstall hotpath-cloud MCP in Claude Code
$ claude mcp add --transport http hotpath https://hotpath.rs/api/v1/mcpInstall hotpath-cloud MCP in Cursor
~/.cursor/mcp.json
{
  "mcpServers": {
    "hotpath": {
      "url": "https://hotpath.rs/api/v1/mcp"
    }
  }
}Install hotpath-cloud MCP in VS Code
.vscode/mcp.json
{
  "servers": {
    "hotpath": {
      "type": "http",
      "url": "https://hotpath.rs/api/v1/mcp"
    }
  }
}Install hotpath-cloud MCP in VS Code CLI
$ code --add-mcp '{"name":"hotpath","type":"http","url":"https://hotpath.rs/api/v1/mcp"}'Install hotpath-cloud MCP in Codex
$ codex mcp add hotpath --url https://hotpath.rs/api/v1/mcpInstall hotpath-cloud MCP in Codex config.toml
~/.codex/config.toml
[mcp_servers.hotpath]
url = "https://hotpath.rs/api/v1/mcp"
Install hotpath-cloud MCP in Gemini CLI
$ gemini mcp add -s user --transport http hotpath https://hotpath.rs/api/v1/mcpInstall hotpath-cloud MCP in Gemini settings.json
~/.gemini/settings.json
{
  "mcpServers": {
    "hotpath": {
      "url": "https://hotpath.rs/api/v1/mcp",
      "type": "http"
    }
  }
}Automated checks
Ran Nov 12, 2026Full report →Passed our automated checks. That is not a security audit: read the code and give the server the narrowest access it needs. How checks work

- Source repository linked and reachablePass
- Open source license (OSI)Pass
- Commit or release in the last yearPass
- Package name not close to a popular packageNot checked
- Remote endpoint uses HTTPSPass
- Destructive tools are labelledNot checked
- No hidden instructions to the modelPass
- No critical advisory in the package or its dependenciesNot checked
README
View on GitHubhotpath-rs - Rust Profiler for Easy Performance Debugging




A simple Rust profiler that shows exactly why your code is slow.
Performance profiling for developers and coding agents. Profile CPU, memory allocations, async tasks, SQL queries, I/O, and lock contention in one place. Explore performance metrics in a live TUI, or export to Prometheus and Grafana when you need production monitoring.
Already using Criterion.rs? Criterion tells you how fast your code runs. hotpath-rs explains why. Add detailed CPU and memory profiling to your existing Criterion benchmarks with minimal changes. Explore Criterion integration →
Find bottlenecks locally, then use hotpath-cloud to track performance changes across pull requests.
Try the TUI demo via SSH - no installation required:
ssh demo.hotpath.rs
Or let your AI coding agent set up profiling, paste into Claude Code, Codex, OpenCode or Cursor:
Set up hotpath-rs profiling in this Rust project using the instructions at https://hotpath.rs/agent/setup
hotpath-rs is an easy-to-configure Rust performance profiling toolkit that shows exactly where your code spends time, burns CPU, and allocates memory.
It helps you distinguish between functions that are slow because they wait on I/O and those that are CPU-intensive. Instrument functions, channels, futures, streams, SQL queries, HTTP calls, and byte-level I/O to find bottlenecks and focus optimizations where they matter most. Get actionable insights into time, memory, and async data flow with minimal setup.
Explore the full documentation at hotpath.rs. See CONTRIBUTING.md for development setup and guidelines.
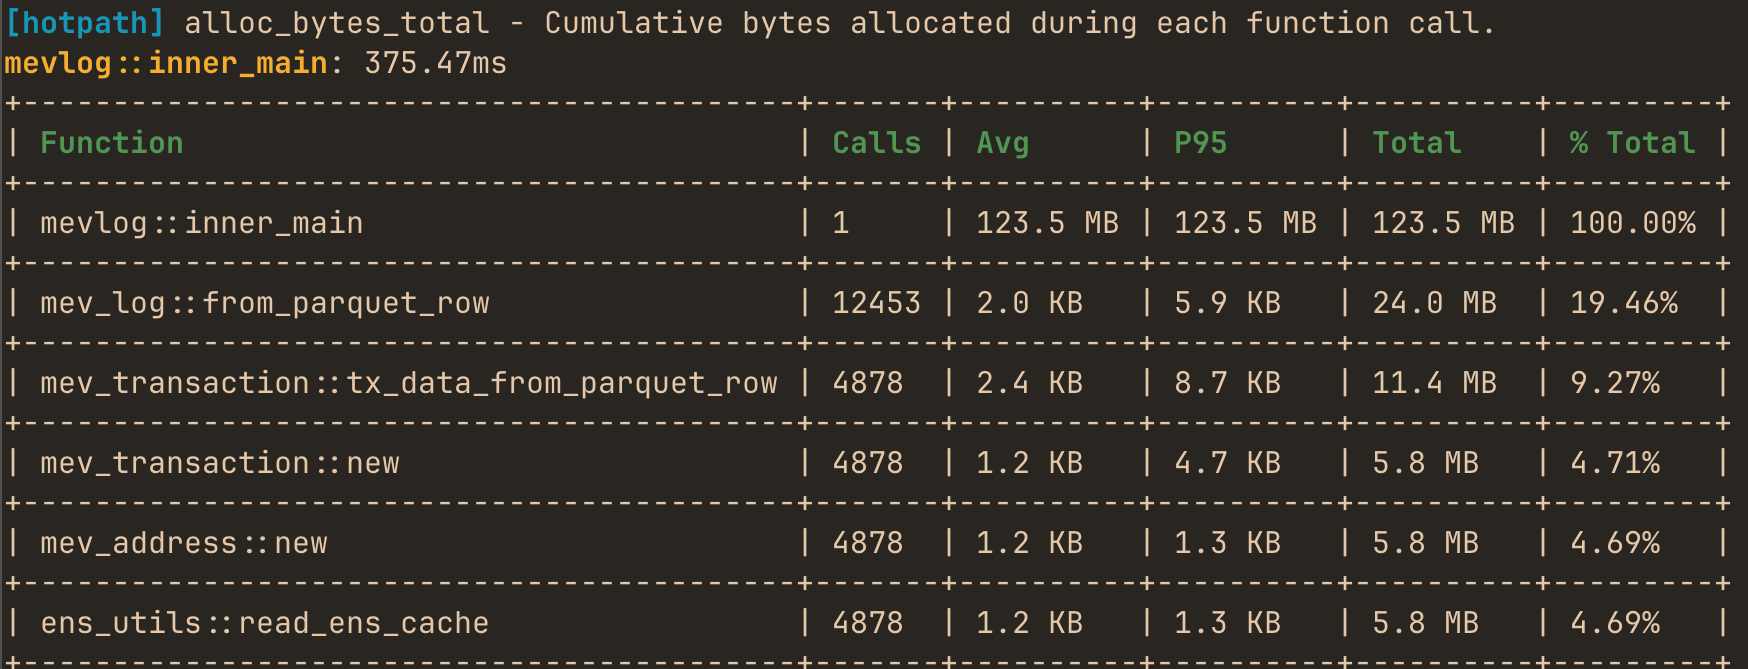
You can use it to produce one-off performance (timing, memory or CPU) reports:
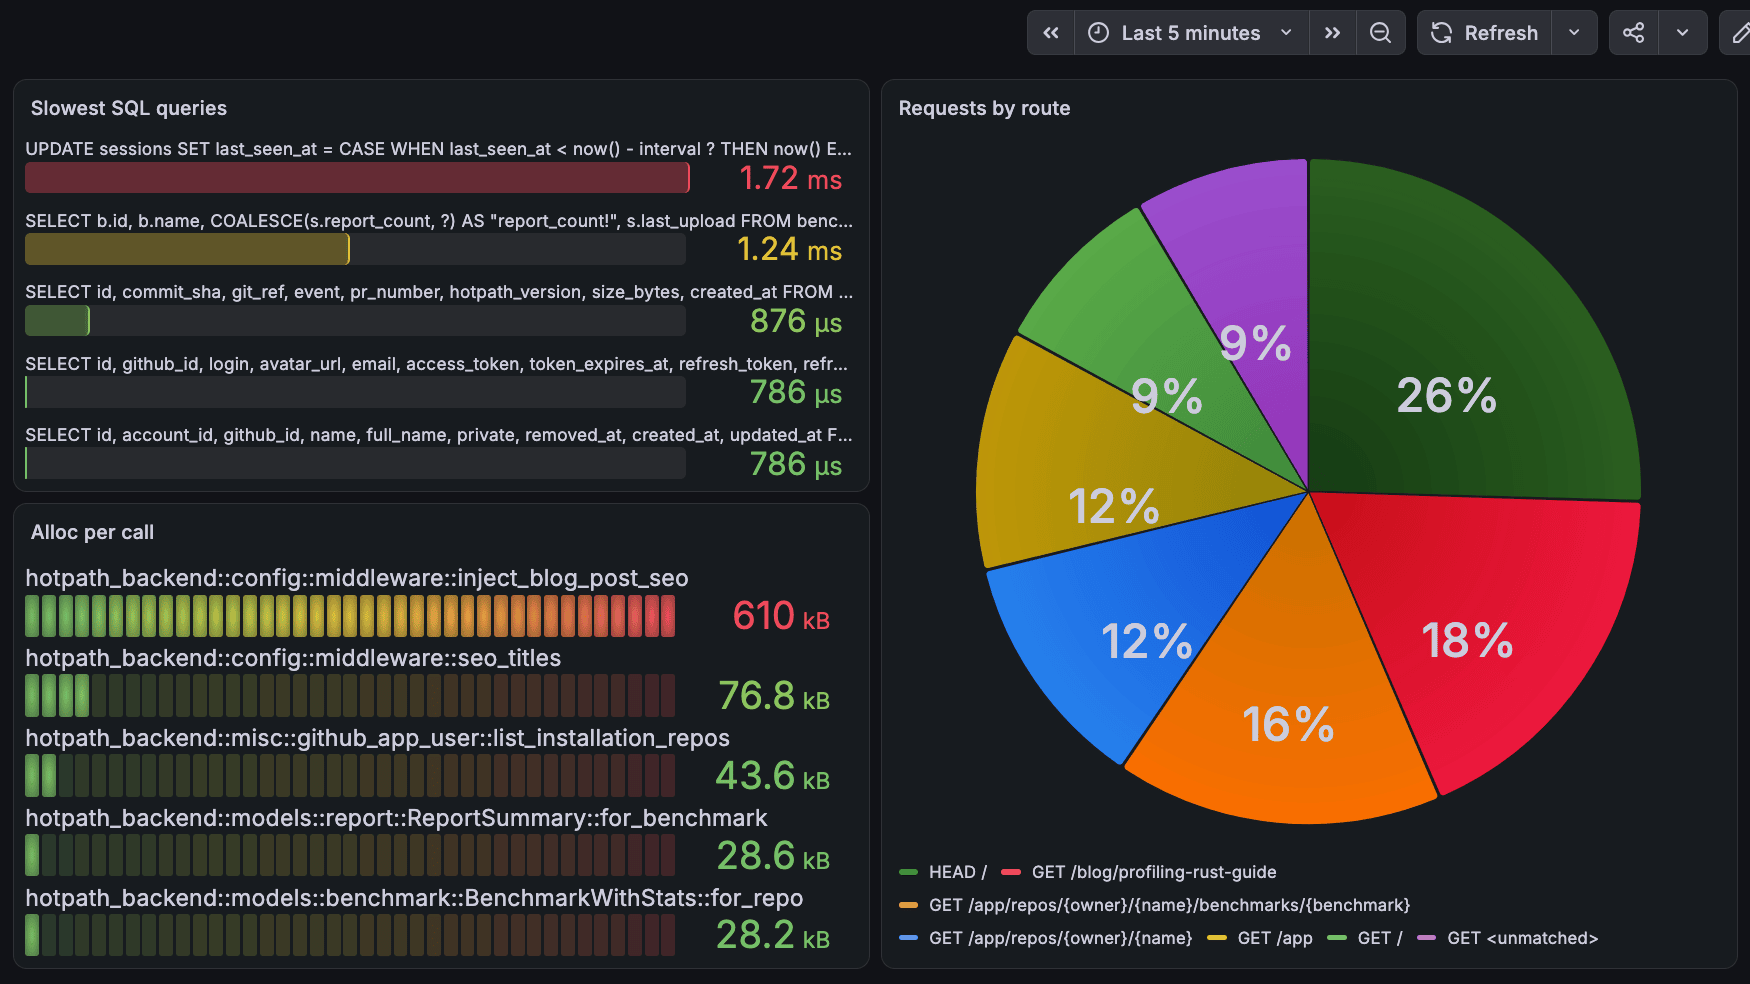
correlate all performance signals in Grafana with minimal profiling overhead:
catch performance regressions on every pull request with a simple CI integration:
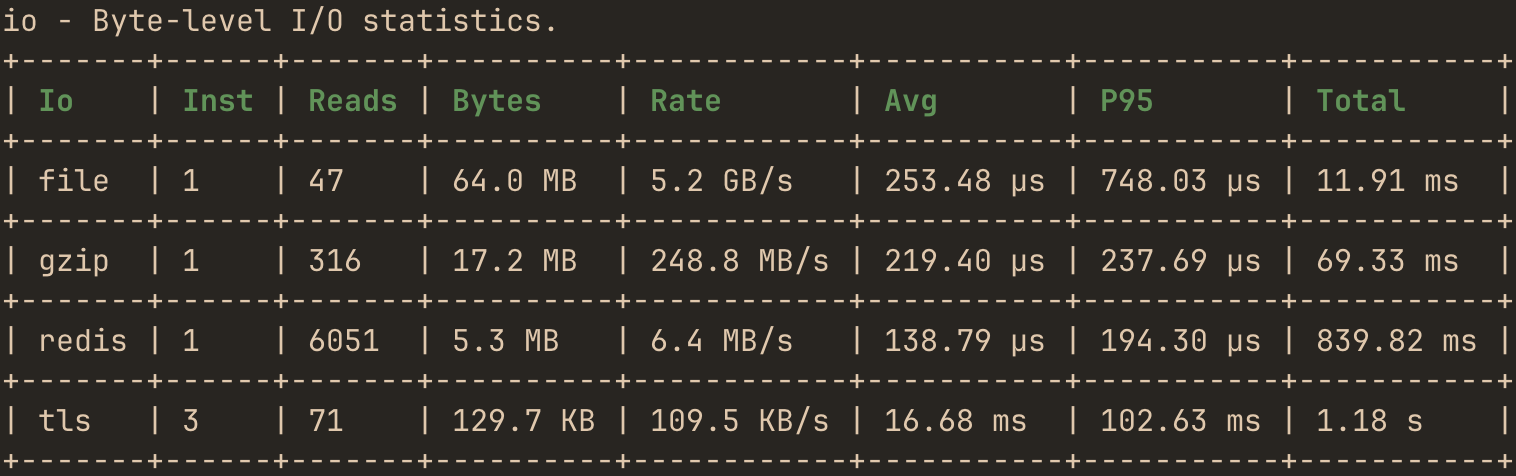
inspect throughput and latency of network, file or compression I/O streams:
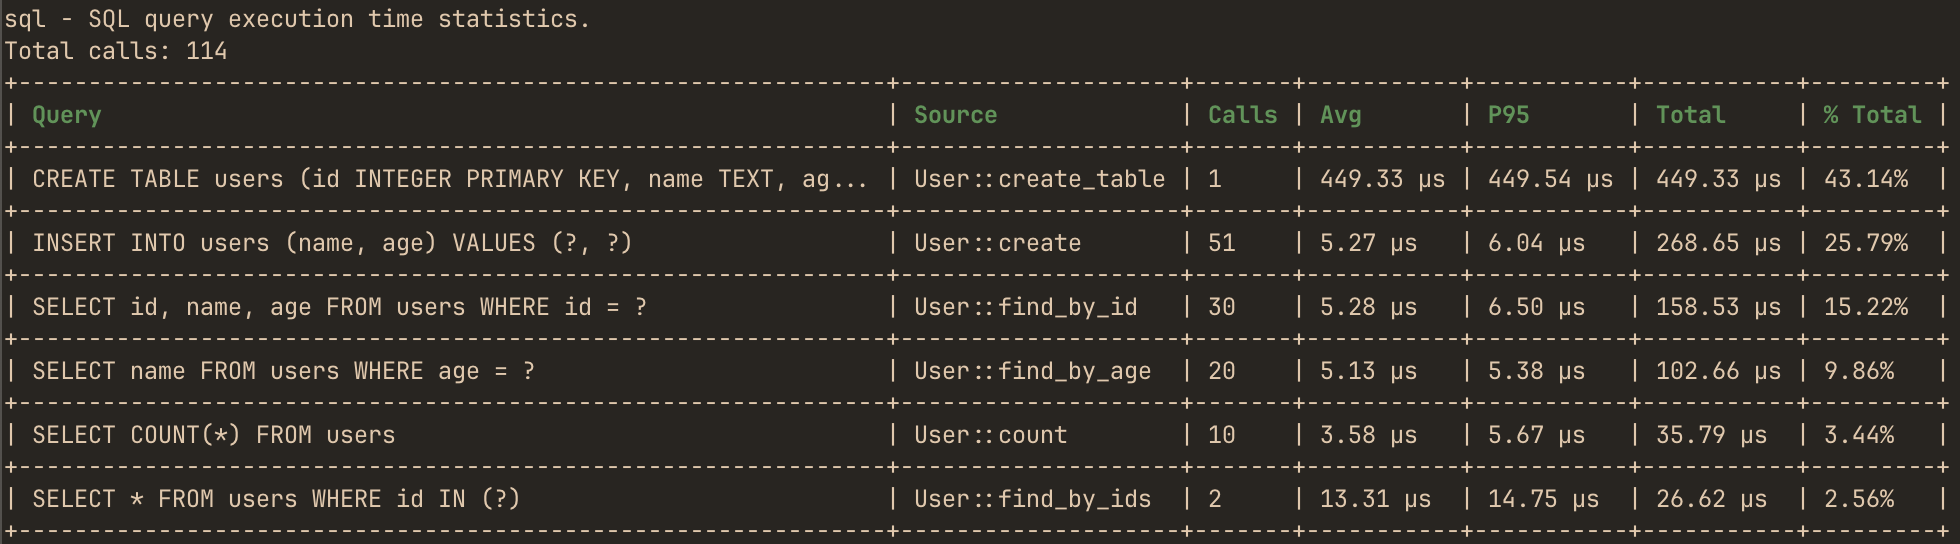
analyze SQL/HTTP calls performance with automatic source function attribution:
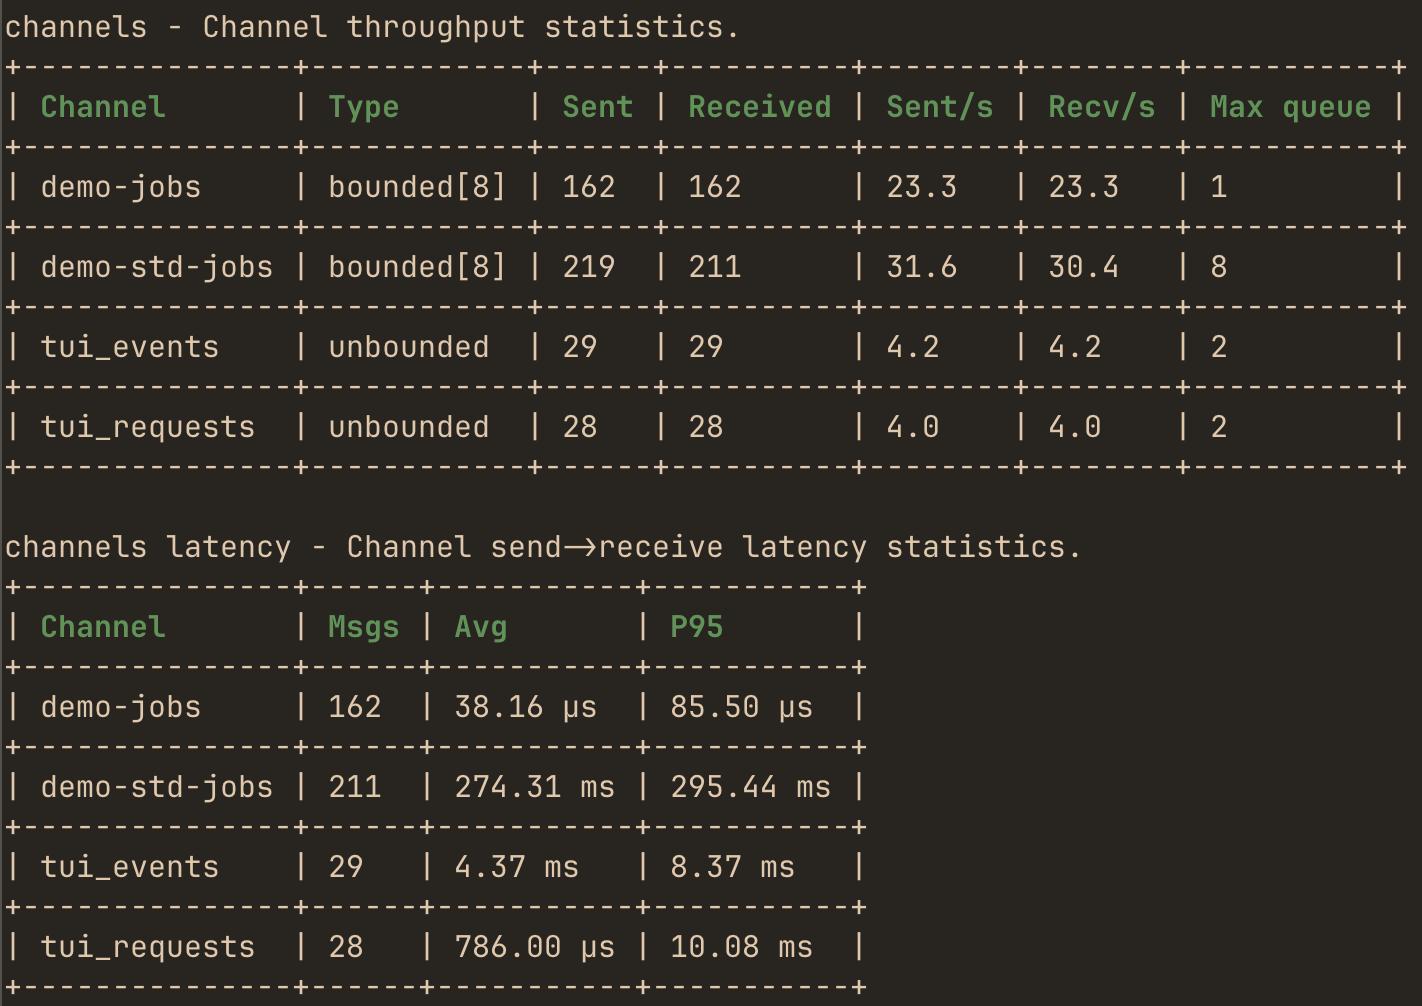
monitor throughput, performance and max queue depth of instrumented channels:
or use the live TUI dashboard to monitor real-time performance and async data flow metrics with debug info:
https://github.com/user-attachments/assets/2e890417-2b43-4b1b-8657-a5ef3b458153
Features
- Time, CPU & memory profiling - identify expensive functions, allocation hotspots, and investigate memory leaks.
- Async observability - futures, channels and streams.
- I/O monitoring - bytes, throughput, latency of any sync or async IO stream like files, TCP, or compression.
- SQL query profiling - query performance metrics for sqlx and Diesel.
- HTTP calls profiling - per-endpoint latency and error metrics for reqwest and ureq.
- HTTP server profiling - per-route response time and error metrics for axum.
- Concurrency metrics - Mutex/RwLock wait time and contention.
- Tokio runtime monitoring - workers, scheduling and queues.
- Prometheus & Grafana integration - export profiling metrics to your existing dashboards.
- Live TUI dashboard & static reports - real-time or one-off analysis.
- CI regression detection - benchmark every PR automatically.
- MCP server for AI agents - query profiling data in real time.
- Zero cost when disabled - fully feature-gated.
Getting Started
AI Setup (Recommended)
The quickest way to set up hotpath is to let your own AI coding agent do it. Paste this prompt into Claude Code, Codex, OpenCode, Cursor or any other coding agent, inside your project repo:
Set up hotpath-rs profiling in this Rust project using the instructions at https://hotpath.rs/agent/setup
The agent inspects your project, including workspaces and any existing hotpath setup, adds the feature-gated dependency, instruments main and a small starting set of hot functions, channels and locks, and verifies that everything compiles with profiling enabled and disabled. When the project has a workload that exits, it runs it and shows you the first report; it does not start long-running servers just to get one. It then explains how to run profiling and the live TUI. It finally asks once whether to optionally set up hotpath-cloud to benchmark pull requests in CI.
The prompt is a one-time project setup. The hotpath-rs agent skill is what stays: reusable hotpath knowledge your agent loads in every later session. To install it, for example in a repo that already uses hotpath, run:
npx skills add hotpath-rs/hotpath --skill hotpath-rs
The skill maps every hotpath task, from instrumenting a crate to fixing a regression flagged in CI, to the documentation page that covers it, so your agent fetches the current docs instead of relying on its memory. Your agent remains in control: you review and approve edits through its regular permission prompts.
Manual installation
Add to your Cargo.toml:
[dependencies]
hotpath = "0.31"

[features]
hotpath = ["hotpath/hotpath"]
hotpath-cpu = ["hotpath", "hotpath/hotpath-cpu"]
hotpath-callgrind = ["hotpath", "hotpath/hotpath-callgrind"]
hotpath-alloc = ["hotpath", "hotpath/hotpath-alloc"]
hotpath-prometheus = ["hotpath", "hotpath/hotpath-prometheus"]
This config ensures that the lib has no compile time or runtime overhead unless explicitly enabled via one of the hotpath features. Every profiling feature also enables hotpath, so a single flag like --features=hotpath-alloc is enough. All the lib dependencies are optional (i.e. not compiled) and all macros are noop unless profiling is enabled.
Basic setup
You'll need only #[hotpath::main] and #[hotpath::measure] macros to get started:
#[hotpath::measure]
fn sync_function(sleep: u64) {
    std::thread::sleep(Duration::from_nanos(sleep));
    let vec1 = vec![1, 2, 3];
    std::hint::black_box(&vec1); // force mem allocation
}

#[hotpath::measure]
async fn async_function(sleep: u64) {
    tokio::time::sleep(Duration::from_nanos(sleep)).await;
}

// When using with tokio, place the #[tokio::main] first
#[tokio::main]
#[hotpath::main]
async fn main() {
    for i in 0..1000 {
        sync_function(i);
        async_function(i * 2).await;

        hotpath::measure_block!("custom_block", {
            std::thread::sleep(Duration::from_nanos(i * 3))
        });
    }
}
Now, run your program with hotpath (and optionally hotpath-alloc features):
cargo run --features='hotpath-alloc'
On exit it will print a report with timings, memory allocations and thread usage metrics:
[hotpath] 1.20s | timing, alloc, threads

timing - Function execution time metrics.
+------------------------------+-------+----------+----------+----------+---------+
| Function                     | Calls | Avg      | P95      | Total    | % Total |
+------------------------------+-------+----------+----------+----------+---------+
| docs_example::main           | 1     | 1.20 s   | 1.20 s   | 1.20 s   | 100.00% |
+------------------------------+-------+----------+----------+----------+---------+
| docs_example::async_function | 1,000 | 1.16 ms  | 1.24 ms  | 1.16 s   | 96.84%  |
+------------------------------+-------+----------+----------+----------+---------+
| custom_block                 | 1,000 | 16.86 µs | 29.50 µs | 16.86 ms | 1.41%   |
+------------------------------+-------+----------+----------+----------+---------+
| docs_example::sync_function  | 1,000 | 12.16 µs | 23.84 µs | 12.17 ms | 1.02%   |
+------------------------------+-------+----------+----------+----------+---------+

alloc-bytes - Exclusive allocation bytes by each function (excluding nested calls).
Total: 100.1 KB
+------------------------------+-------+---------+---------+---------+---------+
| Function                     | Calls | Avg     | P95     | Total   | % Total |
+------------------------------+-------+---------+---------+---------+---------+
| docs_example::main           | 1     | 88.4 KB | 88.4 KB | 88.4 KB | 88.29%  |
+------------------------------+-------+---------+---------+---------+---------+
| docs_example::sync_function  | 1,000 | 12 B    | 12 B    | 11.7 KB | 11.71%  |
+------------------------------+-------+---------+---------+---------+---------+
| custom_block                 | 1,000 | 0 B     | 0 B     | 0 B     | 0.00%   |
+------------------------------+-------+---------+---------+---------+---------+
| docs_example::async_function | 1,000 | 0 B     | 0 B     | 0 B     | 0.00%   |
+------------------------------+-------+---------+---------+---------+---------+

threads - Thread CPU and memory statistics. (Max RSS: 8.6 MB, Alloc: 108.5 KB, Dealloc: 123.8 KB, Diff: -15.3 KB, 5/15)
+-----------------+------+------+----------+---------+----------+
| Thread          | Max% | Avg% | Alloc    | Dealloc | Diff     |
+-----------------+------+------+----------+---------+----------+
| main            | 4.5% | 3.8% | 100.1 KB | 46.0 KB | 54.0 KB  |
+-----------------+------+------+----------+---------+----------+
| tokio-rt-worker | 0.0% | 0.0% | 79 B     | 70.1 KB | -70.0 KB |
+-----------------+------+------+----------+---------+----------+
| tokio-rt-worker | 0.0% | 0.0% | 4.2 KB   | 471 B   | 3.8 KB   |
+-----------------+------+------+----------+---------+----------+
| tokio-rt-worker | 0.0% | 0.0% | 3.3 KB   | 407 B   | 2.9 KB   |
+-----------------+------+------+----------+---------+----------+
| hp-functions    | 1.3% | 1.0% | 0 B      | 2.0 KB  | -2.0 KB  |
+-----------------+------+------+----------+---------+----------+
Full documentation
See the full docs and advanced config tutorials at hotpath.rs.
Read the complete guide to profiling Rust applications - a comprehensive overview of debugging performance issues in Rust.
- Profiling modes - static reports vs live TUI dashboard
- Profiling overhead - per-operation instrumentation cost and time sampling
- Functions - measure execution time and memory allocations
- CPU profiling - attribute CPU samples to instrumented functions
- Threads - monitor threads usage
- Async Data Flow - monitor channels, streams, and futures
- Locks - track Mutex and RwLock wait and hold times
- SQL queries - profile query execution time for sqlx and Diesel
- HTTP requests - profile reqwest and ureq client calls per endpoint
- HTTP server (axum) - profile axum request latency and errors per route
- I/O tracing - monitor bytes, throughput and duration of TCP, Redis, and file operations
- Tokio Runtime - monitor Tokio runtime worker stats and task scheduling
- Debug & Metrics - track custom values with dbg!, val!, and gauge! macros
- Prometheus & Grafana - export metrics to Prometheus and build Grafana dashboards
- Criterion benchmarks - profile existing Criterion benchmarks with timing, allocations and Callgrind instruction counts
- hotpath-cloud CI integration - performance regression detection on every pull request
- MCP Server - LLM integration via Model Context Protocol
- Cargo flamegraph alternatives - when to use
hotpathvs sampling profilers like perf and samply - Configuration - explore all config options
hotpath-cloud
hotpath-cloud turns profiling data into automated performance reviews for Rust pull requests.
Detect performance regressions before they ship by comparing CPU instruction counts, memory allocations, execution times, and SQL queries across PRs. Define performance budgets, get actionable feedback directly in GitHub, and investigate regressions using AI coding agents.
hotpath-cloud MCP questions
How do I add hotpath-cloud MCP to Claude Code?
Run claude mcp add --transport http hotpath https://hotpath.rs/api/v1/mcp in your terminal. Add --scope user to make it available in every project.
How do I add hotpath-cloud MCP to Cursor?
Open ~/.cursor/mcp.json and add the server under mcpServers, using the Cursor config shown in the install section above.
How does hotpath-rs differ from Criterion.rs?
While Criterion.rs measures how fast your code runs, hotpath-rs explains why it is slow by providing detailed CPU and memory profiling.
Can I use hotpath-rs with my existing Prometheus and Grafana setup?
Yes, you can export profiling metrics to your existing dashboards to correlate performance signals.