
traceability-agent MCP server
Commit Nov 11, 2026Maps cross-repository integrations, detects API contract breakage, and visualizes distributed system dependencies as a live graph.
Also known as fecuencas/traceability-agent
- Stars
- 1
- Tools
- 8
- Downloads, 30 days
- —
- Latest version
- —
- Last commit
- Nov 11, 2026
- License
- MIT
What is traceability-agent MCP?
traceability-agent maps cross-repository integrations, detects API contract breakage, and visualizes distributed system dependencies as a live graph. It exposes 8 tools, such as scan_repository, map_integrations, update_obsidian_graph.
Summary generated from the project's README
About traceability-agent MCP server
Developers managing distributed systems can use this tool to map integrations across multiple repositories and visualize dependencies as a live graph. It works by statically analyzing source code to detect API contract breakage, broken artifact dependencies, and Spring Boot wiring bugs without requiring a build or test execution. The server is designed to be installed globally on a machine and can be used with any MCP-compatible client such as Claude Code, Claude Desktop, Cursor, or Windsurf.
Users interact with the agent through an AI assistant to perform tasks like mapping integrations, updating the dependency graph, or generating HTML reports. The system provides visual feedback through color-coded states, ranging from healthy to broken, and can export its findings into a dedicated Obsidian vault or a self-contained HTML report. It specifically tracks field-level differences in OpenAPI or Swagger files to flag exactly which attribute caused a contract mismatch between a provider and a client.
What you can do with it
- 1Detect API contract mismatchesIdentify exactly which field or type changed between a provider and a client repository.
- 2Analyze cascading system impactsDetermine how a change in one service will transitively affect downstream consumers.
- 3Find Spring Boot configuration errorsLocate local wiring bugs like missing annotations or unreachable component scans in Java or Kotlin projects.
Written from the project's README. Every use case is checked against a quote from it.
traceability-agent MCP tools 8
Detected from the READMEscan_repositorymap_integrationsupdate_obsidian_graphanalyze_impactgenerate_impact_reportgenerate_html_reportgenerate_regression_testsgenerate_overview_graph
Automated checks
Ran Nov 14, 2026Full report →Not verified yet. A server needs a score of 80, no serious finding, and enough data for us to check. How checks work · What to fix for more points

- Source repository linked and reachablefecuencas/traceability-agent is public and reachablegithub.com/fecuencas/traceability-agent ↗Pass
- Package names this repository as its sourceNot checked
- Build provenance (Sigstore attestation)Not checked
- Open source license (OSI)MITspdx.org/licenses/MIT.html ↗Pass
- Commit or release in the last yearLast commit or release 2026-11-11github.com/fecuencas/traceability-agent ↗Pass
- OpenSSF ScorecardNot checked
- Package name not close to a popular packageNot checked
- No critical advisory in the package or its dependenciesNot checked
- No hidden instructions to the model8 tool descriptions and the README read; no override phrases, credential paths or hidden charactersPass
- Destructive tools are labelledNo tool named like delete, drop or execPass
- Remote endpoint answers the MCP handshakeNot checked
README
View on GitHubtraceability-agent

An MCP server that maps integrations across the multiple repositories that make up one distributed system, detects breakage statically (no build/tests required), and visualizes the whole thing as a graph. It speaks the Model Context Protocol, so it works with any MCP-compatible AI tool — Claude Code, Claude Desktop, Cursor, Windsurf, or your own MCP client — not just one vendor. Install it once, globally, and it's available from any project on the machine.
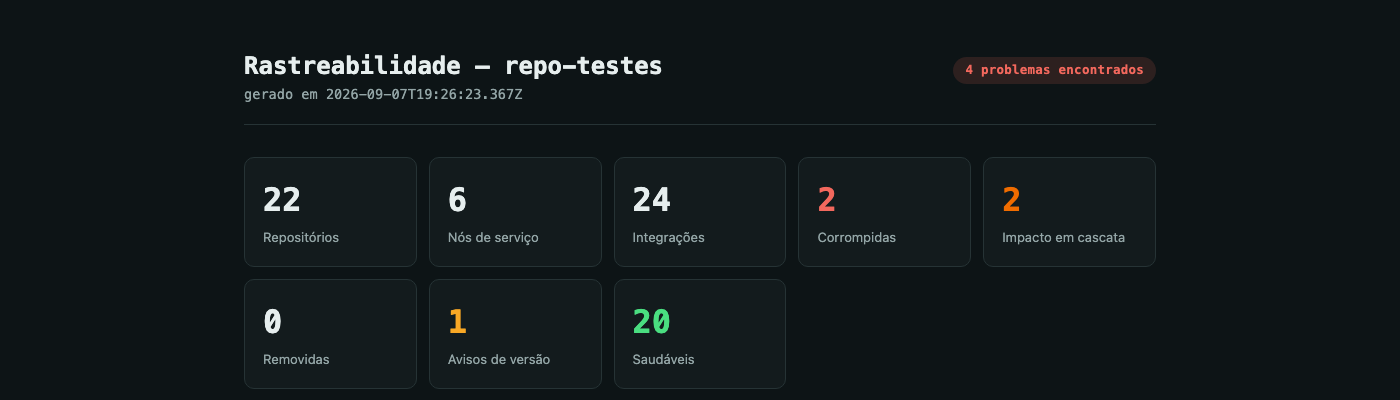
What it actually catches
Most integration diagrams are drawn by hand and go stale the day after they're drawn. This agent re-derives the graph from the real source code on every run, and flags exactly what changed:
- Cross-repo API contract breakage. Two repositories each hold a copy of the same
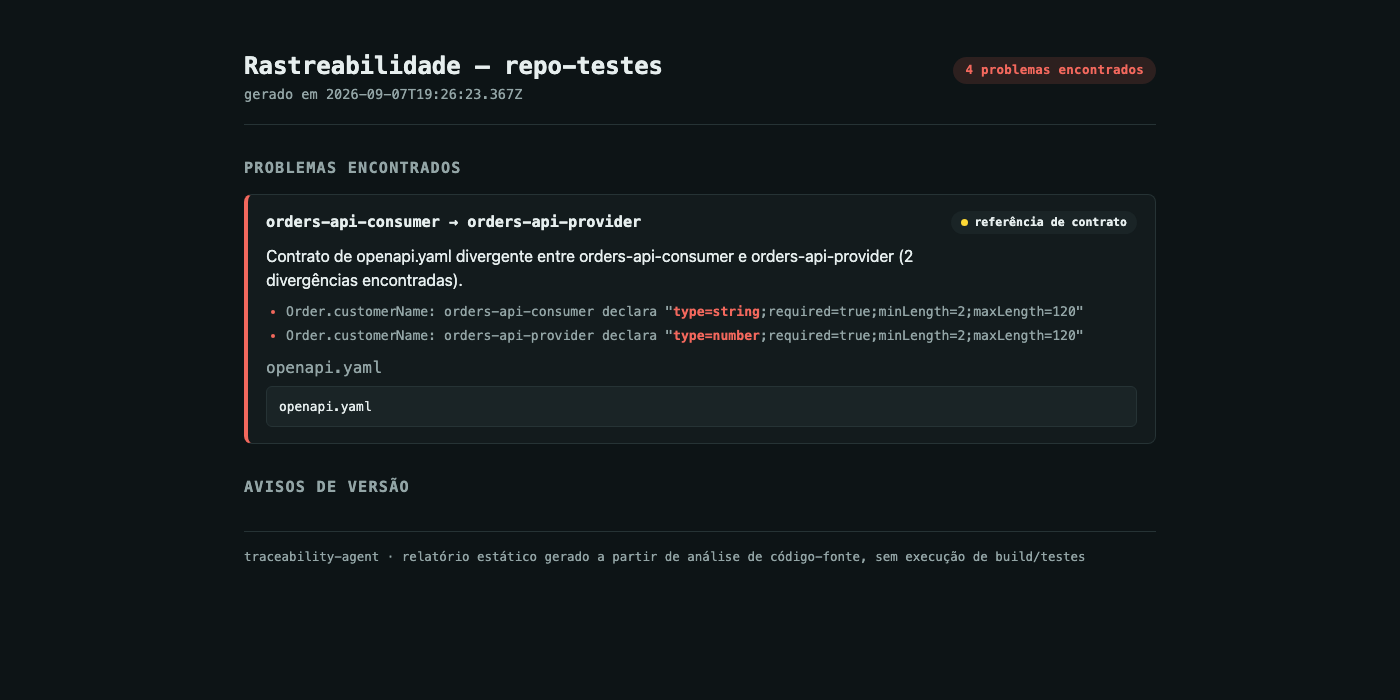
openapi.yaml/swagger.json(a provider and a client-generation copy, for example). The agent diffs the two copies field by field — type,required,minLength/maxLength,pattern,minimum/maximum,enum— and flags a real break the moment they diverge, down to which attribute changed and what each side declares. - Broken artifact dependencies. A repo imports a class from a shared library that no longer exists in that library's current source — flagged without running a build.
- Cascading impact. When something breaks, everything transitively depending on it lights up too, with the correct direction per integration type (a broken queue affects consumers downstream; a broken HTTP dependency affects the caller, not the callee).
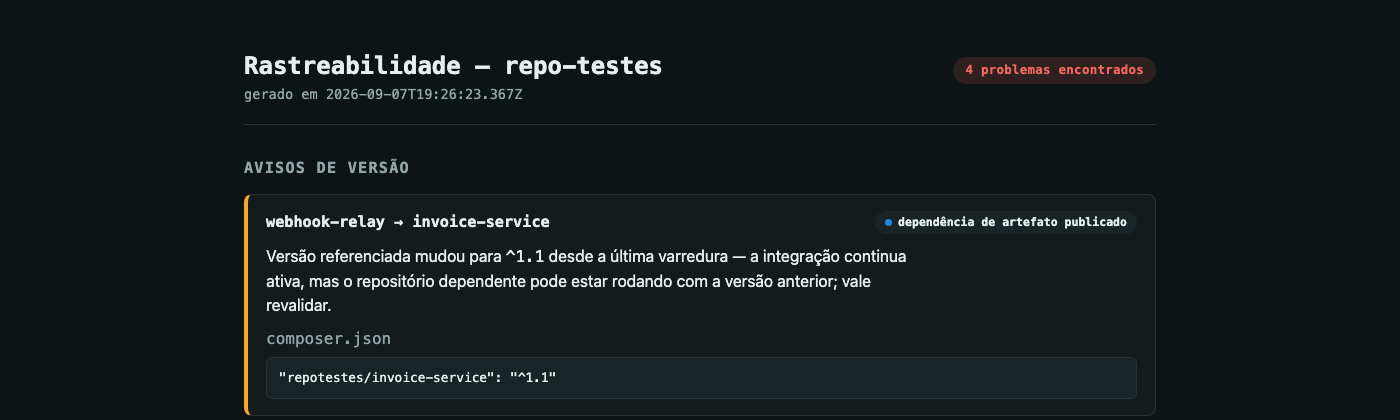
- "Something changed, might be worth a look." A dependency version bumped, or a contract with no known consumer changed shape — surfaced as a distinct warning, not lumped in with real breaks, because the dependent side may keep working fine on the old version.
- Spring Boot wiring bugs (Java/Kotlin repos that depend on
org.springframework.boot:*): the classic "forgot an annotation, context won't start" class of bug — a main class that callsSpringApplication.run()/runApplication()without@SpringBootApplication, a class with@Beanmethods that itself isn't@Configuration, or a@Service/@Component/... class sitting in a package the default component-scan never reaches. These are local findings (scoped to one repository, not a cross-repo integration) — they never cascade to other repos' status, but they do count toward the overall problem count in the HTML report and get their own block on the repo's Obsidian note. Skips itself (no finding, ever) whenever it can't resolve something with confidence — e.g. a custom@ComponentScananywhere in the repo disables the component-scan-package check entirely rather than risk a false positive.
Four-state color coding runs consistently through every surface: 🟢 healthy · 🟡 warning (changed, not confirmed broken) · 🟠 cascading impact · 🔴 broken. Each type of integration also carries its own emoji wherever its label appears — 📦 artifact dependency, 🔌 HTTP call, 📤/📥 queue publish/consume, 📄 contract reference, ⚙️ configured endpoint — so a direct HTTP call and a contract reference are visually distinct at a glance even when there's no queue/infra node in between to carry its own icon.
Screenshots
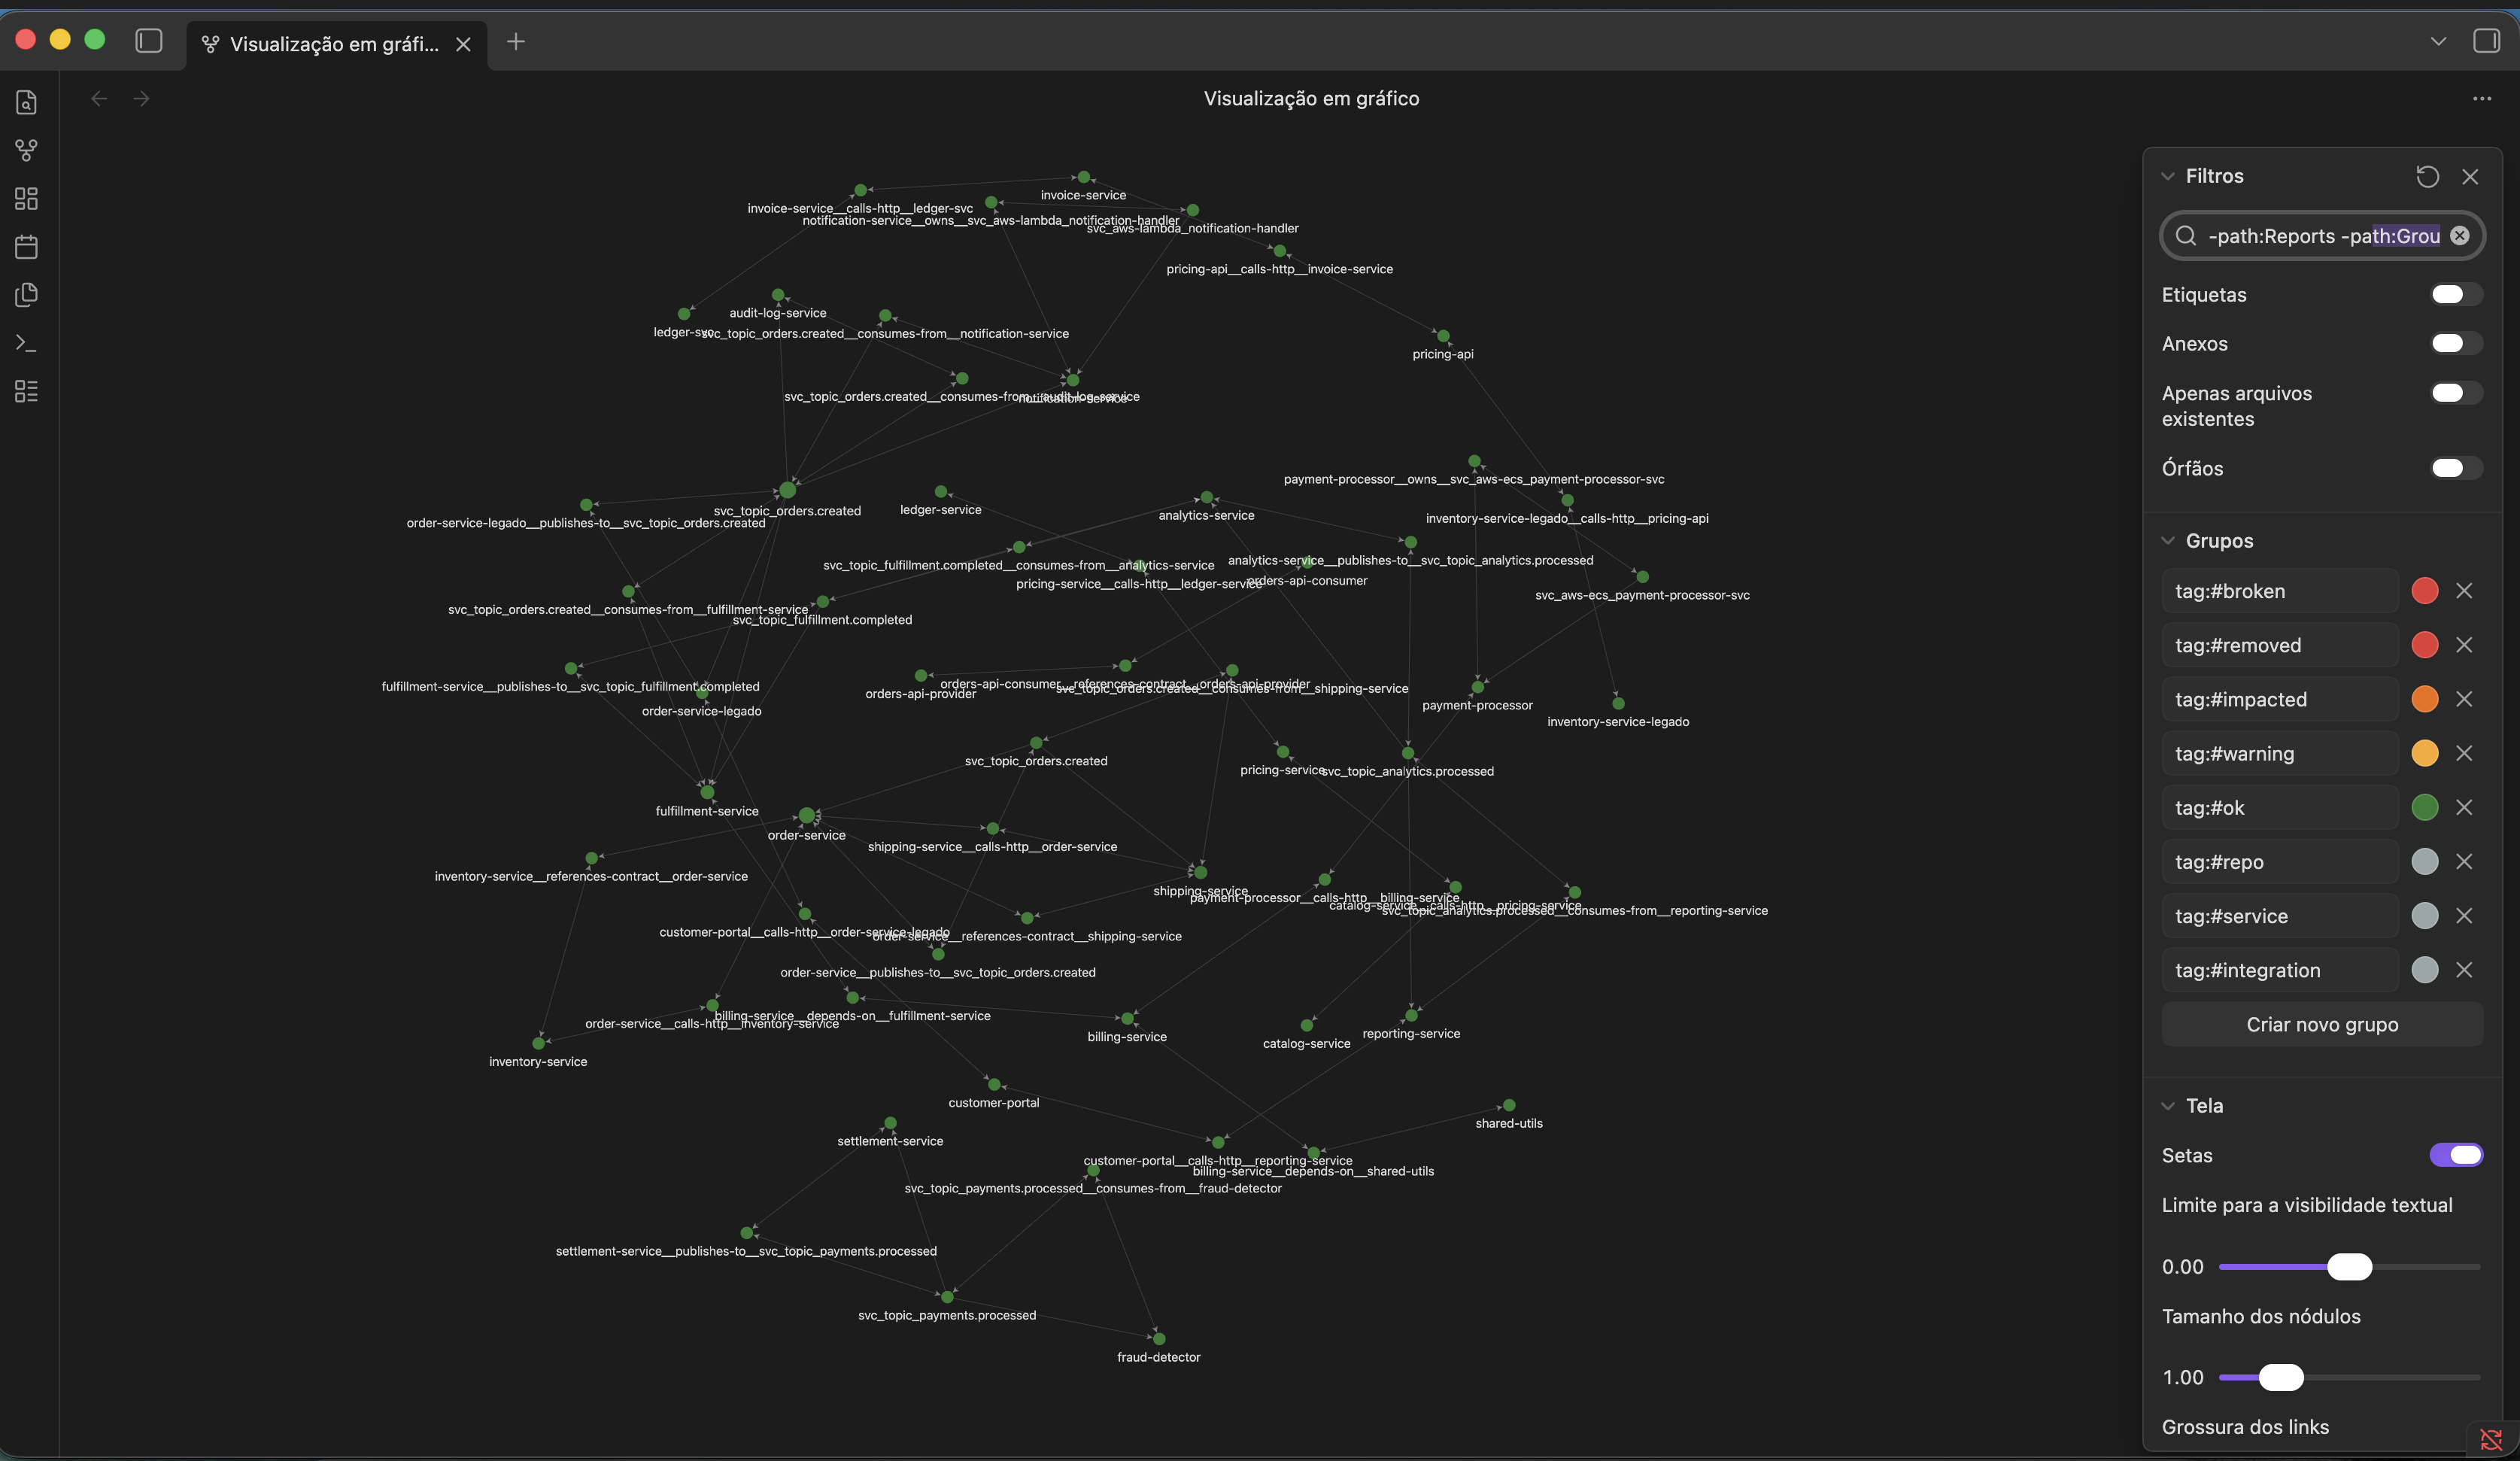
Obsidian graph view, healthy — every tracked repo colored green, node groups (broken/impacted/ warning/ok) configured as Obsidian graph groups so status is visible without opening a single note:
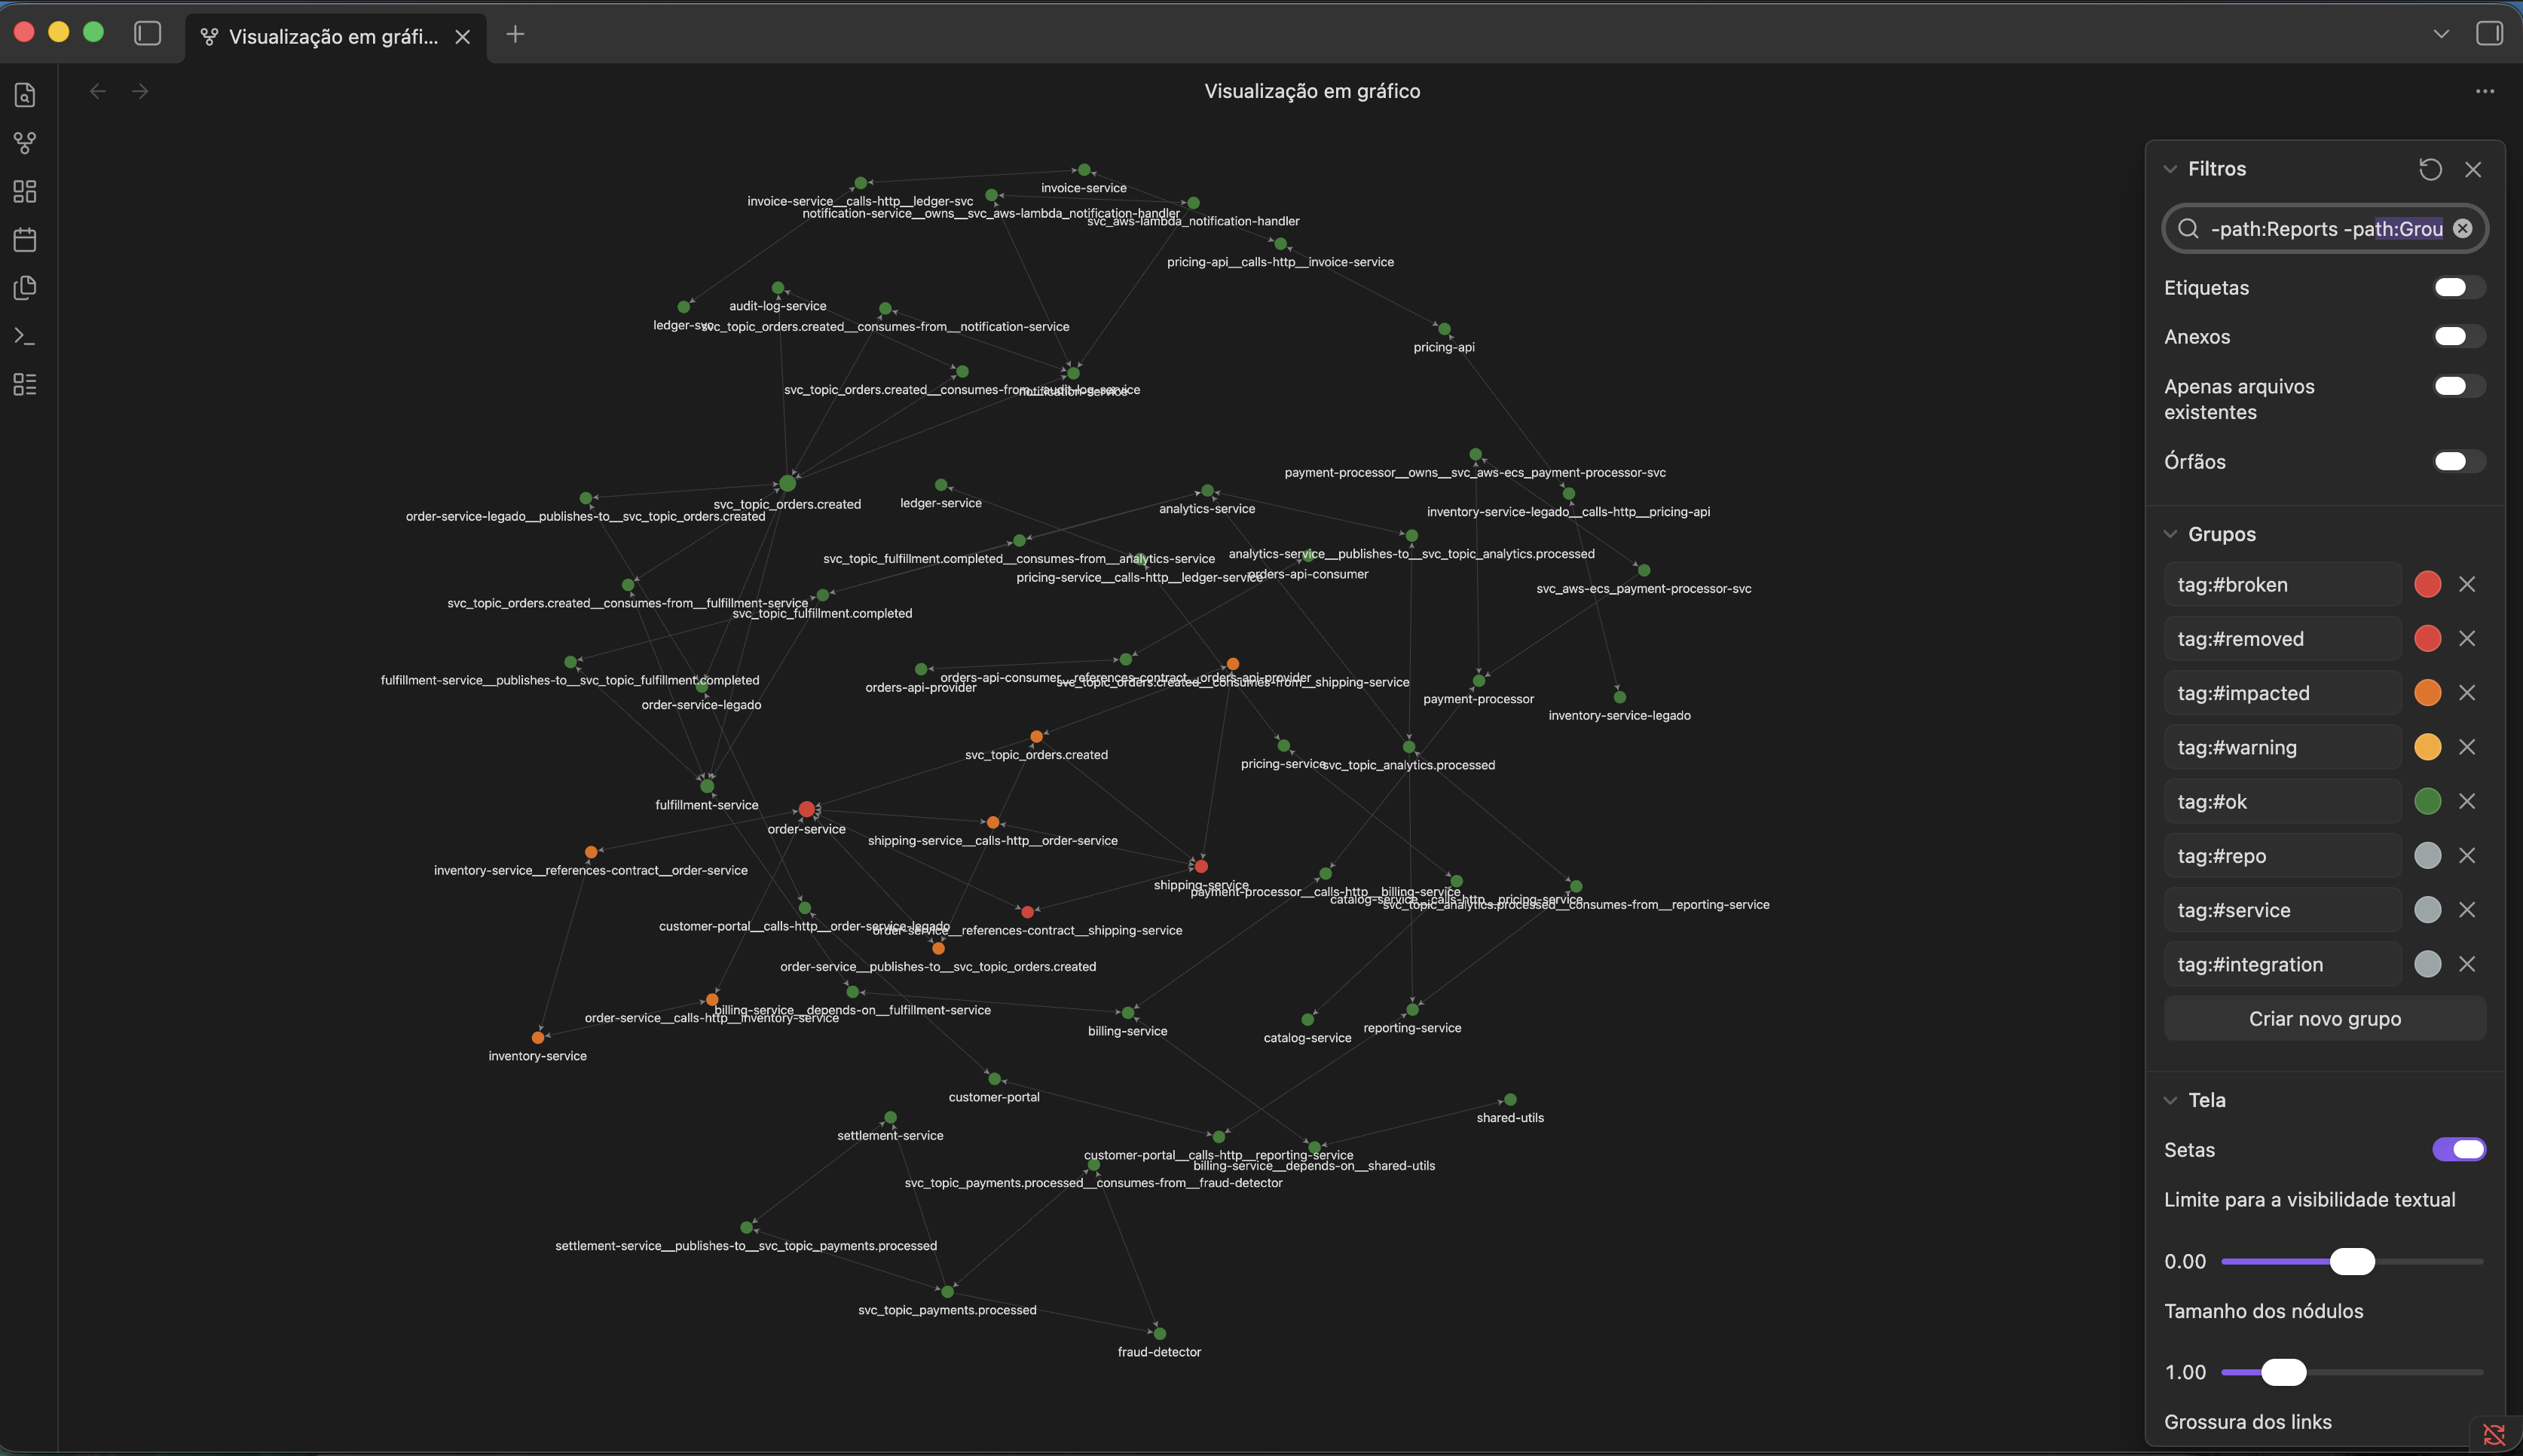
Same graph, moments later — a contract diverged between order-service and shipping-service;
both turn red and everything transitively connected to them turns orange:
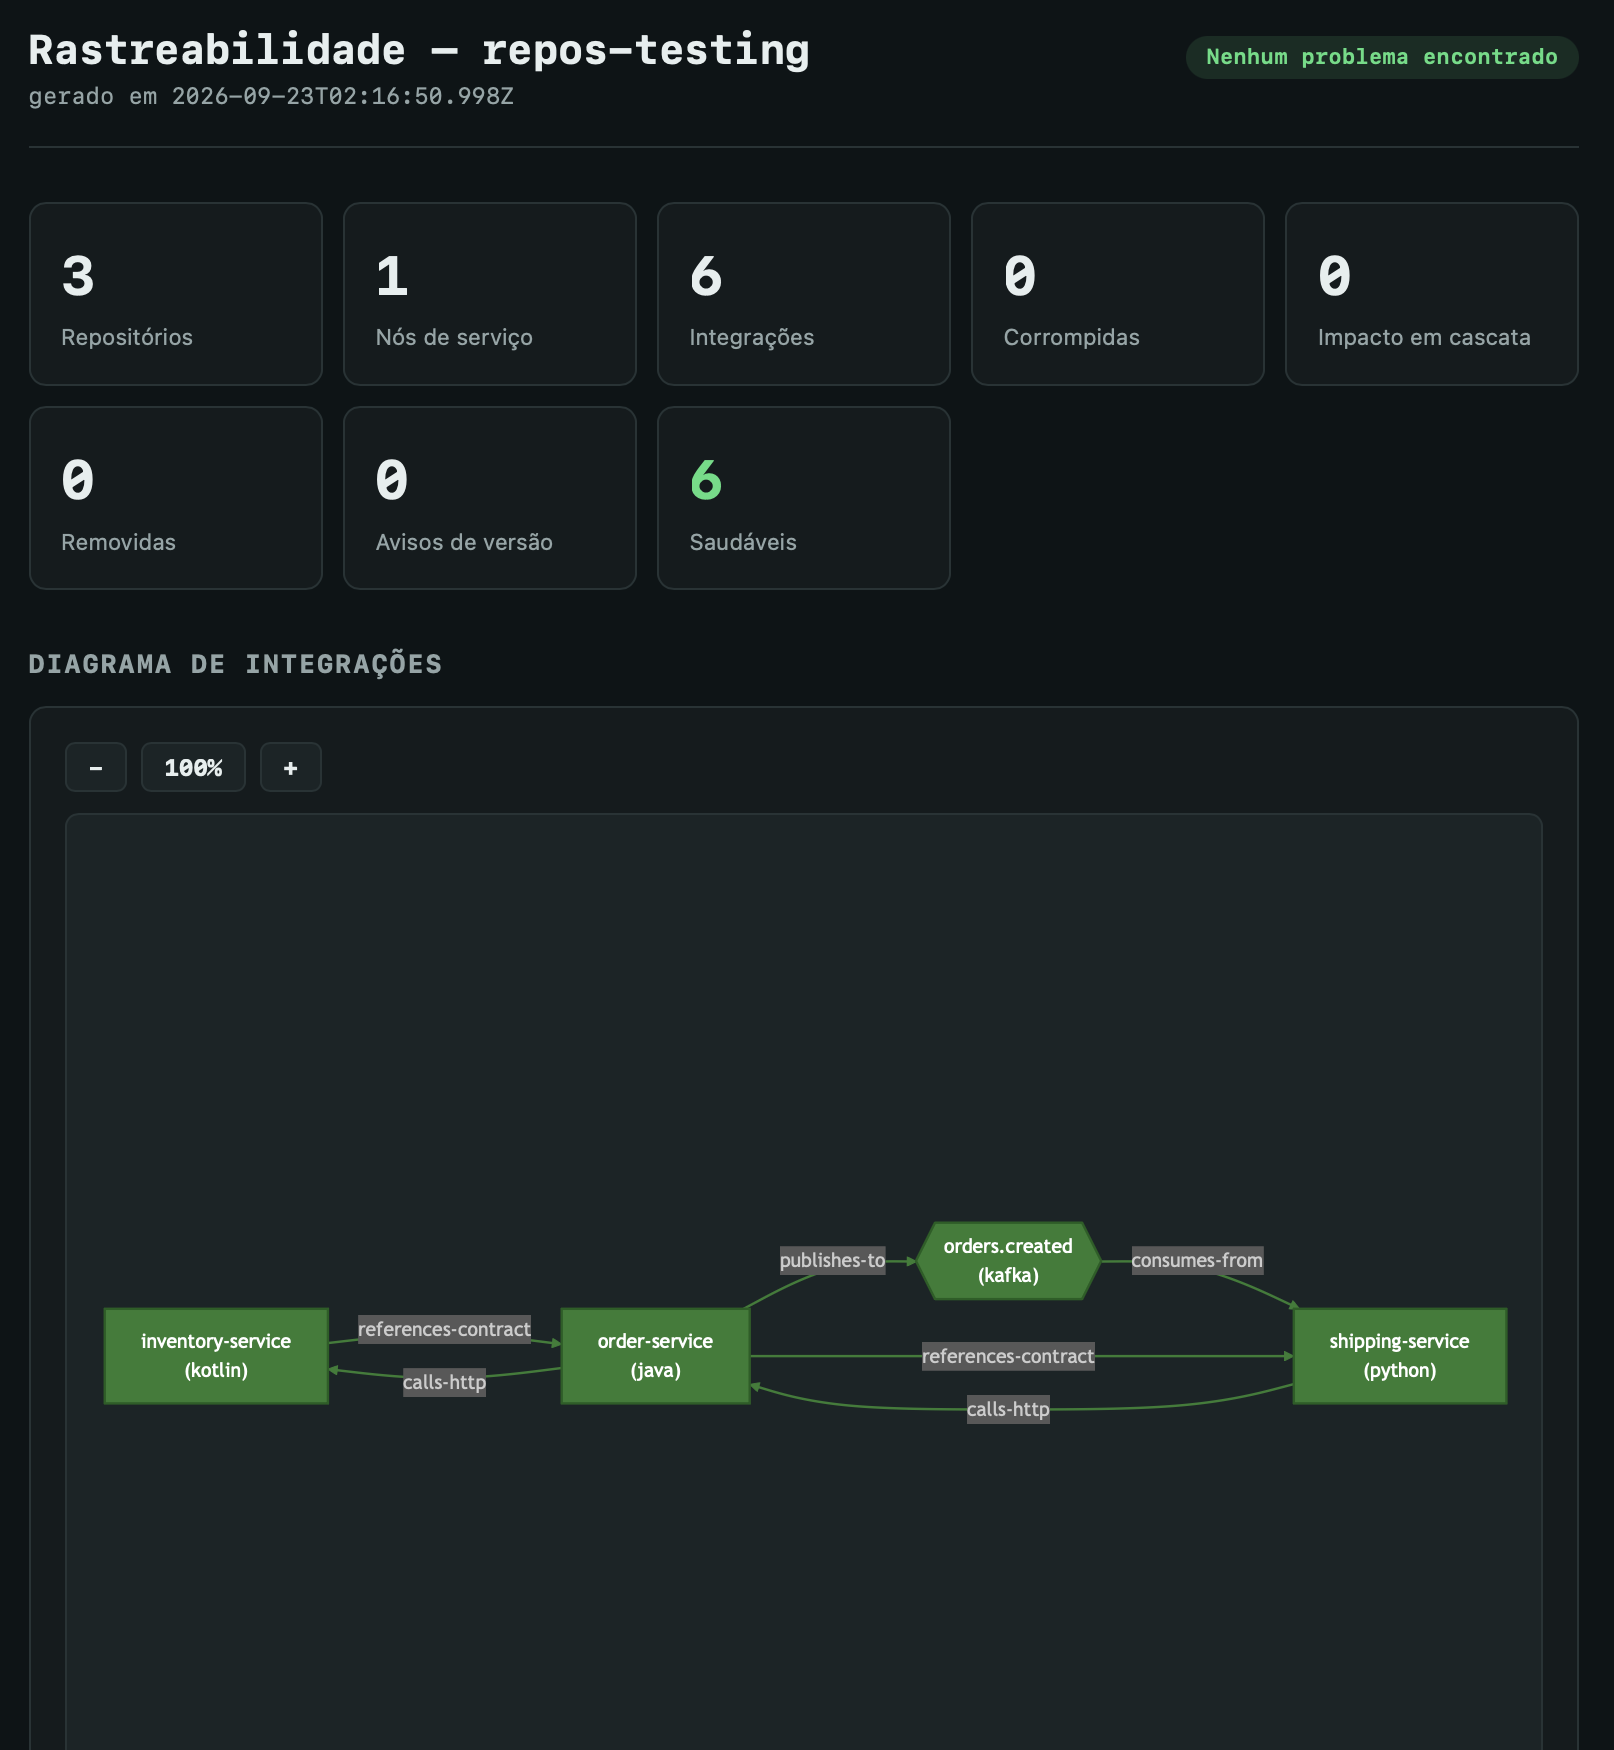
HTML report, same healthy state — the self-contained report for the same 3-repo group shown in the graph view above:
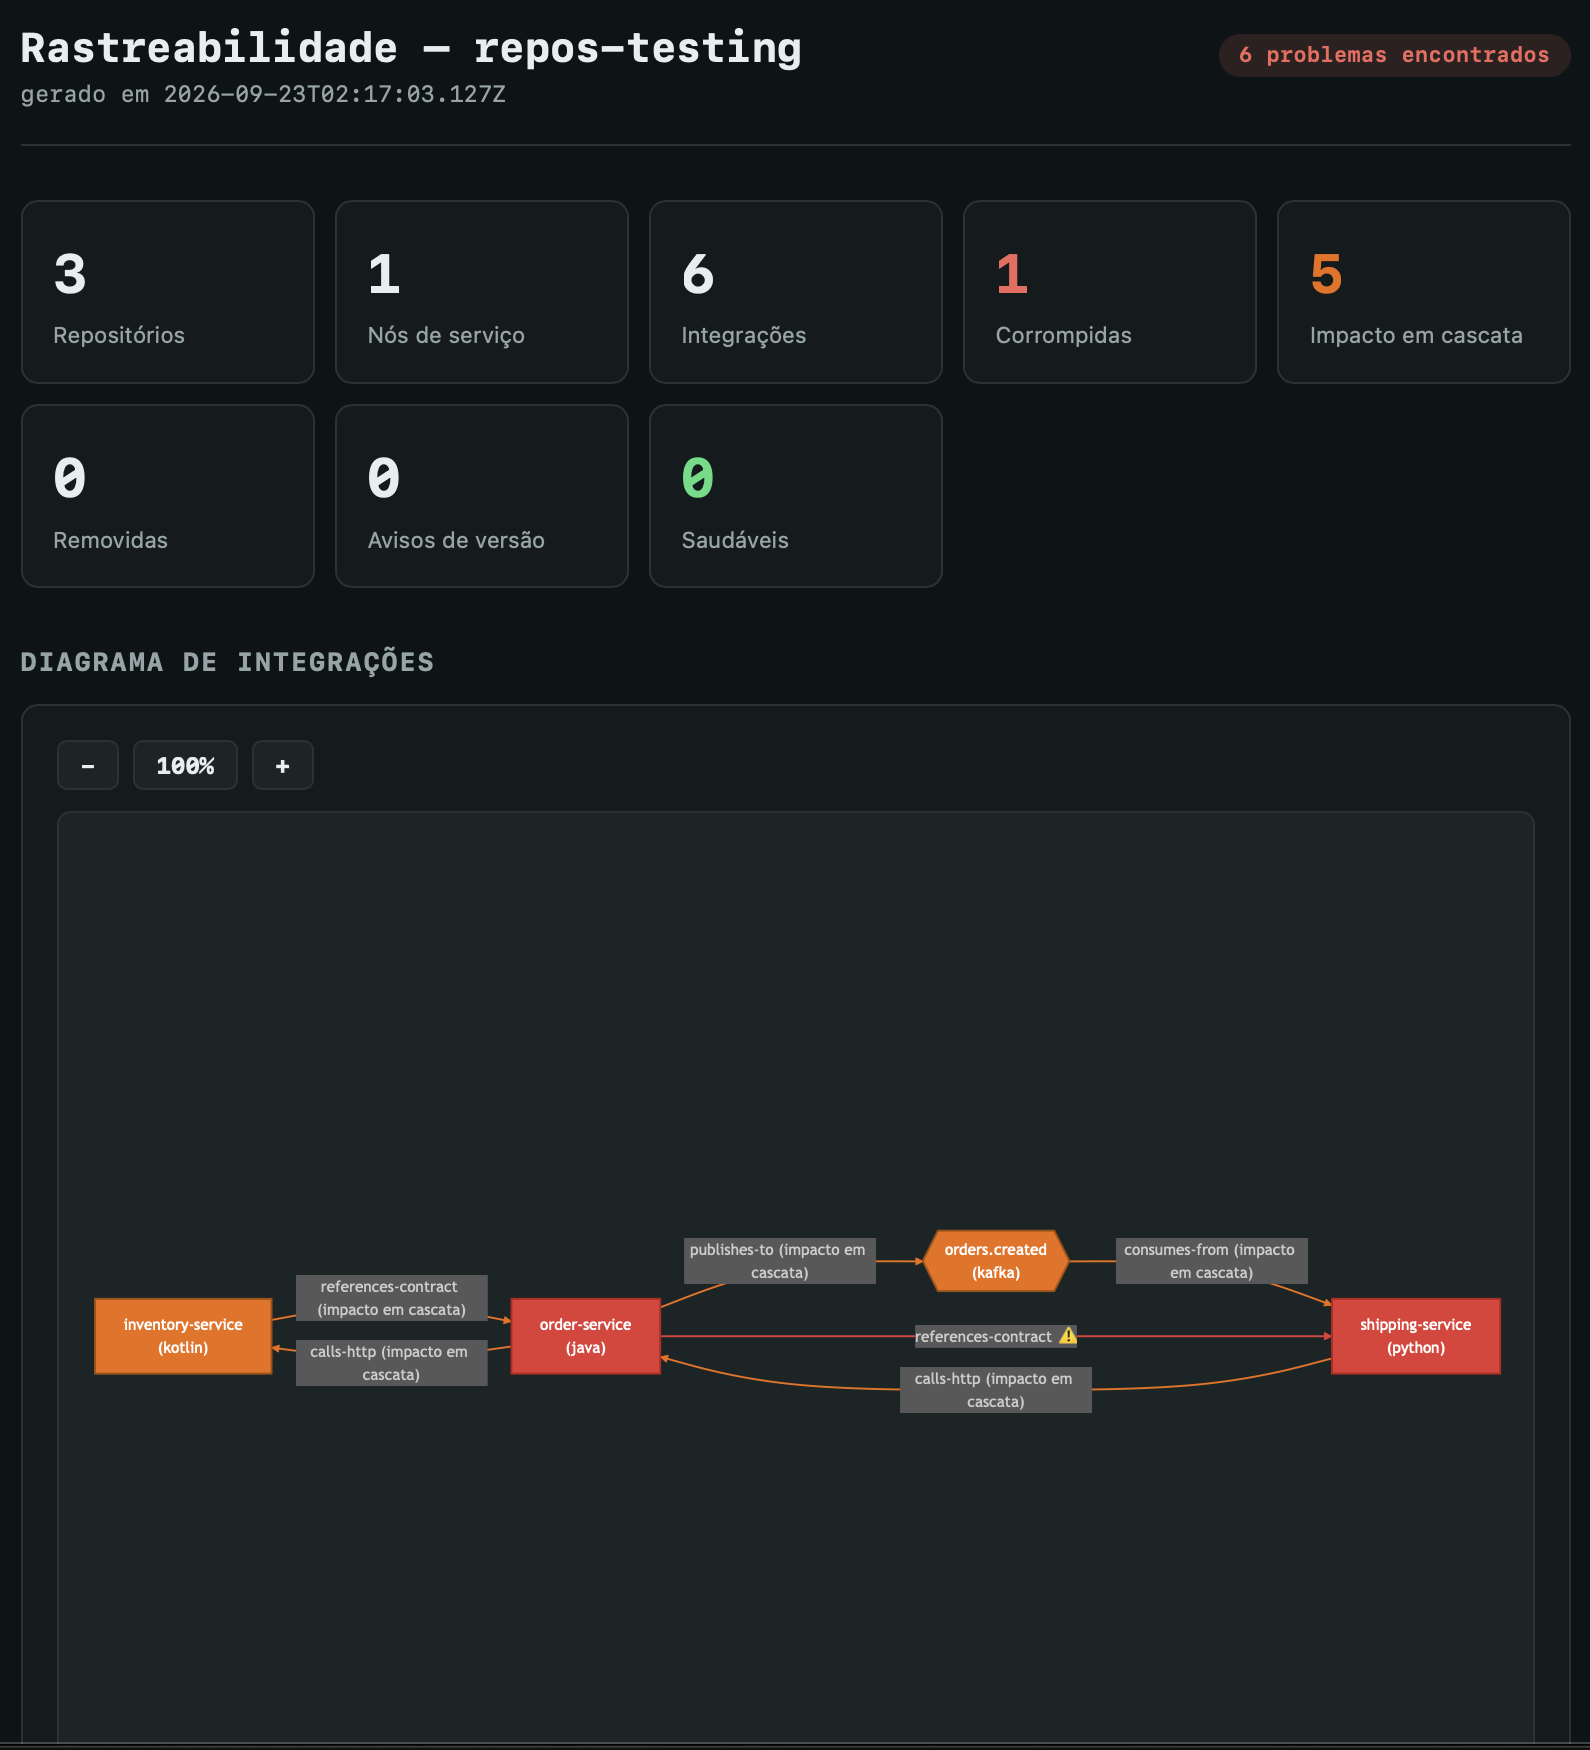
HTML report after the break — the same 3 repos, one broken contract, five integrations now flagged as cascading impact:
Field-level contract diff, in the HTML report — the exact attribute that diverges is highlighted, with each side's declaration on its own line:
Version-change warning, kept separate from real breaks:
The same graph is also written as a full Obsidian vault — a note per
repository, per integration, and per group, with a macro view (index.md) stitching every tracked
project together, so you can browse it interactively instead of only reading a static report.
Install
Requires Node.js 18+.
git clone https://github.com/fecuencas/traceability-agent.git
cd traceability-agent
npm install
npm run build
Make it available globally
npm link
This puts two commands on your PATH: traceability-agent-mcp (the MCP server itself) and
traceability-agent (a standalone CLI, useful for CI/pre-commit — see below). Any AI tool on the
machine can now point at traceability-agent-mcp without a hardcoded path into this repo.
Register it with an MCP client
Any MCP-compatible client is configured the same general way — a JSON block naming the command to launch over stdio:
{
  "mcpServers": {
    "traceability-agent": {
      "command": "traceability-agent-mcp"
    }
  }
}
Where that JSON lives depends on the client:
| Client | Config location |
|---|---|
| Claude Code | claude mcp add --scope user traceability-agent -- traceability-agent-mcp |
| Claude Desktop | claude_desktop_config.json (Settings → Developer → Edit Config) |
| Cursor | .cursor/mcp.json (project) or ~/.cursor/mcp.json (global) |
| Windsurf | ~/.codeium/windsurf/mcp_config.json |
| Other MCP clients | Check the client's docs for its mcpServers-style config file |
Didn't run npm link? Use an absolute path instead of the bare command:
"command": "node", "args": ["/absolute/path/to/traceability-agent/dist/server.js"].
Getting started (first run)
Once the server is installed and registered (see Install above), here's the whole flow for a brand-new group of repositories:
- Open a terminal in the folder that contains the repositories you want to track — the
parent folder, not one specific repo. If
repo-a/,repo-b/andrepo-c/are siblings under~/projects/my-system/, that's where youcdto. - Ask your AI assistant to map the integrations — something like "map the integrations
between the repos in this folder". If your client supports it, this repo ships a Claude Code
Skill (
~/.claude/skills/traceability/SKILL.md) that knows exactly which tools to call and in what order, so a plain-language request is enough. Behind the scenes it runsscan_repositoryon each folder to detect language/build system/coordinates on its own — you don't type those by hand. - No
.traceability/config.jsonyet? The assistant creates one at the root of that folder. Doing it by hand works too — see the format in Using it in a project below. Add"endpoints"to a repo's entry if another repo in the group calls it over HTTP. - Run the first scan: ask for "update the graph" (
update_obsidian_graphunder the hood). This resolves the real integrations between the repos and writes the vault notes. - Look at the result — two options, pick whichever you have set up:
- Open the vault in Obsidian — by default it's the shared vault at
~/ObsidianVaults/traceability-vault/(see Using it in a project) — and switch a note to Reading mode to see the colored diagram. - Or skip Obsidian entirely: ask for "generate the HTML report"
(
generate_html_report) — a self-contained.htmlyou can just open in a browser (the screenshots above are exactly this).
- Open the vault in Obsidian — by default it's the shared vault at
- From then on, day to day:
- Changed something in one of the repos and want to know what it affects? "analyze the impact
of this change in repo-a" (
analyze_impact). - Want the graph/report refreshed after new commits? Ask for "update the graph" again — it's safe to re-run any time, it always reflects the current state of the source code.
- Changed something in one of the repos and want to know what it affects? "analyze the impact
of this change in repo-a" (
Installing and registering the server (above) is one-time setup for the whole machine; steps 1–6 here repeat for every new group of repositories you want to track.
Using it in a project
The agent keeps no project state of its own — each project/monorepo that groups the repos to be
tracked gets its own .traceability/config.json at its root:
{
  "groupId": "my-system",
  "repos": [
    { "id": "repo-a", "path": "./repo-a", "language": "java", "buildSystem": "maven", "coordinates": ["com.example:repo-a"] },
    { "id": "repo-b", "path": "./repo-b", "language": "node", "buildSystem": "npm", "coordinates": ["repo-b"] }
  ]
}
path is relative to the folder that contains .traceability/. Tools resolve this file relative
to the current working directory by default, or accept an explicit configPath. Graph state
(snapshots used for impact diffing) lives in .traceability/state/ inside the tracked project
itself — never inside this package.
groupId and every repos[].id must match ^[A-Za-z0-9][A-Za-z0-9._-]*$ — letters, digits, .,
_ and -, starting with a letter or digit. They're rejected otherwise, because both end up as a
file/folder name inside the vault (Repos/<groupId>/<repoId>.md); the same check applies to
repoId inside a .traceability/manifest.json (see manifestPath/manifestsDir below), which is
the more sensitive case since that file can be published by a sibling repo you don't control.
By default every group's notes go into one shared Obsidian vault
(~/ObsidianVaults/traceability-vault/), so you keep a single Obsidian window open and it stays
current with whatever project you last scanned — Obsidian only ever shows one fixed vault folder
per window, with no concept of "follow whatever folder was last active," so this is what lets the
same window show any project without you manually switching vaults each time. A lightweight index
at ~/.traceability-agent/registry.json remembers which projects have been scanned (updated on
every update_obsidian_graph) — that's what the cross-project macro view (index.md) is built from.
Two groups never mix, even in the same vault: repo/service/integration notes live under their own
per-group folder (Repos/<groupId>/<repoId>.md, and likewise for Services//Integrations/), so
two independent groups that happen to reuse the same id (two different systems each with an
order-service, say) never collide — they're simply different files. As a second line of defense,
the agent also refuses to overwrite any note whose frontmatter says it belongs to a different group
than the one currently being written (reported back as a collisions entry in the tool's response)
— this only matters for the residual case of two unrelated configs picking the exact same groupId
string.
Giving a project its own vault (opt-in)
Add "vaultPath": "./vault" (resolved relative to the folder that contains .traceability/) when
you deliberately want to isolate one project — a client engagement you don't want appearing
alongside anything else, for example. That project's Obsidian window then only ever shows that one
system; you lose the shared macro view for it, and switch vaults manually in Obsidian to look at it
next to others.
Beyond this fully-centralized form, a group can also be described from manifests each repository
publishes on its own (manifestPath/manifestsDir) — no need for every repo to be checked out on
the same machine. See docs/decentralized-config.md.
Shortening long repo names in Obsidian's native Graph View (opt-in)
Obsidian's own Graph View (Cmd+G, the canvas with colored dots — as opposed to the Mermaid
diagrams embedded in notes and the HTML report) always labels a node with the file name behind
it, with no built-in way to truncate or alias that label. If your repos share a long naming
convention (acme-platform-payments-checkout-service, say), every node there ends up that long —
the Mermaid diagrams aren't affected (they always show the full repo id in the node text, on
purpose) and need no configuration for this.
Two independent, combinable knobs control the file name only — repoId itself stays
unabbreviated everywhere else (frontmatter, note content, diagrams, the graph/cascade logic,
snapshot diffing between scans):
{
  "groupId": "my-system",
  "maxRepoNameLength": 24,
  "repos": [
    { "id": "acme-platform-payments-checkout-service", "path": "./checkout", "coordinates": ["..."] },
    { "id": "acme-platform-payments-webhook-service", "path": "./webhook", "coordinates": ["..."], "displayName": "webhook" }
  ]
}
maxRepoNameLength(group-level): anyrepos[].idlonger than this is truncated to that length and suffixed with a short, stable hash of the full id (e.g.acme-platform-payments-c-3f9a2b.md) — the hash guarantees two ids that only diverge after the cutoff (common with a shared long prefix) never collide on the same file, without a second pass to detect duplicates.repos[].displayName(per-repo, takes priority overmaxRepoNameLengthfor that repo): pick the file name yourself — same character rules asid. Use this where you want a specific, memorable short name ("webhook"above) rather than an automatic truncation.
Changing either between scans renames the note's file — the old file is left behind in the
vault (not deleted automatically), same as changing groupId/repoId itself would.
Tools exposed over MCP
| Tool | What it does |
|---|---|
scan_repository |
Analyzes one repository in isolation, returns its detected integration signals |
map_integrations |
Resolves the whole group's graph (repos + edges) without touching the vault |
update_obsidian_graph |
Scans the group and writes/updates the Obsidian vault notes |
analyze_impact |
Diffs the current graph against the last saved snapshot for one repo, computes blast radius |
generate_impact_report |
Writes a Markdown impact report and annotates the affected integration notes |
generate_html_report |
Writes a self-contained HTML report (the screenshots above) |
generate_regression_tests |
Generates smoke tests for published_artifact_dependency integrations (JUnit5, Java/Kotlin so far) |
generate_overview_graph |
Regenerates just the cross-project macro view |
Standalone CLI
MCP is how another AI tool talks to the agent — it's optional, not a requirement to use this at all. Every day-to-day flow is also available straight from the terminal, no AI/MCP client in the loop, useful for CI, a pre-commit hook, or just working locally:
traceability-agent scan . --repo-id my-repo                # analyze this repo alone, write manifest.json
traceability-agent update-graph [--config <path>] [--vault <path>]   # scan the group, write/update the vault
traceability-agent html-report [--config <path>] [--vault <path>]    # self-contained HTML report
traceability-agent impact --repo-id my-repo [--no-persist]           # diff + blast radius for one repo
traceability-agent impact-report --repo-id my-repo                   # write the Markdown impact report
Each subcommand calls the exact same underlying function as its MCP tool counterpart (see
src/tools/*.ts), so the CLI never drifts from what the agent does when an AI calls it. scan
analyzes the given path alone (no knowledge of sibling repos) and writes .traceability/manifest.json
— one building block of the decentralized/manifest-based setup above; the rest assume the current
directory is a tracked group's root (or --config pointing at one).
Supported languages
| Language | Build system |
|---|---|
| Java | Maven |
| Kotlin | Gradle |
| Node.js / TypeScript | npm |
| Python | pip |
| Ruby | Bundler |
| C++ | CMake |
| Go | Go modules |
| C# / .NET | *.csproj |
| PHP | Composer |
| Rust | Cargo |
Each adapter detects the same signal types regardless of language: published artifact dependencies,
outbound HTTP calls, queue publish/consume, shared API contracts (OpenAPI/Swagger/.proto/.avsc),
and config-declared endpoints. Adding a new language follows
docs/adapter-authoring-guide.md.
Project structure
src/
├── server.ts        # MCP server entrypoint (stdio transport)
├── cli/              # standalone CLI (npm-linked as `traceability-agent`)
├── tools/            # one file per MCP tool, see table above
├── adapters/         # one analyzer per language/ecosystem
├── graph/            # graph construction, integrity checks, contract diffing, snapshot (de)serialization
├── obsidian/          # vault note generation (repo, integration, group, macro overview)
├── reports/           # self-contained HTML report
├── impact/            # snapshot diffing, blast radius
├── testgen/           # regression test generation
├── springboot/        # local (single-repo) findings: Spring Boot wiring/annotation checks
└── config/            # project config + global registry resolution
Testing
npm test
Own test suite (node:test, no extra dependency), colocated with each module
(src/<area>/<file>.test.ts). Covers real bugs found and fixed during development — a sibling
group-id collision, directional cascade propagation, blast radius, service-node dedup across
cross-technology publishers/consumers, service nodes reconstructed when an infra resource
disappears from a scan, regex false-positives on a stub's own declaration, the OpenAPI field-level
diff described above, a path-traversal attempt via a malicious groupId/repoId (config or
manifest) rejected before it can write outside the vault, and the Spring Boot wiring checks (a
real @Value("${...:(default)}")-style annotation value with parens/braces inside a string
literal, which a naive brace-counting parser would misread as unbalanced).
Security
Found a security issue? See SECURITY.md for how to report it.
Contributing
See CONTRIBUTING.md for how to build, test, and open a PR.
License
Copyright (c) 2026 Fernando Cuencas
This project is licensed under the MIT License. See the LICENSE file for details.
traceability-agent MCP questions
What tools does traceability-agent MCP provide?
It exposes 8 tools, including scan_repository, map_integrations, update_obsidian_graph, analyze_impact, generate_impact_report.
What kind of integration breakage does it detect?
It detects cross-repo API contract breakage by diffing OpenAPI/Swagger files, broken artifact dependencies, and cascading impacts across services.
Does it require running builds or tests to find errors?
No, the agent detects breakage statically without requiring any builds or tests to be executed.
Can it detect Spring Boot configuration errors?
Yes, it can identify local Spring Boot wiring bugs like missing annotations or incorrect component scanning.