
WireBuddy MCP server
Commit Nov 14, 2026A collaborative Wireshark-style packet viewer that allows an AI agent to analyze traffic, write Lua dissectors, and create custom data visualization panels.
Also known as dngames/wirebuddy
- Stars
- 5
- Tools
- 25
- Downloads, 30 days
- —
- Latest version
- —
- Last commit
- Nov 14, 2026
- License
- MIT
What is WireBuddy MCP?
WireBuddy is a collaborative Wireshark-style packet viewer that allows an AI agent to analyze traffic, write Lua dissectors, and create custom data visualization panels. It exposes 25 tools, such as viewer_url, get_view_state, open_capture.
Summary generated from the project's README
About WireBuddy MCP server
Collaborative network traffic analysis is what WireBuddy enables by providing a shared browser-based packet viewer for you and an AI agent. Designed for developers and network engineers, it allows an agent to interact with live captures or pcapng files through MCP. While you observe the packet list, details, and hex bytes, the agent can apply filters, add marks, and select specific packets to investigate.
This tool differs from standard command-line MCP servers because it offers a visual interface where the agent can actively extend the viewer's capabilities. If the agent encounters unknown protocols, it can write and test Lua dissectors to decode the data. It can also create custom sandboxed panels to plot or visualize capture data like point clouds or time-series fields. The system uses the Wireshark sharkd engine to ensure decoding matches the desktop application, and it supports TLS decryption via SSLKEYLOGFILE. It requires Node.js 22 and Wireshark 4.6 to function on Linux or macOS.
What you can do with it
- 1Decode proprietary protocolsAsk the agent to write a Lua dissector for a custom sensor stream that currently only appears as raw data.
- 2Investigate network latencyDirect the agent to find specific timing delays in a protocol to identify where commands are losing time.
- 3Analyze selected packet groupsSelect a range of packets and ask the agent to explain the issues found within that specific selection.
Written from the project's README. Every use case is checked against a quote from it.
WireBuddy MCP tools 25
Detected from the READMEviewer_urlget_view_stateopen_capturecapture_summaryquery_packetsinspect_framefollow_streamexpert_infoio_graphexport_packetswrite_findingsexport_objects
| viewer_url | — | |
| get_view_state | — | |
| open_capture | — | |
| capture_summary | — | |
| query_packets | — | |
| inspect_frame | — | |
| follow_stream | — | |
| expert_info | — | |
| io_graph | — | |
| export_packets | — | |
| write_findings | — | |
| export_objects | — |
Show all 25 toolsShow fewer tools
check_display_filterset_display_filtergoto_frametime_referencespacket_commentsset_columnsdecode_aslist_interfacesstart_capturestop_captureopen_in_wiresharkextensionspanel
| check_display_filter | — | |
| set_display_filter | — | |
| goto_frame | — | |
| time_references | — | |
| packet_comments | — | |
| set_columns | — | |
| decode_as | — | |
| list_interfaces | — | |
| start_capture | — | |
| stop_capture | — | |
| open_in_wireshark | — | |
| extensions | — | |
| panel | — |
Automated checks
Ran Nov 14, 2026Full report →Not verified yet. A server needs a score of 80, no serious finding, and enough data for us to check. How checks work · What to fix for more points

- Source repository linked and reachabledngames/wirebuddy is public and reachablegithub.com/dngames/wirebuddy ↗Pass
- Package names this repository as its sourceNot checked
- Build provenance (Sigstore attestation)Not checked
- Open source license (OSI)MITspdx.org/licenses/MIT.html ↗Pass
- Commit or release in the last yearLast commit or release 2026-11-13github.com/dngames/wirebuddy ↗Pass
- OpenSSF ScorecardNot checked
- Package name not close to a popular packageNot checked
- No critical advisory in the package or its dependenciesNot checked
- No hidden instructions to the model25 tool descriptions and the README read; no override phrases, credential paths or hidden charactersPass
- Destructive tools are labelledNo tool named like delete, drop or execPass
- Remote endpoint answers the MCP handshakeNot checked
README
View on GitHubWireBuddy


You and your AI agent, looking at the same packets.
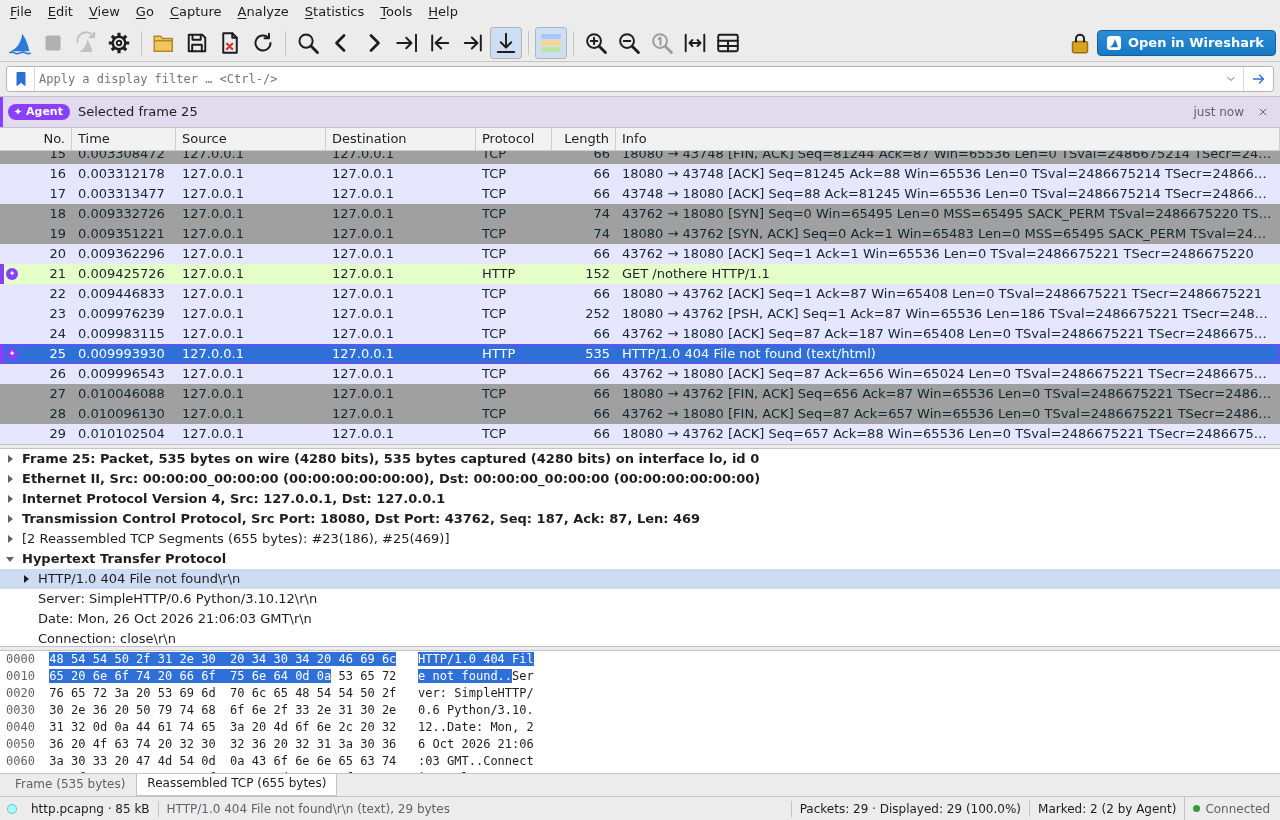
WireBuddy is a Wireshark-style packet viewer in a browser tab, built to sit next to an AI chat (for example in the Claude Code desktop app's browser pane). The agent works the viewer over MCP while you watch and click in the same view, and when a capture holds something Wireshark can't decode or a packet list can't show, the agent extends the viewer itself.
- One view for both of you. The agent's filters, selected packet, marks, comments and columns show up in your view as it works, each with a notice; what you do there (open a file, apply a filter, start a capture) reaches the agent with its next call, and it sees which packets you selected. Right-click packets to ask the agent about them without leaving the view. You check its findings in the packets instead of taking a summary on trust. When you want the result written up, the agent marks and comments the packets that carry it and writes a findings report.
- The agent extends the viewer. Traffic Wireshark doesn't know, such as a company's sensor stream or a game's protocol, shows up as "Data". The agent writes a Lua dissector for it from the bytes or a spec, tests it against the open capture and reloads the view, which then decodes the new protocol, with fields you can filter on and show as columns. When rows aren't enough, it writes a panel: a sandboxed page next to the packets that plots, plays or draws what's in the capture (images, video, point clouds, a field over time).
- Wireshark's own decoding. Everything is dissected by Wireshark's engine (
sharkd), with your plugins and preferences (and a profile you choose), so results match Wireshark; Open in Wireshark jumps to the real GUI at the same file, filter and packet. When a protocol Wireshark knows runs on a port it doesn't expect, Decode As (a right-click, or one call from the agent) decodes it without a dissector. - Live captures the agent can run. The agent starts and stops captures with
dumpcapand reads them as they grow; so can you, with a Capture Options dialog like Wireshark's.
The viewer itself works like Wireshark:
- Packet list, details and bytes with Wireshark's menu bar, toolbar and keyboard shortcuts: coloring rules, a display filter bar with live validation and field autocompletion, linked tree and hex highlighting, custom columns ("Apply as Column"), time references the Time column counts from, Find Packet, packet history, zoom.
- Follow Stream like Wireshark's window (TCP, UDP, TLS, HTTP and more), and several packets selected with Ctrl+click and Shift+click to mark, copy or export them; the agent sees the selection too, so you can ask "what's wrong with these packets?".
- Statistics: Expert Information, I/O Graph, protocol hierarchy, conversations and endpoints, optionally limited to the display filter.
- TLS decryption with a key log file (
SSLKEYLOGFILE), and Export Specified Packets (displayed, marked, selected or a range) to a new pcapng/pcap; in pcapng the marks and their notes go along as packet comments, which Wireshark shows. - Export Objects as in Wireshark's File menu: list the files carried in HTTP, email (IMF), SMB, TFTP, DICOM and FTP traffic, go to their packets, and save them, each save into a new folder; the agent hears where, so you can ask it about them.
- Packet comments as in Wireshark's Edit › Packet Comments: add, edit and delete them, for you and the agent alike; the packet list marks commented packets, and pcapng exports (Save As) write the comments as edited.
- The investigation stays with the capture: marks with their notes, time references and packet comments edited in the viewer are kept in WireBuddy's data folder and come back when you open the capture (or a copy of it) again, also after another capture or a restart; File › Forget Kept Marks and Comments… goes back to what the capture file holds.
- A findings report: File › Write Findings Report… (or the agent's
write_findings) writes what an investigation found as one Markdown file: your or the agent's summary, the capture's facts, a table of the marked packets with their notes, and the packets with comments, in the rules of an export (a new.mdfile); text from the capture is written escaped, so it reads as text and renders as nothing else. - Live capture with traffic sparklines per interface, promiscuous mode, a capture filter checked as you type, new files automatically, a ring buffer and stop conditions; the view updates about once a second.
How it compares
Several MCP servers give an agent packet data through Wireshark's command-line tools, for example
Wireshark MCP and
WireMCP. They are the better fit when the agent works on its
own: they run wherever tshark runs (macOS, Windows and Linux, also headless on a server),
Wireshark MCP installs and registers itself with one pip command, they capture live traffic too,
and they bring ready-made analyses WireBuddy doesn't have, such as security and anomaly checks,
threat-intelligence lookups, credential extraction and capture indexes.
WireBuddy is for working on a capture together with the agent:
| tshark-based MCP servers | WireBuddy | |
|---|---|---|
| What you see | the agent's answer, in Wireshark MCP with frame references and tshark commands to re-check it |
the packets, with the agent's filters, marks and selected packet in your view |
| Protocols Wireshark doesn't decode | stay "Data" unless you install a dissector yourself (Wireshark MCP offers Decode As for protocols Wireshark has) | Decode As for protocols Wireshark has (a right-click or one agent call); Lua dissectors the agent writes, tests and loads for the rest |
| Beyond packet rows | text and JSON for the agent | panels the agent writes: plots, images, video, point clouds |
| Ready-made analyses | many, from statistics to threat intelligence | Wireshark's statistics and expert info |
| Where it runs | anywhere tshark runs, headless too |
Linux with a browser, Wireshark 4.6 and Node.js 22 (macOS is verified only in CI on a hosted runner, not by hand, and Windows is untested; extensions and panels need Linux, or macOS where the same checks are made) |
(Compared with what those projects describe in their READMEs, October 2026.)
Requirements
-
Wireshark 4.6 with
sharkd,editcapandmergecap(Debian/Ubuntu packagewireshark-common); thewiresharkpackage too for "Open in Wireshark". Older versions are untested, and Ubuntu 22.04 and 24.04 ship 3.6 and 4.2, so take the Wireshark PPA there:sudo add-apt-repository ppa:wireshark-dev/stable sudo apt install wireshark-common wireshark -
For live capture,
dumpcapmust be allowed to capture as your user:sudo dpkg-reconfigure wireshark-common # answer "Yes" sudo usermod -aG wireshark $USER # then log out and in againOn macOS it needs read access to
/dev/bpf*, which Wireshark's ChmodBPF sets up. -
Node.js ≥ 22
Developed on Ubuntu 22.04 with Wireshark 4.6.6; CI runs on Ubuntu 24.04 with the current stable Wireshark from the PPA. Other Linux distributions should work; macOS, live capture included, was verified only in CI on a hosted runner, not by hand; Windows is untested.
Install and run
npm install -g wirebuddy
wirebuddy                      # prints the UI URL, e.g. http://127.0.0.1:8765/?token=…
wirebuddy path/to/capture.pcapng   # open a file right away
npx wirebuddy runs it without installing. From a clone of the repository:
npm install && npm run build
npm start
Options (--help shows the same):
| Option | Environment | |
|---|---|---|
--port <n> |
WIREBUDDY_PORT |
HTTP port on 127.0.0.1 (and ::1); default 8765, falls back to a free one |
--token <t> |
WIREBUDDY_TOKEN |
session token, at least 16 characters; default random. Prefer the variable: other local users can see command lines in ps |
--capture-dir <dir> |
WIREBUDDY_CAPTURE_DIR |
where live captures go; default ~/.local/share/wirebuddy/captures |
--profile <name> |
WIREBUDDY_PROFILE |
Wireshark configuration profile for dissection and Open in Wireshark |
--tls-keylog <file> |
decrypt TLS with this key log file | |
WIREBUDDY_EXTENSIONS |
more folders of extensions, separated by : |
|
--mcp |
also serve MCP over stdio; logs go to stderr | |
--watch <file> |
wait for the next problem or question in a running viewer, print it, exit (see below) | |
--version |
print the version |
TLS decryption
Start the program whose traffic you want to read with SSLKEYLOGFILE set, e.g.
SSLKEYLOGFILE=~/tls-keys.log firefox
then choose that file under Tools → TLS Keys… in WireBuddy (or start WireBuddy with
--tls-keylog ~/tls-keys.log). The capture is re-dissected, HTTP/2, HTTP and other protocols
inside TLS become visible, and "Open in Wireshark" passes the key log on. A key log file set in
Wireshark's own preferences is picked up automatically. The agent can see whether decryption is
on, but only you choose the file. Treat the key log like a password.
Decode As
A protocol Wireshark knows, on a port it doesn't expect (RTP on UDP port 50000, MQTT on TCP port
18830), shows up as "Data" or as the wrong protocol. Right-click one of its packets and choose
Decode As › UDP Port 50000…, then the protocol by its display-filter name (rtp, mqtt,
dns); data shows the raw bytes. The status bar lists the entries and removes them, and the
agent's decode_as tool does the same in one call.
Entries apply to every capture you open until WireBuddy exits and win over your profile's Decode As for the same port; WireBuddy never writes your Wireshark profile. Decode As needs what extensions need: Linux, or macOS where the same checks are made (verified in CI on a hosted runner, not by hand).
Extensions
Wireshark decodes thousands of protocols, but not your company's sensor stream or a game's
network protocol: those show up as "Data" (a protocol Wireshark knows on another port needs no
extension: see Decode As). Ask the agent to decode them. It finds the undecoded
traffic (capture_summary lists it), works out the format from the bytes or from a spec you give
it, and writes a Lua dissector into WireBuddy's extension folder:
~/.local/share/wirebuddy/extensions/<name>/
  extension.json    {"label": "ACME telemetry", "version": "1", "description": "…"}
  acme.lua          a Wireshark Lua dissector
It tests the extension against the open capture in a separate sharkd first, then reloads the
view, which decodes the new protocol: its fields appear in the details tree, in filters and
autocompletion, as columns and in "Open in Wireshark". Problems come back to the agent: Lua that
doesn't load, dissectors failing on some packets (with the frame and line), endless loops (stopped
after a second), an extension that crashes sharkd (switched off when it crashes while loading;
the view keeps its previous extensions when one crashes while reading the capture).
Analyze › Extensions… lists the extensions with their status and switches them on and off;
Analyze › Reload Lua Plugins (Ctrl+Shift+L) loads them again after you edited one. You can
write extensions yourself the same way, or share a folder of them with WIREBUDDY_EXTENSIONS.
Extensions are Lua code that runs as you, with access to your files. WireBuddy only loads extensions no other user could have changed (see SECURITY.md): a shared team folder that colleagues can write is ignored, and so is a folder on a network or FUSE filesystem, where that can't be checked. Only let an agent write extensions if you would let it run commands, and look at what it wrote. Extensions need Linux, or macOS where the same checks are made (verified in CI on a hosted runner, not by hand); there a group-writable entry, or one whose ACL lets anyone else change it, counts as writable by others, and only local APFS or HFS+ volumes that keep ownership are looked into.
Panels
An extension can also bring a panel: a small web page of its own (panel/main.js, plus
optional HTML, CSS and further modules) that WireBuddy shows in a window next to the packets and
feeds with the open capture, also during a live capture: images or files in the traffic, video,
point clouds, a field over time. The agent writes one when a picture says more than packet rows,
checks it (extensions action "test" finds syntax errors with file and line), opens it with the
panel tool and gets told whether it started, what it shows and every error it throws;
panel action "snapshot" gives it an image of the panel.
You open panels under View › Panels or in Analyze › Extensions. An extension can offer its
panel for captures it fits ("offer": {"filter": "rtp", "text": "Play the video"}): the offer
shows as a chip in the status bar that opens the panel, or with × goes away for that capture. A
panel can select a packet in your view, and with the "control" permission apply a display
filter, but only right after you clicked or typed in it. It can keep up to 256 KiB of JSON
(wb.storage) across restarts. Examples to copy from are in
examples/extensions.
Each panel runs sandboxed on a one-time origin of its own (p<random>.localhost), in its own
browser process, and gets only its own files and the capture, never WireBuddy's API, its token or
(WebRTC aside) the network. A panel that stops responding is stopped after 20 seconds without
slowing WireBuddy down, and one that tries to navigate is closed; SECURITY.md has
the details.
Dissector plugins and profiles
WireBuddy decodes with sharkd, which loads the same plugins and settings as Wireshark:
- C plugins from the global folder (e.g.
/usr/lib/x86_64-linux-gnu/wireshark/plugins/4.6/epan) and the personal one (~/.local/lib/wireshark/plugins/4.6/epan). - Lua plugins from the global folder,
~/.local/lib/wireshark/pluginsand~/.config/wireshark/plugins. - Preferences, Decode As, enabled/disabled protocols, coloring rules from
~/.config/wireshark; WireBuddy's own Decode As entries apply on top and win for the same port. - Profiles:
--profile <name>startssharkd(and "Open in Wireshark") with that configuration profile.
A plugin's fields show up in the details tree, can be filtered on, appear in filter
autocompletion, and are visible to the agent through inspect_frame. After changing a Lua
plugin, use Analyze › Reload Lua Plugins; restart WireBuddy after adding a C plugin.
Use with Claude Code
Register the MCP server (it also starts the web UI):
claude mcp add wirebuddy -- npx -y wirebuddy --mcp
That needs node on the PATH Claude Code starts MCP servers with. Where it isn't (Node from
nvm or a folder of your own, Claude Code started from the desktop), install WireBuddy and register
it with full paths:
npm install -g wirebuddy
claude mcp add wirebuddy -- "$(command -v node)" "$(npm root -g)/wirebuddy/dist/server/main.js" --mcp
From a clone of the repository, use its dist/server/main.js the same way. There,
node test/agent-demo.mjs shows what the agent side looks like without Claude: it plays a short
scripted session (filter, mark, select) against the fixture; open the URL it prints.
Claude opens the viewer in the browser pane next to the chat by itself as soon as it starts working with WireBuddy: while no viewer is connected, the tool results remind it, with the URL.
An error you run into in the viewer shows there, attached or not. While Claude is attached it also
hears of it, together with other problems (a file that won't open, a rejected filter, a failed
capture, a crashed sharkd) and what you do in the viewer, with its next WireBuddy tool call; the
status bar counts the problems waiting for it. To react while you work, Claude runs
wirebuddy --watch <instance-file> as a background command: it waits for the next problem or
question, prints it and exits, which wakes Claude.
To ask about packets without switching to the chat, right-click them in the packet list and choose Ask Claude about This Packet… (or Ask Claude about These N Packets…). The question goes to Claude with the packet numbers and wakes it if its watch is running (the dialog says whether it is); otherwise it comes with Claude's next step. Claude answers in the chat.
When you notice something during a live capture (the app froze, a reply was slow, a light flickered), press Now: the flag in the toolbar, or N in the packet list. A tap asks what just happened; holding it flags everything until you let go. Claude gets the packets of that moment or span with no typing (at once if its watch is running), looks at them and shows what it found in your view. The flagged packet, or the span's first and last, also get packet comments ("WireBuddy Now…"), which an export to pcapng keeps. Now works in captures that stay in one file.
Example prompts:
- "Open ~/captures/slow-login.pcapng and tell me why the login is slow."
- "Explain the packet I have selected."
- "Mark all DNS failures and filter to them."
- "Capture on eth0 for a minute and tell me when you see TCP retransmissions."
- "Capture on eth0 while I reproduce the freeze; I'll press Now when it happens."
- "Save the files that were downloaded over HTTP and check them against these hashes."
Example: a robot arm that stutters
examples/investigations/robot-arm is an investigation to
try, all on your machine over loopback: an emulated arm controller and the control app that drives
it. The app should send the controller 50 commands a second but gets about 22 through, and the
arm moves in jerks, while the controller's vendor says it answers in under a millisecond.
The robot arm stutters. Our control app, examples/investigations/robot-arm/app.mjs, should send the arm controller 50 MOVE commands a second, but gets about 22 through and the arm moves in jerks. The vendor says the controller answers every command in under a millisecond; their protocol document is examples/investigations/robot-arm/PROTOCOL.md. The controller is running on port 7700. Capture the traffic while the app runs and find out why.
As in the demo above, the agent:
- starts a capture on
lowithstart_capture, runs the app and stops the capture; - finds the controller's protocol undecoded, writes a Lua dissector from the vendor's document, tests it on the capture and reloads the view;
- adds a time-delta column, finds where every command loses its time and marks an example;
- writes a panel that plots the arm's joints and each command's latency;
- names the cause, fixes the app and captures again to show the fix.
The example's README has the setup and, at its
end, the solution; solution/armc is a dissector and a panel as the agent might write them. The
commands there assume a clone of the repository; the npm package has the examples too, in
$(npm root -g)/wirebuddy/examples after a global install.
Example: a CT archive that loses slices
examples/investigations/ct-archive is a second one, from
radiology: an emulated image archive and the reconstruction server's exporter that sends it the CT
images of a head phantom over DICOM. The exporter gets Success for all 184 images, yet the archive
holds only 100 of the 160 images of the thin-slice series, and the archive team says it keeps what
it receives.
Radiologists say our new 0.625 mm thin-slice head series show up in the archive with only about 100 of 160 images, and the reformats have steps; the 5 mm series from the same scan are complete. Our reconstruction server's exporter, examples/investigations/ct-archive/app.mjs, logs every image as stored with status Success. The archive vendor's conformance statement is examples/investigations/ct-archive/CONFORMANCE.md. The archive is running on port 11112. Capture an export and find out where the slices go.
The agent:
- captures on
lowhile the exporter runs; - finds the DICOM decoded by Wireshark itself: 184 C-STOREs, each answered with Success;
- lists the images with
export_objectsand finds 184 of them with only 124 SOP Instance UIDs; - marks the pairs of slices that share a UID and may write a panel that shows the series as sent and as the archive keeps it;
- names the cause, fixes the exporter and, with the archive restarted, captures again: 184 UIDs, and the archive keeps all 160.
The example's README has the setup and the
solution; solution/ctseries is the panel.
WireBuddy MCP questions
What tools does WireBuddy MCP provide?
It exposes 25 tools, including viewer_url, get_view_state, open_capture, capture_summary, query_packets.
How does the AI agent extend the viewer's capabilities?
The agent can write Lua dissectors for unknown protocols or create sandboxed panels to plot, play, or draw data from the capture.
Can I use my existing Wireshark profiles and plugins?
Yes, everything is dissected by Wireshark's engine, supporting your plugins, preferences, and chosen profiles.
Does WireBuddy support live packet captures?
Yes, the agent and the user can both start and stop live captures using tools like dumpcap.
Can I decrypt TLS traffic in WireBuddy?
Yes, you can decrypt TLS traffic by providing an SSLKEYLOGFILE.