
UTM Watch MCP server
Commit Nov 14, 2026Lets an AI client monitor UTM virtual machine performance and diagnose historical resource usage, network latency, and system incidents.
Also known as DarrickBM/utm-watch, utm-watch
- Stars
- 4
- Tools
- —
- Downloads, 30 days
- —
- Latest version
- 0.7.1
- Last commit
- Nov 14, 2026
- License
- MIT
What is UTM Watch MCP?
UTM Watch lets an AI client monitor UTM virtual machine performance and diagnose historical resource usage, network latency, and system incidents.
Summary generated from the project's README
About UTM Watch MCP server
Monitoring UTM virtual machine performance and diagnosing resource issues from within an AI client is what UTM Watch enables. Designed for Mac users running Apple Virtualization or QEMU, this tool provides visibility into CPU, memory, disk usage, and network latency for every VM by name. It helps developers and system administrators distinguish whether performance lag originates from a specific guest, the host Mac, or the local network connection.
The system operates as a local menu bar application on Apple silicon Macs, requiring specific permissions to access UTM files and the local network. It includes a read-only MCP server called utmwatch-mcp that allows agents like Claude Code to query recorded historical data. Users can also organize multiple Macs into a fleet, where a central hub Mac aggregates data from remote machines. This setup allows an AI to analyze incidents across an entire collection of computers using tools like find_incidents, summarize, and get_metrics.
What you can do with it
- 1Diagnose historical VM slownessAsk an AI agent to investigate why a virtual machine was performing poorly at a specific time in the past.
- 2Monitor a fleet of MacsManage and view the status of virtual machines running on several different Macs from a single hub.
- 3Distinguish network lag from VM loadDetermine if connectivity issues are caused by the virtual machine, the host hardware, or the Wi-Fi link quality.
Written from the project's README. Every use case is checked against a quote from it.
Automated checks
Ran Nov 14, 2026Full report →Not verified yet. A server needs a score of 80, no serious finding, and enough data for us to check. How checks work · What to fix for more points

- Source repository linked and reachabledarrickbm/utm-watch is public and reachablegithub.com/darrickbm/utm-watch ↗Pass
- Package names this repository as its sourceNot checked
- Build provenance (Sigstore attestation)Not checked
- Open source license (OSI)MITspdx.org/licenses/MIT.html ↗Pass
- Commit or release in the last yearLast commit or release 2026-11-13github.com/darrickbm/utm-watch ↗Pass
- OpenSSF ScorecardNot checked
- Package name not close to a popular packageNot checked
- No critical advisory in the package or its dependenciesNot checked
- No hidden instructions to the model0 tool descriptions and the README read; no override phrases, credential paths or hidden charactersPass
- Destructive tools are labelledNot checked
- Remote endpoint answers the MCP handshakeNot checked
README
View on GitHubUTM Watch: a VM monitor for UTM on Mac
See what each of your UTM virtual machines is doing, and find out why one was slow.





Install · Features · AI diagnosis · Fleet · How it works
Why UTM Watch
UTM shows whether a VM is on or off. Activity Monitor shows two processes with the same name. Neither tells you which VM is eating the CPU, how close you are to running out of memory, or whether the lag your remote user felt came from the VM, the Mac, or the Wi-Fi. UTM Watch does.
| Question | UTM | Activity Monitor | UTM Watch |
|---|---|---|---|
| Which VM is using the CPU? | No | Process names only | Every VM by name |
| How full is each VM's disk? | No | No | Yes, read from the disk image |
| What happened at 3:12 pm? | No | No | Recorded history you can scrub |
| Was it the VM, the Mac or the network? | No | No | Ping and link quality next to VM load |
Features
-
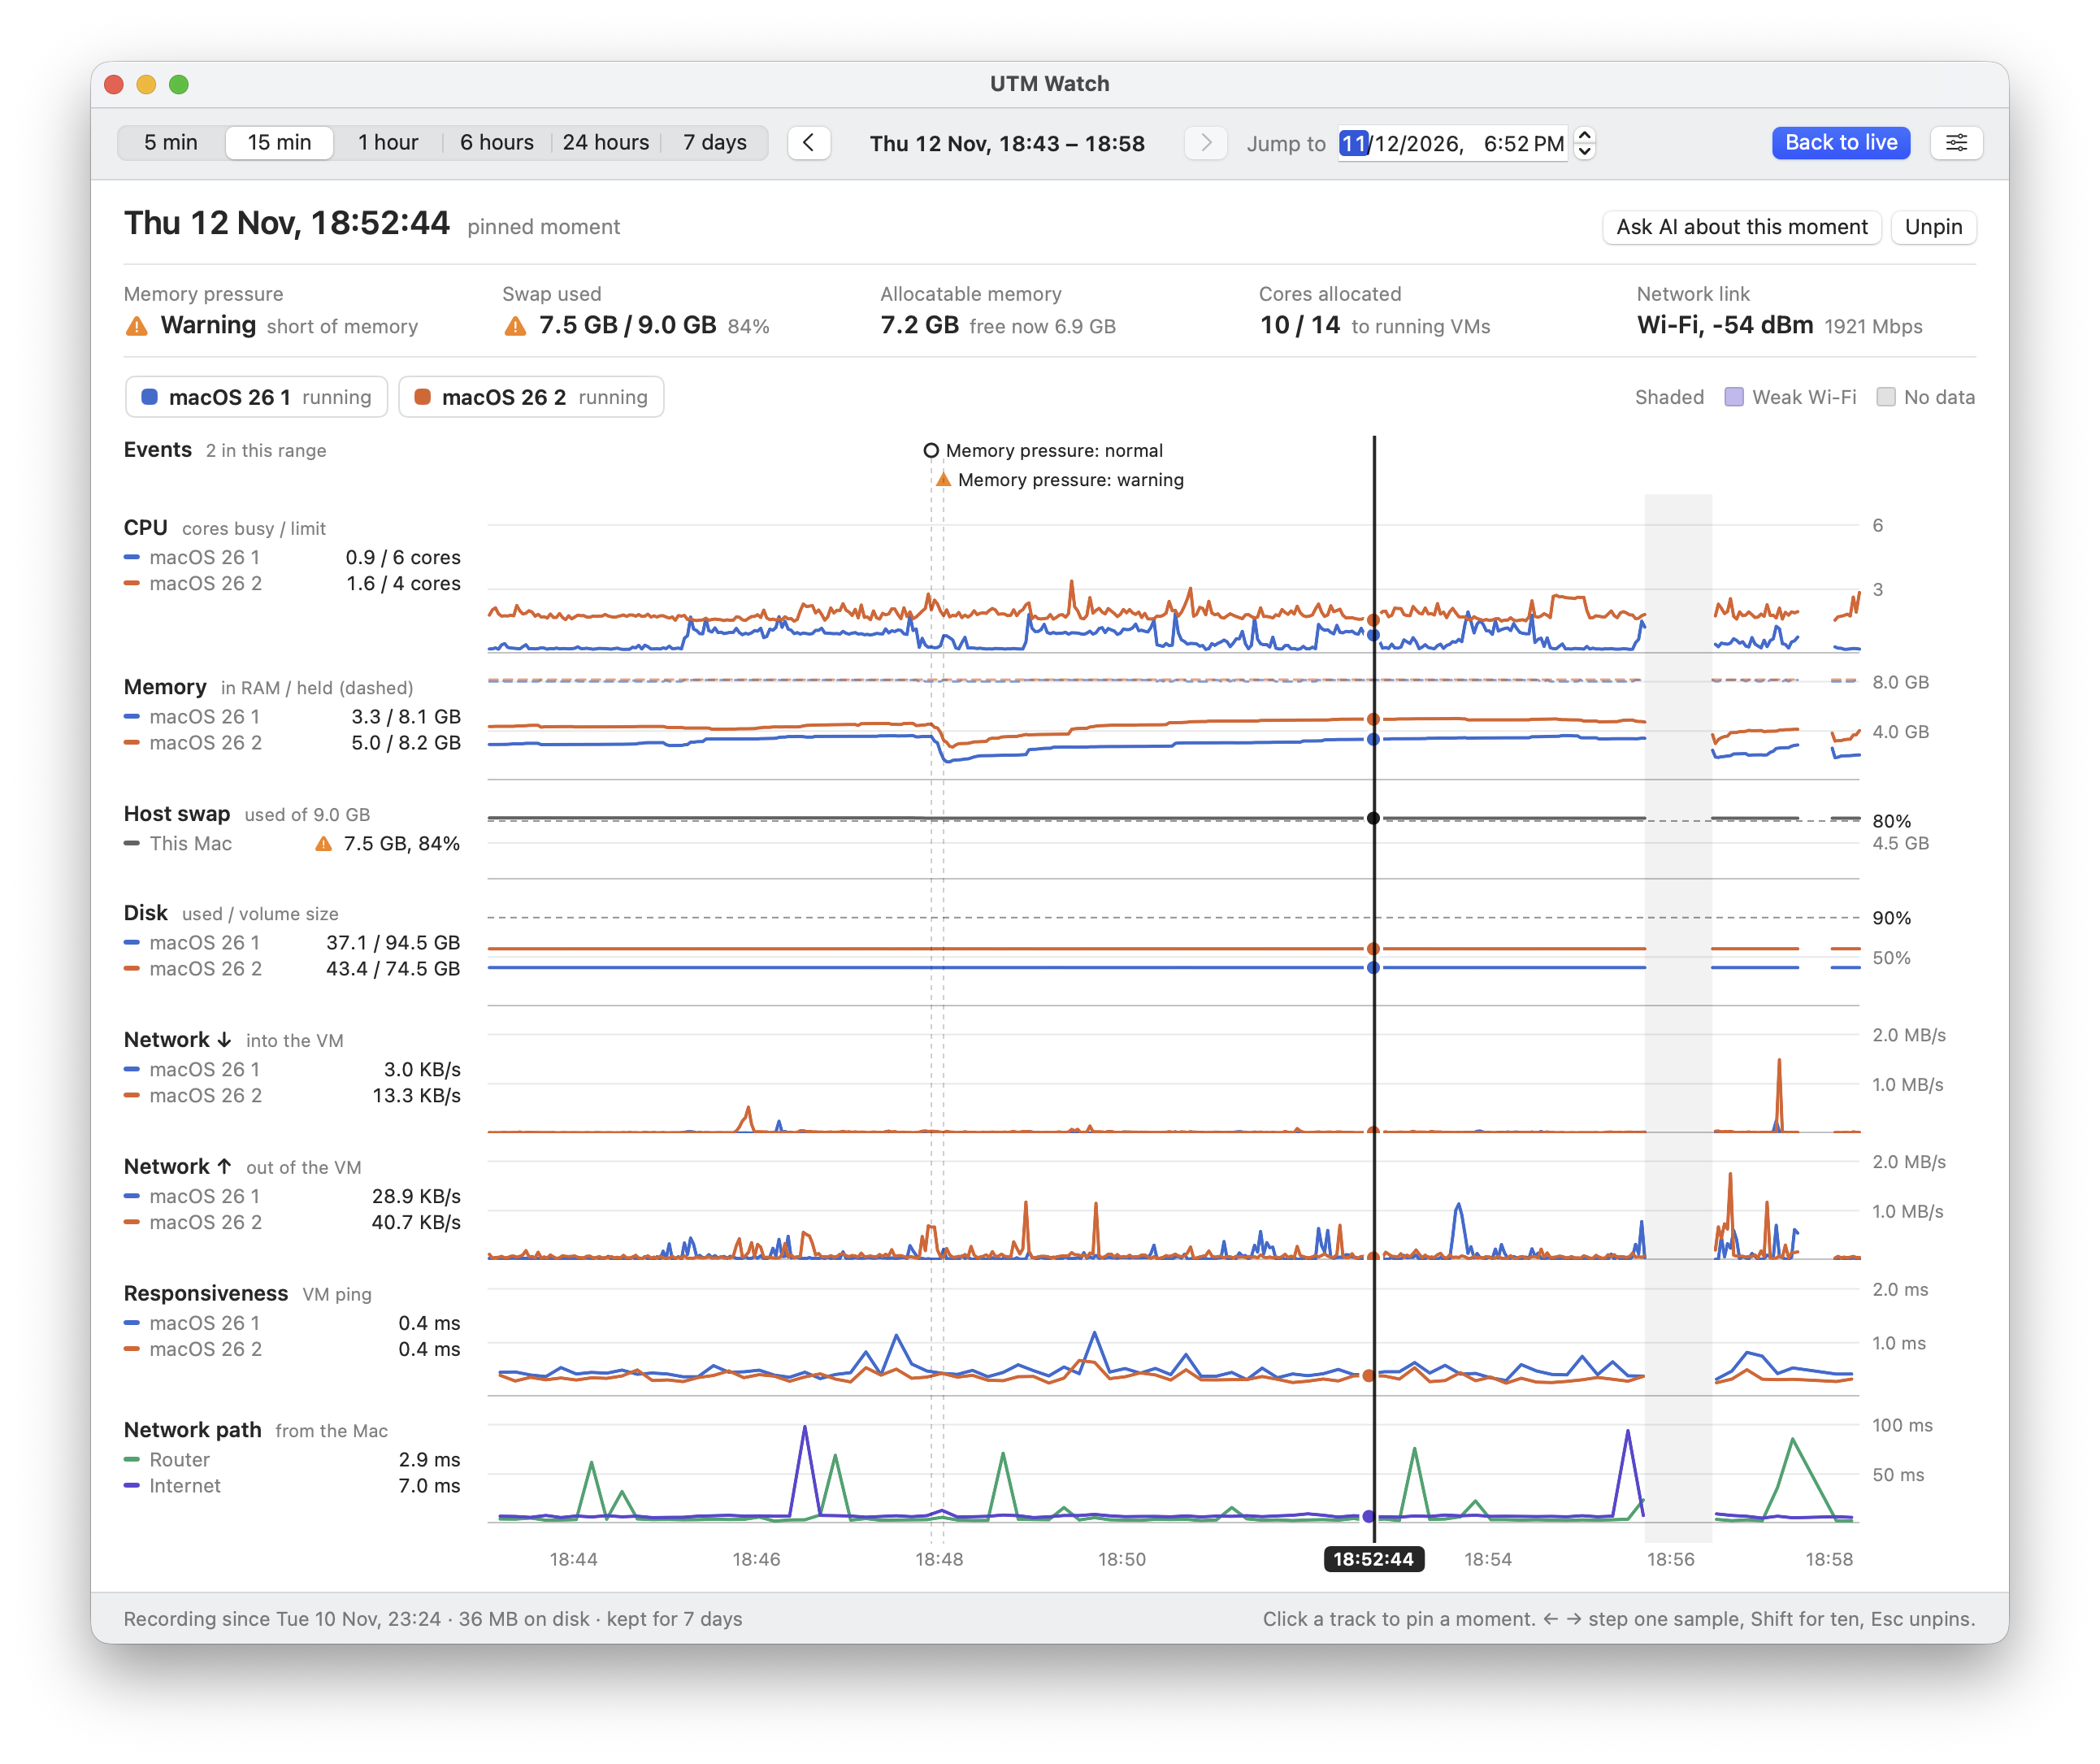
Every VM by name, with CPU, memory, how full its disk is, network and ping, live in the menu bar.
-
A quick look without opening a window: hover the menu bar item for every VM and the Mac at a glance. Click it for the full window.
-
Recorded history you can scrub back through, to see exactly what was happening at a past moment.
-
The whole connection path: ping to each VM, to your router and to the internet, plus Wi-Fi or Ethernet link quality, so you can tell a slow VM from a slow network.
-
Fleets: several Macs report to one hub, and one window shows every Mac and its VMs. Free, with no accounts.
-
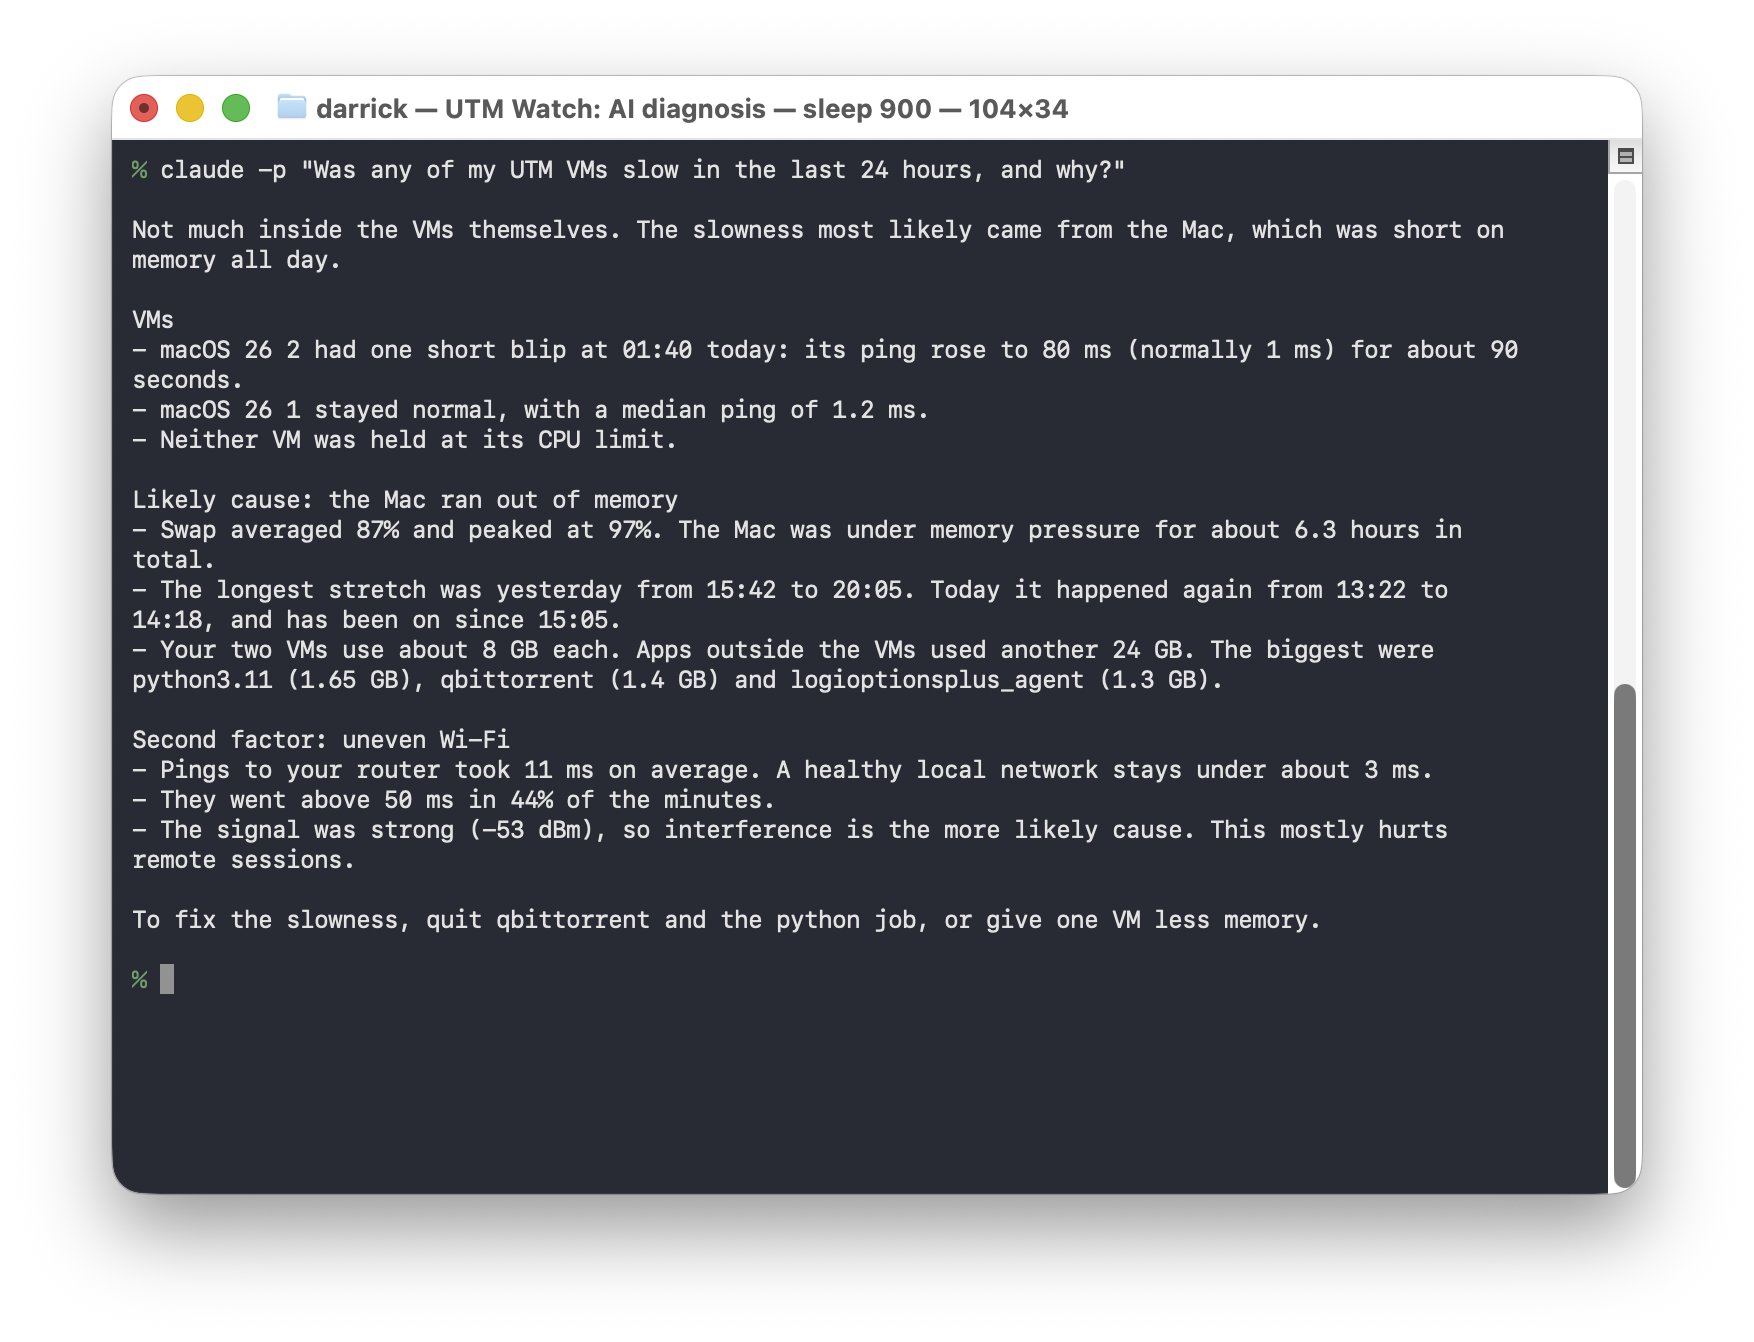
AI diagnosis through a read-only MCP server: ask an agent such as Claude why a VM was slow, on this Mac or any Mac in the fleet, and it reads the history and tells you.
-
Works with both UTM backends: Apple Virtualization and QEMU, with macOS, Linux and Windows guests.
UTM Watch is an independent project. It is not affiliated with or endorsed by the UTM project.
Install
Requires an Apple silicon Mac. Built and tested on macOS 26; set to run on macOS 14 or later, but older versions are untested.
One command (recommended). Installs the menu bar app into /Applications, then starts the app:
curl -fsSL https://raw.githubusercontent.com/DarrickBM/utm-watch/main/install.sh | bash
The script is short; read it first if you prefer: install.sh.
Or by hand. Download UTMWatch-<version>-macos-arm64.dmg from the latest release, open it, and drag UTM Watch into Applications. The app is not notarized by Apple, so the first time macOS will refuse to open it. Go to System Settings, then Privacy & Security, and click Open Anyway, or run this once:
xattr -dr com.apple.quarantine /Applications/UTMWatch.app
First launch. macOS asks for three permissions: access to data from other apps (UTM's VM files), control of UTM, and the local network (pings to your router and VMs). The app keeps working if you deny one, with less detail.
[!IMPORTANT] After an update, give the permissions again. macOS treats the updated app as new. It asks for control of UTM again, and it may refuse UTM's VM files until you turn Full Disk Access for UTM Watch off and on again in System Settings › Privacy & Security, then quit UTM Watch and open it again. If it keeps refusing, use Reset and ask again… in UTM Watch's Settings › Permissions. Until then VMs show without their names, limits or disk usage.
What is in the box
| Part | What it does |
|---|---|
Menu bar app (UTMWatch.app) |
Live figures in the menu bar, a hover brief, and a detail window with trend tracks and recorded history. |
MCP server (utmwatch-mcp, inside the app) |
Read-only tools over the recorded history, for AI agents. |
History is stored in ~/Library/Application Support/UTM Watch/history.sqlite.
AI diagnosis with an MCP server
The app bundle contains utmwatch-mcp, a read-only Model Context Protocol server over standard input/output. An agent on this Mac can use it to read the recorded history and work out why a VM was slow. Connect Claude Code with:
claude mcp add utm-watch -- /Applications/UTMWatch.app/Contents/MacOS/utmwatch-mcp
Then ask, for example: "A user says connecting to one of my VMs is sometimes slow. Use utm-watch to find out why."
| Tool | What it answers |
|---|---|
find_incidents |
When were VMs slow? Start here when someone reports slowness without a time. |
summarize |
What happened over a time range, VM by VM. |
get_moment |
Everything recorded at one moment. |
get_metrics |
One metric over time for a VM, the Mac or the network. |
list_events |
VM starts and stops, memory pressure and swap, VMs at their CPU limit, Wi-Fi and link changes, sleep and wake. |
get_status |
The latest sample: every VM, the Mac and the network now. |
list_macs |
Every Mac in the fleet (on a Mac that has joined one). |
Access can be switched off in the app's Settings under AI diagnosis.
Monitor several Macs as a fleet
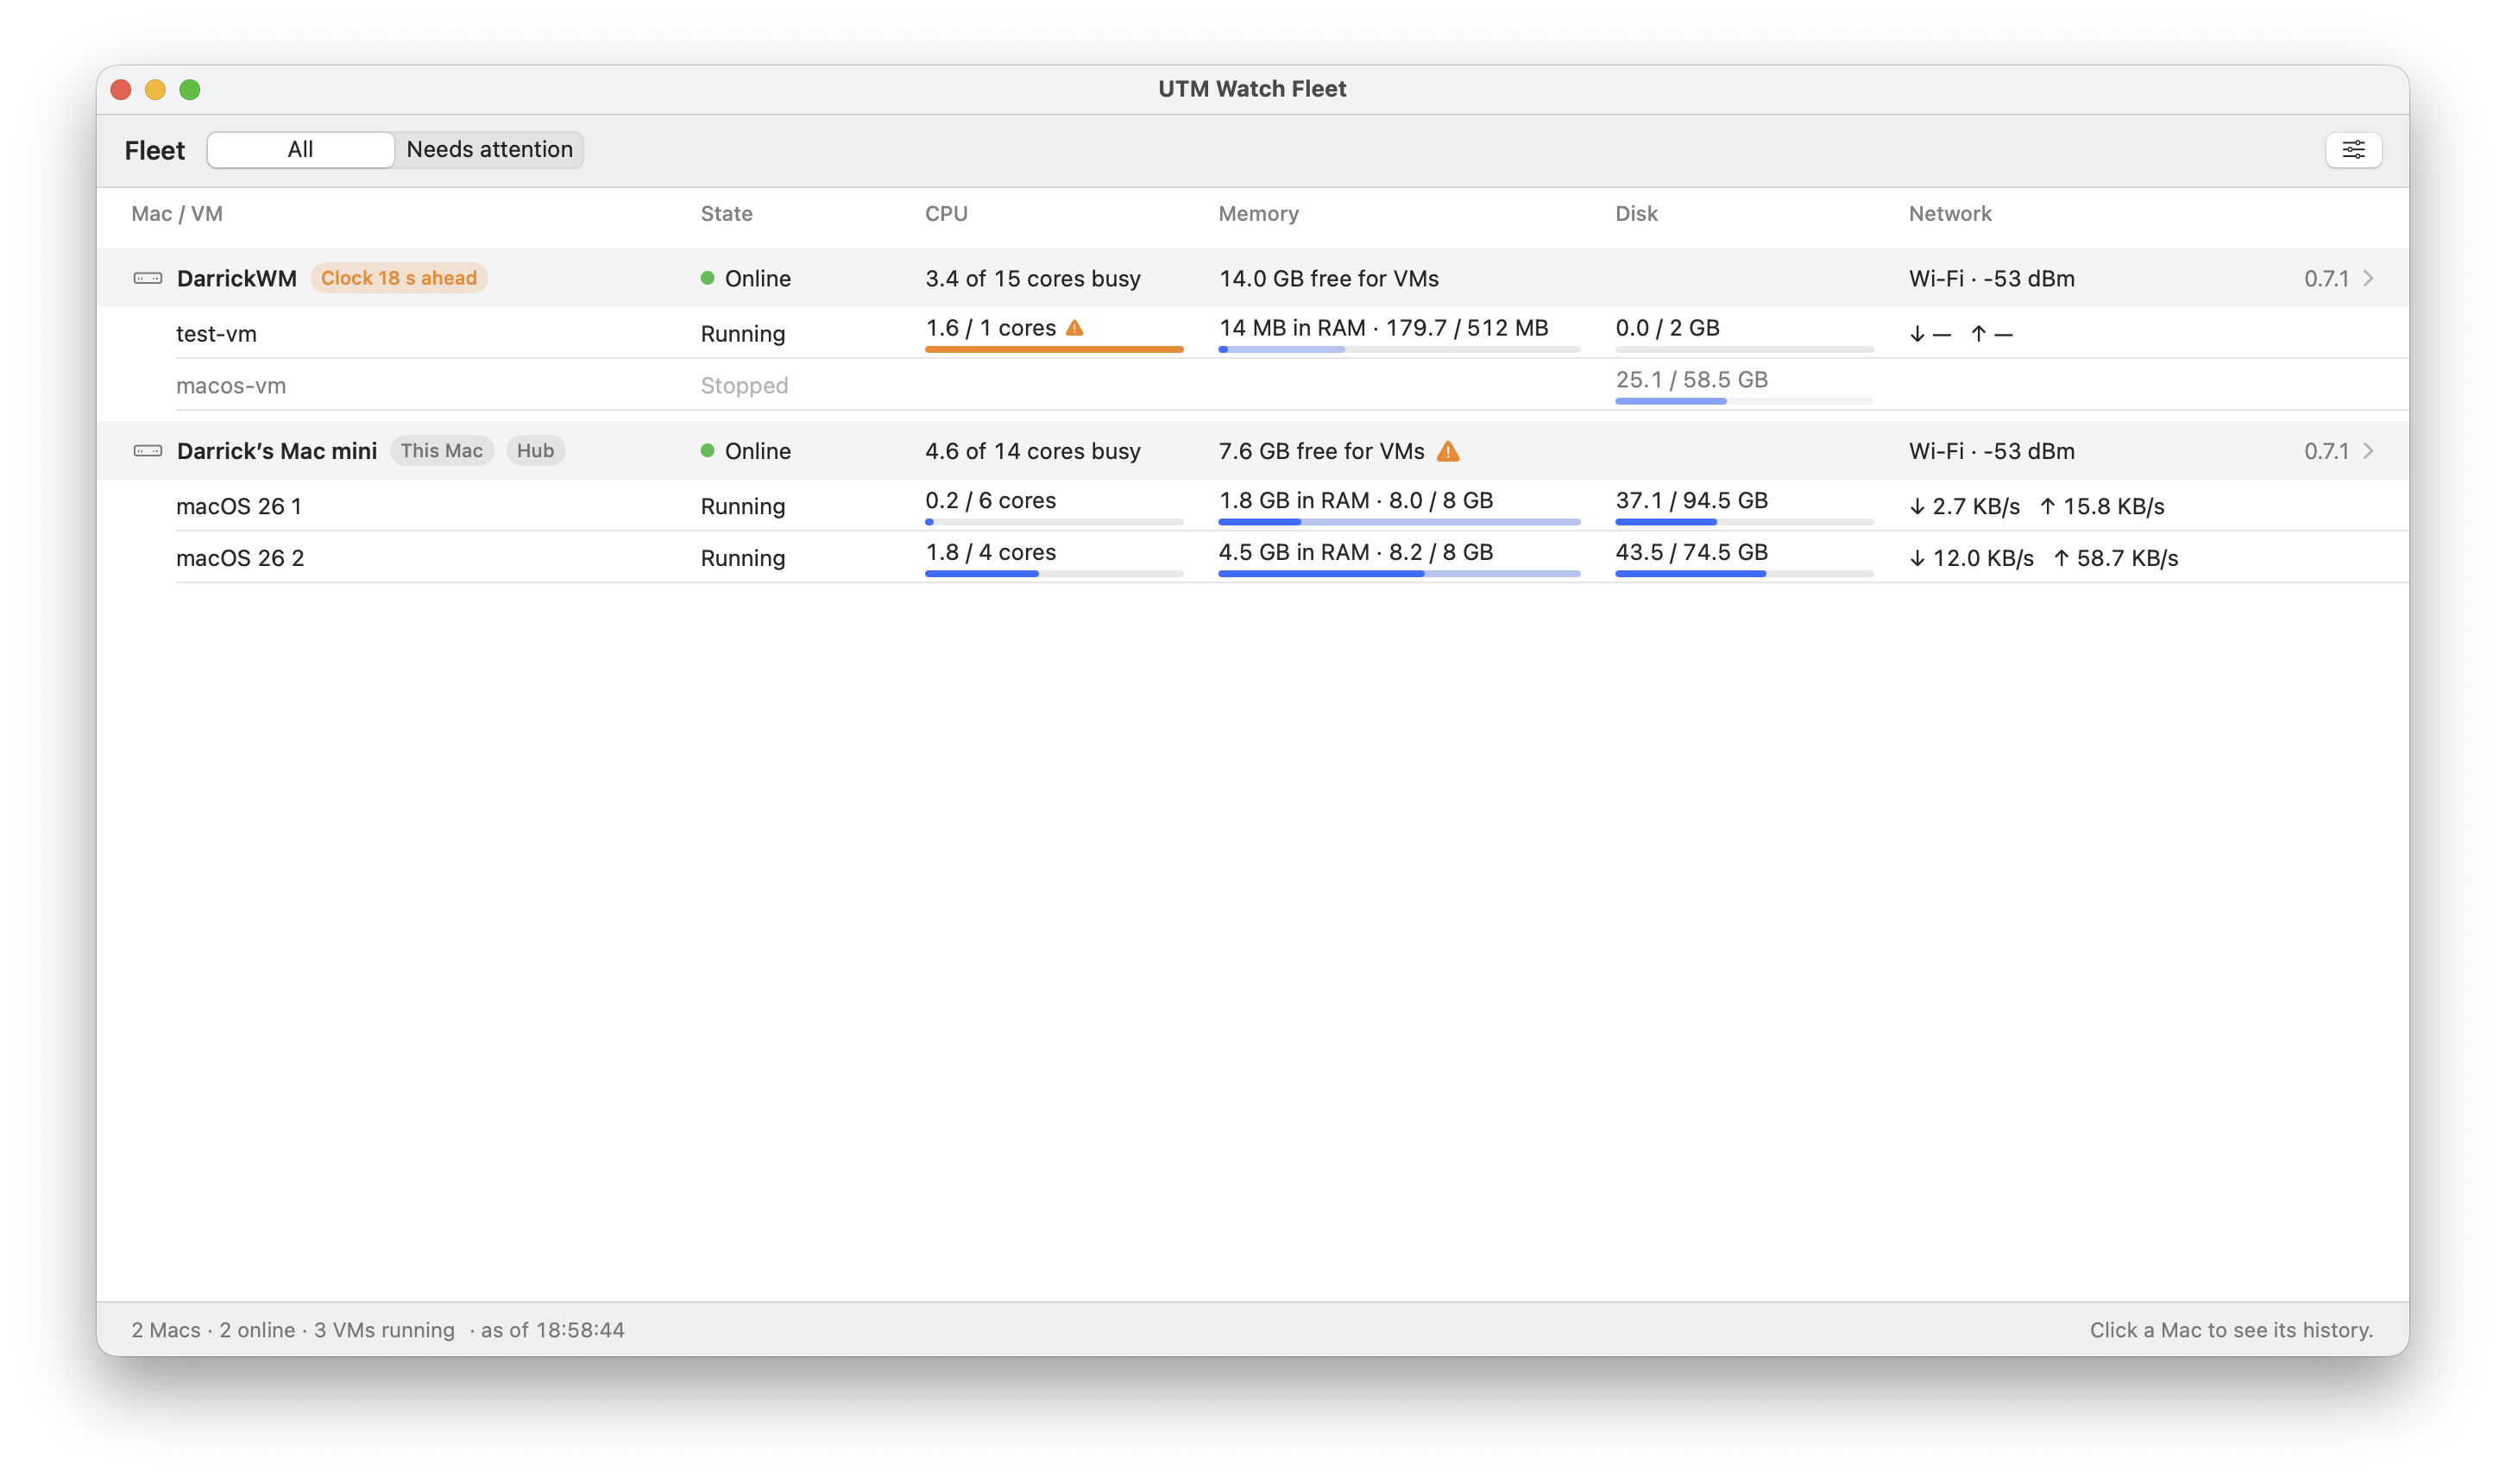
UTM Watch on one Mac needs nothing below. With several Macs, one of them hosts a hub and the others report to it; the hub Mac can then open Open Fleet from the menu bar item and see every Mac's VMs, and click a Mac for its history. The other Macs only report: they cannot see the fleet.
- On the Mac that will host the hub: Settings › Fleet › Host the hub on this Mac, then New pairing code.
- On each other Mac: Settings › Fleet, paste the code, Join. A code adds one Mac and works once, for 15 minutes.
A Mac that joins uploads its last 24 hours, then new history every ten seconds. If the hub cannot be reached it keeps recording and fills the gap later. The hub Mac has to stay on and logged in.
Macs on other networks. On the hub Mac, under "Connect Macs on other networks", paste an auth key from your own Tailscale account (reusable, tagged, pre-approved). UTM Watch then carries its own hidden Tailscale node: nothing appears in the menu bar or in System Settings, and a Tailscale you already run is left alone. Pairing codes made after that work from any network.
A hub on a server. The same hub runs on Linux:
docker build -f Hub/Dockerfile -t utm-watch-hub . && docker run -d -p 127.0.0.1:8787:8787 -v hub-data:/data utm-watch-hub
docker exec <container> utmwatch-hub token create --enroll --hub http://hub-address:8787     # a pairing code
Paste the code in each Mac's Settings › Fleet and click Join. Add --view to make a code whose Mac may also view the fleet.
AI diagnosis across the fleet. On a Mac that has joined, the MCP server offers list_macs, and every tool takes an optional mac (a name or UUID). Without mac a tool answers for the Mac it runs on, from its own database, exactly as before; that keeps working when the hub is down.
The design is in docs/DESIGN-fleet.md.
How it works
UTM Watch reads each VM's process for CPU and memory, its vmenetN interface for network, and its disk image for disk usage, all read-only and without anything installed in the guest. It matches processes to VMs through the disk image each process holds open, and gets names and states from UTM's AppleScript interface. Only NAT ("Shared") networking is supported in this version; bridged VMs show no network.
docs/HOW-IT-WORKS.md explains what each number means, how VMs are identified, the permissions involved and the implementation details.
Build from source
Requires macOS 26 on Apple silicon and the Swift toolchain from Xcode or the Command Line Tools. The app has no third-party dependencies and needs no root.
Self-checks for the pure logic (Command Line Tools ship no XCTest, so this is a plain executable):
swift run selftest
Scripts/make-app.sh builds and signs build/UTMWatch.app (with your Apple Development certificate if you have one, otherwise ad hoc); Scripts/make-release.sh produces the downloadable archives in dist/. Design notes are in docs/DESIGN-menu-bar-app.md.
Scripts/make-app.sh
open build/UTMWatch.app
To connect Claude Code to a build from source:
claude mcp add utm-watch -- "$(pwd)/build/UTMWatch.app/Contents/MacOS/utmwatch-mcp"
Contributing
Bug reports and pull requests are welcome. See CONTRIBUTING.md.
License
MIT. See LICENSE.
Built by DarrickBM
If UTM Watch is useful to you:
UTM Watch MCP questions
What can the AI agent do with UTM Watch?
An AI agent can use the MCP server to read recorded history to determine why a VM was slow, summarize events over a time range, and check specific metrics for VMs, the Mac, or the network.
Is the data collection intrusive to the guest OS?
No, the server reads data from the host side (processes, network interfaces, and disk images) without requiring anything to be installed inside the guest VM.