
Dotplot MCP server
✓ VerifiedAnalyzes product user flows and retention using per-user dot plots to identify aha moments and funnel performance.
Also known as brownglasses/dotplot-mcp
- Stars
- 1
- Tools
- —
- Downloads, 30 days
- 142
- Latest version
- 0.1.4
- Last commit
- Aug 14, 2026
- License
- MIT
What is Dotplot MCP?
Dotplot analyzes product user flows and retention using per-user dot plots to identify aha moments and funnel performance.
Summary generated from the project's README
About Dotplot MCP server
Dotplot MCP provides a way for developers to analyze product user flows and retention through per-user dot plots. Instead of relying on aggregate charts like DAU or MAU, this server focuses on individual user behavior by creating a visual representation where each row represents a single user and each cell represents a day. This approach helps identify specific aha moments and evaluate how well funnels are performing for small user bases.
Users can set up the server locally using the command claude mcp add --scope user dotplot -- uvx dotplot-mcp. The system works by having the AI interpret data computed by code to ensure mathematical accuracy. It can transform existing SQL tables, such as orders or wishlist items, into event streams without requiring a dedicated events table. The server includes specific slash commands like /dotplot-analyze-product for full reports, /dotplot-add-tracking to identify missing logging, and /dotplot-whats-changed to compare current data against previous findings.
What you can do with it
- 1Perform full product analysisAsk the AI to generate a comprehensive report on your product's user retention and behavior.
- 2Identify missing event trackingHave the agent scan your codebase to find and write the logging code you have not implemented yet.
- 3Compare retention over timeCheck how your user behavior patterns have shifted by comparing a new report to a previous one.
- 4Convert SQL tables to eventsTransform standard database tables like orders into event data for analysis.
Written from the project's README. Every use case is checked against a quote from it.
How to install Dotplot MCP
Formats verified 10 Nov 2026Add to CursorAdd to GooseInstall Dotplot MCP in Claude Code
$ claude mcp add dotplot-mcp -- uvx dotplot-mcpInstall Dotplot MCP in Cursor
~/.cursor/mcp.json
{
  "mcpServers": {
    "dotplot-mcp": {
      "command": "uvx",
      "args": [
        "dotplot-mcp"
      ]
    }
  }
}Install Dotplot MCP in VS Code
.vscode/mcp.json
{
  "servers": {
    "dotplot-mcp": {
      "type": "stdio",
      "command": "uvx",
      "args": [
        "dotplot-mcp"
      ]
    }
  }
}Install Dotplot MCP in VS Code CLI
$ code --add-mcp '{"name":"dotplot-mcp","type":"stdio","command":"uvx","args":["dotplot-mcp"]}'Install Dotplot MCP in Claude Desktop
claude_desktop_config.json
{
  "mcpServers": {
    "dotplot-mcp": {
      "command": "uvx",
      "args": [
        "dotplot-mcp"
      ]
    }
  }
}Install Dotplot MCP in Codex
$ codex mcp add dotplot-mcp -- uvx dotplot-mcpInstall Dotplot MCP in Codex config.toml
~/.codex/config.toml
[mcp_servers.dotplot-mcp]
command = "uvx"
args = ["dotplot-mcp"]
Install Dotplot MCP in Gemini CLI
$ gemini mcp add -s user dotplot-mcp uvx -- dotplot-mcpInstall Dotplot MCP in Gemini settings.json
~/.gemini/settings.json
{
  "mcpServers": {
    "dotplot-mcp": {
      "command": "uvx",
      "args": [
        "dotplot-mcp"
      ]
    }
  }
}Automated checks
Ran Nov 15, 2026Full report →Passed our automated checks. That is not a security audit: read the code and give the server the narrowest access it needs. How checks work

- Source repository linked and reachablebrownglasses/dotplot-mcp is public and reachablegithub.com/brownglasses/dotplot-mcp ↗Pass
- Package names this repository as its sourcedotplot-mcp names brownglasses/dotplot-mcp as sourcepypi.org/project/dotplot-mcp/ ↗Pass
- Build provenance (Sigstore attestation)No build attestation published for this releaseNot checked
- Open source license (OSI)MITspdx.org/licenses/MIT.html ↗Pass
- Commit or release in the last yearLast commit or release 2026-08-14github.com/brownglasses/dotplot-mcp ↗Pass
- OpenSSF ScorecardNot checked
- Package name not close to a popular packageNo popular package one edit away from dotplot-mcpPass
- No critical advisory in the package or its dependencies29 resolved dependencies checked; no critical advisoryosv.dev ↗Pass
- No hidden instructions to the model0 tool descriptions and the README read; no override phrases, credential paths or hidden charactersPass
- Destructive tools are labelledNot checked
- Remote endpoint answers the MCP handshakeNot checked
README
View on GitHubDot Plot MCP
See individual users, not aggregate charts.
English | 한국어
Install
Paste this to your agent and it sets everything up:
Set up Dotplot (MCP + skills) — instructions are here https://dotplot-reports.vercel.app/setup.md
claude mcp add --scope user dotplot -- uvx dotplot-mcp
Use
Say this in any project:
"Analyze my product"
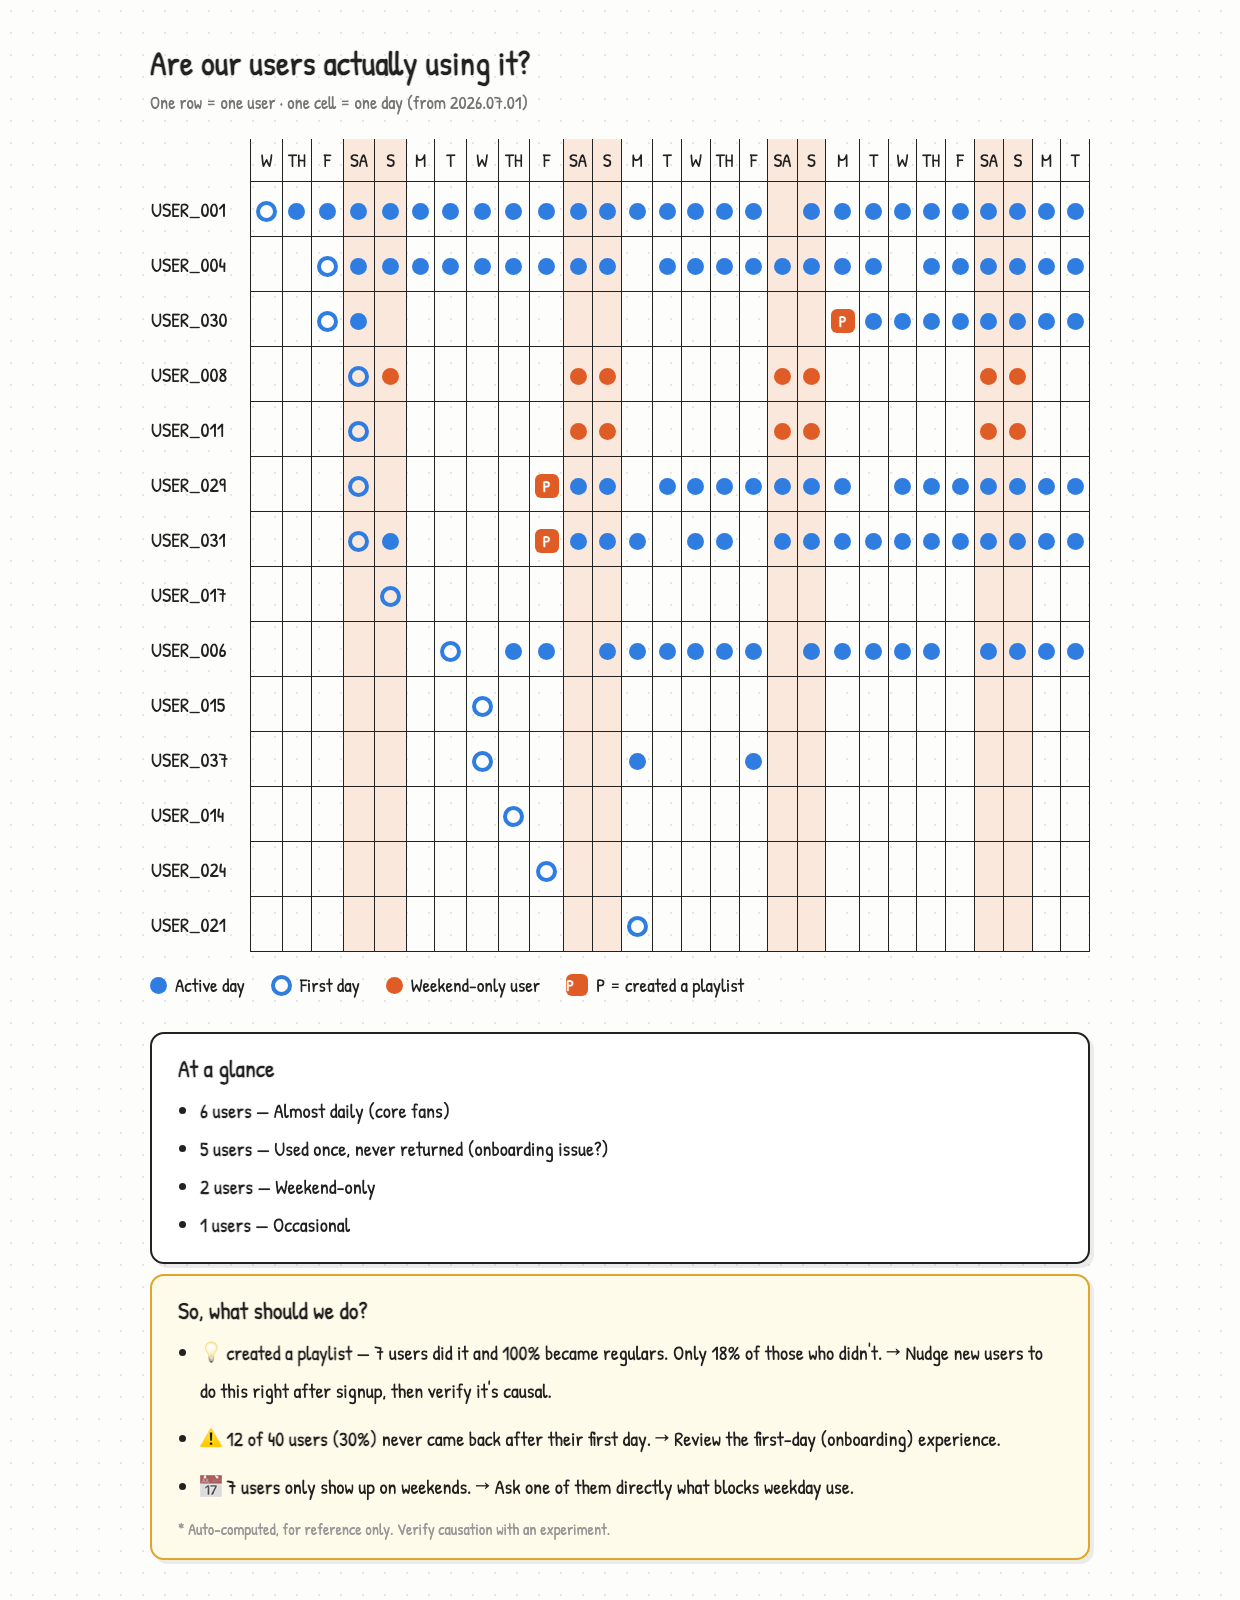
You get the report above. That's it.
Or use the slash commands:
/dotplot-analyze-product    full analysis and report
/dotplot-add-tracking       find and write the logging you're missing
/dotplot-whats-changed      compare with the previous report
Claude finds your data, picks the action that means "this user got value", and
writes the report. No events table needed — your orders table already is one:
SELECT user_id, created_at::date AS date, 'purchase' AS event FROM orders
UNION ALL
SELECT user_id, added_at::date, 'add_to_wishlist' FROM wishlist_items
Nothing tracked yet? Say "add the tracking I'm missing" and Claude reads your code, writes the logging that's absent, and tells you when to come back.
git clone https://github.com/brownglasses/dotplot-mcp && cd dotplot-mcp
uv run sample_data.py   # 40 fake users with a pattern planted in them
uv run harness.py       # watch the whole pipeline run
Why this exists
DAU/MAU charts go "up and to the right" as long as new users arrive — even when nobody stays. Until you have hundreds of users, the most informative dashboard is YC's dot plot (David Lieb): one row per user, one cell per day.
Four rules keep it honest:
- Code computes, AI only interprets — same data, same numbers, every time
- Small samples withhold judgment — under 5 users in a group, it says nothing
- Correlation isn't cause — every finding ships with "test this before you believe it"
- Vanity metrics are refused — pick
open_appas your value event and the code says no
Reports come out in your language (English, 한국어, 日本語 built in; anything else translated on the fly with the numbers verified intact).
More
MIT
Dotplot MCP questions
How do I add Dotplot MCP to Claude Code?
Run claude mcp add dotplot-mcp -- uvx dotplot-mcp in your terminal. Add --scope user to make it available in every project.
How do I add Dotplot MCP to Cursor?
Open ~/.cursor/mcp.json and add the server under mcpServers, using the Cursor config shown in the install section above.
How do I start analyzing my product?
You can simply tell your agent to 'Analyze my product' to generate a report.
What if I don't have tracking implemented yet?
You can ask the AI to find and write the missing logging for you.
Does it require a specific events table?
No, it can derive events from existing database tables like orders or wishlist items using SQL.