
greenlight MCP server
Commit Oct 24, 2026A transparent stdio proxy and live trace viewer that lets you debug MCP server communications and catch protocol bugs.
Also known as bradsward/greenlight
- Stars
- 0
- Tools
- —
- Downloads, 30 days
- —
- Latest version
- —
- Last commit
- Oct 24, 2026
- License
- MIT
What is greenlight MCP?
greenlight is a transparent stdio proxy and live trace viewer that lets you debug MCP server communications and catch protocol bugs.
Summary generated from the project's README
About greenlight MCP server
Debugging MCP integrations often feels like working in the dark when clients fail to call tools or report vague errors. Greenlight acts as a transparent stdio proxy that sits between your server and clients like Claude Desktop, Claude Code, Cursor, or Windsurf. It relays every byte unchanged while recording JSON-RPC messages to a local session log, allowing you to inspect the exact communication between the client and the server.
Developers can use the tail command to watch a live, color-coded trace where green indicates success, yellow shows slow calls, and red highlights failures with their actual error messages. The check tool identifies subtle protocol bugs, such as stdout pollution, duplicate tool names, or schema configurations that the Claude API rejects. For automated environments, the stats command provides a summary with CI-friendly exit codes. You can even use the serve command to expose the trace as an MCP server, enabling your coding agent to read and analyze its own failures directly.
What you can do with it
- 1Debug silent tool failuresWatch a live color-coded stream to see exactly why a tool call failed or why it is running slowly.
- 2Identify protocol and schema bugsScan recorded sessions to find errors like printing to stdout or using tool schemas that the Claude API rejects.
- 3Automate integration testing in CIUse exit codes to verify that your server meets performance and correctness standards during continuous integration.
- 4Enable agentic self-debuggingTurn the trace into an MCP server so your AI agent can inspect its own errors without manual intervention.
Written from the project's README. Every use case is checked against a quote from it.
Automated checks
Ran Nov 16, 2026Full report →Not verified yet. A server needs a score of 80, no serious finding, and enough data for us to check. How checks work · What to fix for more points

- Source repository linked and reachablebradsward/greenlight is public and reachablegithub.com/bradsward/greenlight ↗Pass
- Package names this repository as its sourceNot checked
- Build provenance (Sigstore attestation)Not checked
- Open source license (OSI)MITspdx.org/licenses/MIT.html ↗Pass
- Commit or release in the last yearLast commit or release 2026-10-24github.com/bradsward/greenlight ↗Pass
- OpenSSF ScorecardNot checked
- Package name not close to a popular packageNot checked
- No critical advisory in the package or its dependenciesNot checked
- No hidden instructions to the model0 tool descriptions and the README read; no override phrases, credential paths or hidden charactersPass
- Destructive tools are labelledNot checked
- Remote endpoint answers the MCP handshakeNot checked
README
View on GitHub .-----.
| 🔴 |
| 🟡 |
| 🟢 |
'-----'
greenlight
greenlight


Listed in awesome-mcp-devtools.
See what your MCP server is actually doing.
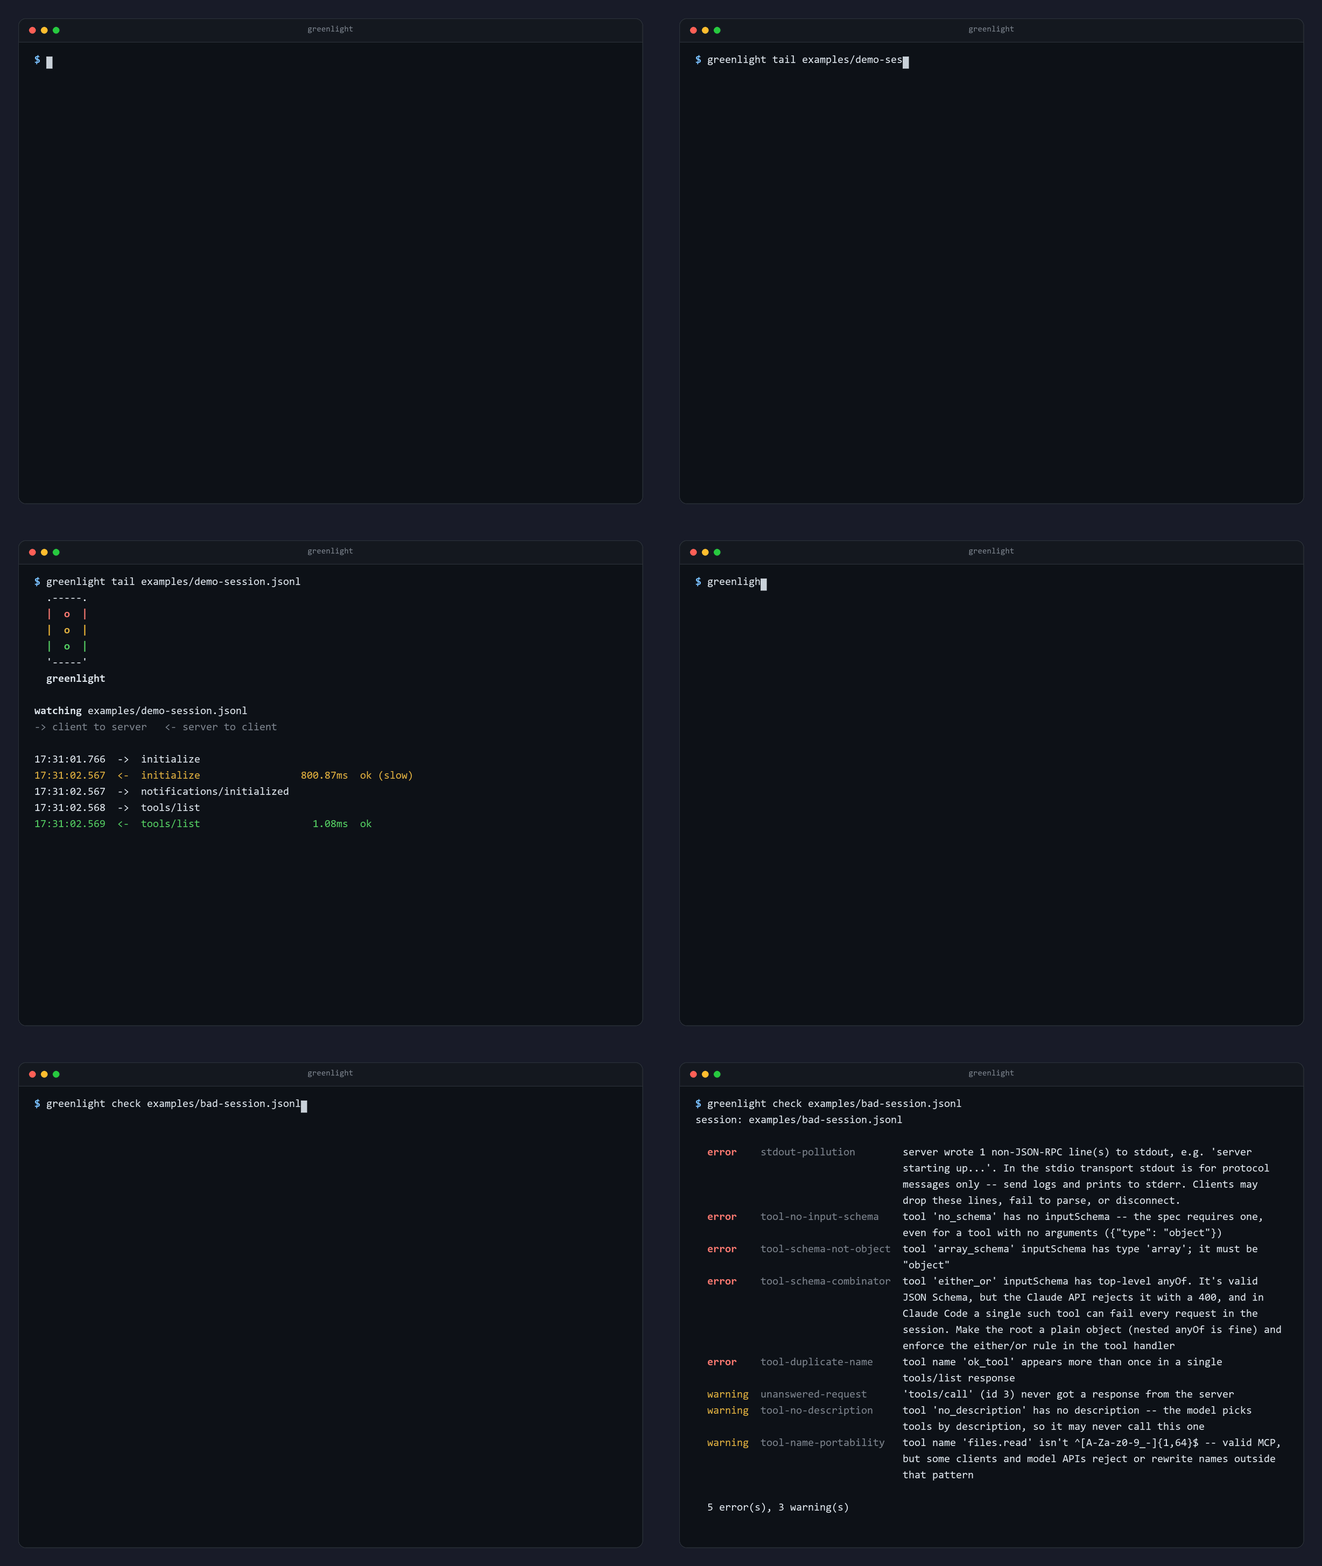
When an MCP integration misbehaves, you're usually debugging blind: the client says a tool "failed" or quietly never calls it, and you can't see what was sent or what came back. Greenlight is a transparent proxy that sits between your real client (Claude Desktop, Claude Code, Cursor, Windsurf) and your real server, relays every byte unchanged, and records every JSON-RPC message so you can watch it live, read it back later, or lint it.
tail: a live, color-coded trace. Green means ok, yellow means slow, red means failed, and failed calls show the tool's real error message.check: catches server bugs that never show up as a failed call, like printing to stdout, tool schemas the Claude API rejects, HTTP 401s that clients report as "failed to connect", or requests that never got a response.stats: a summary with a CI-friendly exit code.serve: exposes the trace as an MCP server, so your coding agent can read the failures itself.
Try it in 30 seconds
uvx greenlight-mcp run -- npx -y @modelcontextprotocol/server-everything stdio
Then, in another terminal:
uvx greenlight-mcp tail -f
That's the official MCP reference server, with nothing to configure. It
needs uv and Node.js. Prefer pip?
pip install greenlight-mcp, then use greenlight wherever this README
says uvx greenlight-mcp.
Use it with your real client
Wrap the server command in your client's MCP config:
{
  "mcpServers": {
    "my-server": {
      "command": "uvx",
      "args": ["greenlight-mcp", "run", "--name", "my-server", "--",
               "npx", "-y", "@some/mcp-server"]
    }
  }
}
Or let Greenlight write the snippet for you:
greenlight wrap
wrap finds your Claude Desktop, Claude Code, Cursor, or Windsurf config
and prints each server entry rewritten to run through Greenlight. It's
read-only and never edits the file, and it only shows the command and
args it changes, never your env.
It also writes full paths: Python's, and your server's own command
(npx becomes the path your terminal resolves it to). Clients often
launch servers with a smaller PATH than your terminal has, which is where
most spawn npx ENOENT / "Server disconnected" failures come from. It
warns if a command isn't on your PATH either, or if an argument is a
relative path the client won't be able to find. If a server still can't
be started, greenlight run says why on stderr instead of dumping a
traceback.
Logs go to ~/.greenlight/sessions/, whichever directory the client
launched the server from. To put them somewhere else, use --log-dir or
set GREENLIGHT_SESSIONS_DIR. If the log directory can't be written,
Greenlight warns on stderr and keeps relaying. It never stops your server
from starting.
For a remote Streamable HTTP server, proxy the URL instead:
greenlight run --http http://127.0.0.1:9000/mcp
Point your client at the local URL it prints. You get the same logs, and
the same tail, check, and stats.
Commands
greenlight tail            # replay the most recent session
greenlight tail -f         # follow a live session
greenlight check           # lint the session for protocol/server bugs
greenlight stats           # counts, latency by method, pass/fail
check: bugs that don't look like failures
$ greenlight check examples/bad-session.jsonl
session: examples/bad-session.jsonl

  error    stdout-pollution        server wrote 1 non-JSON-RPC line(s) to stdout, e.g. 'server
                                   starting up...'. In the stdio transport stdout is for
                                   protocol messages only -- send logs and prints to stderr.
                                   Clients may drop these lines, fail to parse, or disconnect.
  error    tool-schema-combinator  tool 'either_or' inputSchema has top-level anyOf. It's valid
                                   JSON Schema, but the Claude API rejects it with a 400, and
                                   in Claude Code a single such tool can fail every request in
                                   the session. Make the root a plain object (nested anyOf is
                                   fine) and enforce the either/or rule in the tool handler
  error    tool-duplicate-name     tool name 'ok_tool' appears more than once in a single
                                   tools/list response
  warning  unanswered-request      'tools/call' (id 3) never got a response from the server
  ...
Real output, abridged, from examples/bad-session.jsonl:
a session recorded through the proxy against
tests/bad_fixture_server.py, a server
built to make these mistakes on purpose.
It also flags non-object input schemas, tool names some clients reject, responses to ids nobody sent, and very slow calls or slow startup.
Two that are worth knowing about: a top-level oneOf/anyOf/allOf
in a tool's input schema is valid JSON Schema, but the Claude API rejects
it with a 400, and in Claude Code a single such tool can fail every
request in the session without saying which one. And for HTTP servers,
a 401/403 is rejected before JSON-RPC, so a client just says "failed
to connect"; Greenlight records the status and WWW-Authenticate header
and check reports it.
Errors exit non-zero, and so do warnings with --strict. --json gives
machine-readable output.
--capture-payloads: what was actually sent (opt-in)
By default Greenlight records metadata only: methods, ids, timings and error text. It never stores your requests' arguments or the content a server returns, so the logs are safe to leave on. When a call fails and you need to see what the client really sent:
greenlight run --capture-payloads -- npx -y @some/mcp-server
greenlight tail --payloads
17:50:42.604  ->  tools/call
        params: {"name":"boom","arguments":{},"_meta":{}}
17:50:42.604  <-  tools/call                   0.81ms  FAILED (tool error): Error executing tool boom: this tool always fails, on purpose
        args:   {"name":"boom","arguments":{},"_meta":{}}
        result: {"content":[{"text":"Error executing tool boom: this tool always fails, on purpose","type":"text"}],"isError":true}
Real output. A failed result carries the arguments that caused it, under
args:, next to what came back.
Secrets are redacted before anything is written: values under
secret-looking keys (api_key, authorization, password, token, ...),
and well-known shapes like API keys, GitHub and Slack tokens, JWTs,
private keys and user:password@ URLs. Long base64 data, like a
screenshot, becomes a size note, and each payload is cut at 8192
characters (--payload-limit).
That's best effort, not a guarantee. A secret in free text that matches
none of those shapes gets through, so treat captured logs as sensitive.
They're created owner-only, and the serve tools only include payloads
when your agent asks for them (include_payloads).
CI
Both check and stats exit non-zero on failure. stats fails on tool
errors (result.isError) as well as JSON-RPC errors. That matters
because a failed tool call arrives as a successful JSON-RPC response,
and it's easy to miss if you only check for the obvious kind:
greenlight run --log-dir ./trace -- python my_server.py < scripted_session.jsonl
greenlight check --log-dir ./trace && greenlight stats --log-dir ./trace
serve: let your agent read the trace
pip install "greenlight-mcp[serve]"
greenlight serve
Add greenlight serve to your coding agent's MCP config, and it can call
get_failures, get_problems, get_trace, or get_session_stats
itself. It sees the real error messages, so you don't have to paste
terminal output.
Server won't connect?
"Server disconnected", spawn npx ENOENT, "Connection closed (-32000)":
the usual cause is that your client starts the server with a smaller PATH,
and a different working directory, than your terminal has. So the command
works for you and not for the client.
greenlight wrap writes full paths into the config it suggests, and warns
about commands that aren't on your PATH and relative paths the client
can't resolve. If the server still can't be started, greenlight run
says what was missing on stderr (which clients usually capture in the
server's log) instead of dumping a traceback. Once it starts but misbehaves,
greenlight check and tail show what it did.
Why not MCP Inspector?
They do different jobs. Inspector is a UI you drive by hand to test a server in isolation. Greenlight sits in the path of your real client and records what actually happened in a real session. That includes the client's exact requests, which is usually where the bug turns out to be. It also leaves a durable log you can check in CI.
Other proxies exist too. mcpsnoop
is a Go transparent proxy with a live terminal UI and call replay, and if
a proxy to watch and replay traffic is all you want, it's worth a look.
Greenlight leans toward telling you what's wrong: check for server bugs
and for tool schemas the Claude API rejects, HTTP 401s that never show up
as JSON-RPC errors, the real error message from a failed tool call, and
serve, so your coding agent can read the trace itself. It's a Python
package you can run with uvx.
How it works
greenlight run spawns your server as a subprocess and relays
stdin/stdout on two threads. It parses each line as JSON-RPC, correlates
each response with its request by id (so every response knows its method
and latency), and appends the result to a JSONL file. The one rule
everything depends on: nothing but the server's own bytes ever reaches
Greenlight's stdout. Status output goes to stderr, and logs go to disk.
The base install depends only on rich. Python 3.10+, tested on Linux
and Windows.
More
- CHANGELOG.md: what changed in each release.
notes/: a running engineering log of what broke, how it was found, and why each fix is what it is.- Issues and PRs welcome. If Greenlight misreads a real session, the log file is the most useful thing you can attach.
greenlight MCP questions
What is greenlight?
Greenlight is a transparent proxy that sits between your MCP client and server to record and inspect JSON-RPC messages.
Does Greenlight store sensitive information?
By default, it only records metadata. If you opt-in to capture payloads, it uses best-effort redaction for secrets like API keys and tokens.