
PerformanceMonitor MCPサーバー
コミット 2026年11月15日AIクライアントから、収集されたSQL ServerおよびPostgreSQLのパフォーマンスデータ、アラート、実行計画をクエリして分析できます。
別名 erikdarlingdata/PerformanceMonitor
- スター
- 536
- ツール
- —
- ダウンロード数(30日間)
- —
- 最新バージョン
- —
- 最終コミット
- 2026年11月15日
- ライセンス
- MIT
PerformanceMonitor MCPとは
PerformanceMonitorはMCPサーバーです。 AIクライアントから、収集されたSQL ServerおよびPostgreSQLのパフォーマンスデータ、アラート、実行計画をクエリして分析できます。.
プロジェクトのREADMEから生成された概要
PerformanceMonitor MCP server について
PerformanceMonitorは、データベース管理者や開発者が、AIクライアント内からSQL ServerおよびPostgreSQLのパフォーマンスデータを分析できるようにします。AIエージェントを組み込みのMCP serverに接続することで、収集されたパフォーマンスメトリクス、リアルタイムのアラート、実行計画をクエリしてデータベースの問題を診断できます。このシステムには2つの異なる運用方法があります。ローカルのDuckDBとParquetファイルを使用してリモートからオンデマンドで監視する単一のデスクトップアプリケーションであるLiteと、中央のPostgreSQLストアに24時間365日継続的に収集するサービスであるDarlingです。
使用するエディションによって、AIエージェントはレポートの読み取り以上の操作を行うことができます。Liteは調査に特化していますが、Darlingエディションでは、アラート設定の変更、Query Storeプランの強制または解除、モジュールの再コンパイル、さらにはセッションの強制終了といったアクションをエージェントが実行できます。すべての操作は、制御を確実にするためにユーザーが有効にしたスイッチに従います。この構成は、オンプレミスサーバー、Azure SQL Managed Instance、AWS RDS、および各種PostgreSQLバージョンを含むさまざまな環境で動作します。
できること
- 1データベースの問題を自動的に修復する開発者はAIに対して、実行計画の管理や問題のあるセッションの終了などのタスクを割り当てることができます。
- 2データベースのアラート設定を管理するユーザーはAIクライアントを使用して、監視システムの問題通知方法を調整できます。
プロジェクトの README から作成されています。すべてのユースケースは、その引用と照らし合わせて確認されています。
自動チェック
実行日 2026年11月14日完全なレポート →まだ検証されていません。サーバーには80点のスコア、重大な問題がないこと、および検証に必要な十分なデータが必要です。 チェックの仕組み · 点数を上げるための改善点

- ソースリポジトリがリンクされており、アクセス可能erikdarlingdata/performancemonitor is public and reachablegithub.com/erikdarlingdata/performancemonitor ↗合格
- パッケージがこのリポジトリをソースとして指定未チェック
- ビルドの来歴 (Sigstore 証明)未チェック
- オープンソースライセンス (OSI)MITspdx.org/licenses/MIT.html ↗合格
- 過去1年以内にコミットまたはリリースありLast commit or release 2026-11-13github.com/erikdarlingdata/performancemonitor ↗合格
- OpenSSF Scorecard未チェック
- パッケージ名が有名なパッケージに酷似していない未チェック
- パッケージおよびその依存関係に重大な勧告なし未チェック
- モデルへの隠れた指示がない0 tool descriptions and the README read; no override phrases, credential paths or hidden characters合格
- 破壊的なツールがラベル付けされている未チェック
- リモートエンドポイントが MCP ハンドシェイクに応答未チェック
README
GitHubで見るSQL Server Performance Monitor
Free, open-source monitoring that replaces the tools charging you thousands per server per year. It includes specialized collectors, real-time alerts, and a built-in MCP server for AI analysis. Nothing phones home. Your data stays on your server and your machine.
If you pay for a monitoring tool now, read the comparison for yours.
Redgate SQL Monitor · SQL Sentry · SolarWinds DPA · Idera SQL Diagnostic Manager · Quest Spotlight · Datadog Database Monitoring · Database Health Monitor
It supports SQL Server 2016 SP2 to 2025. SQL Server 2017 needs CU3 or later. It also supports Azure SQL Managed Instance, AWS RDS for SQL Server, and Azure SQL Database (Lite and Darling). Darling also monitors PostgreSQL. It supports PostgreSQL 14 to 18, plus Amazon RDS, Aurora and Azure Database for PostgreSQL, and makes a best effort on PostgreSQL 10 to 13. See Supported PostgreSQL versions.
Editions
- Lite is a single desktop app that monitors your servers remotely, on demand. Nothing is installed on your server. It stores data in local DuckDB and Parquet files.
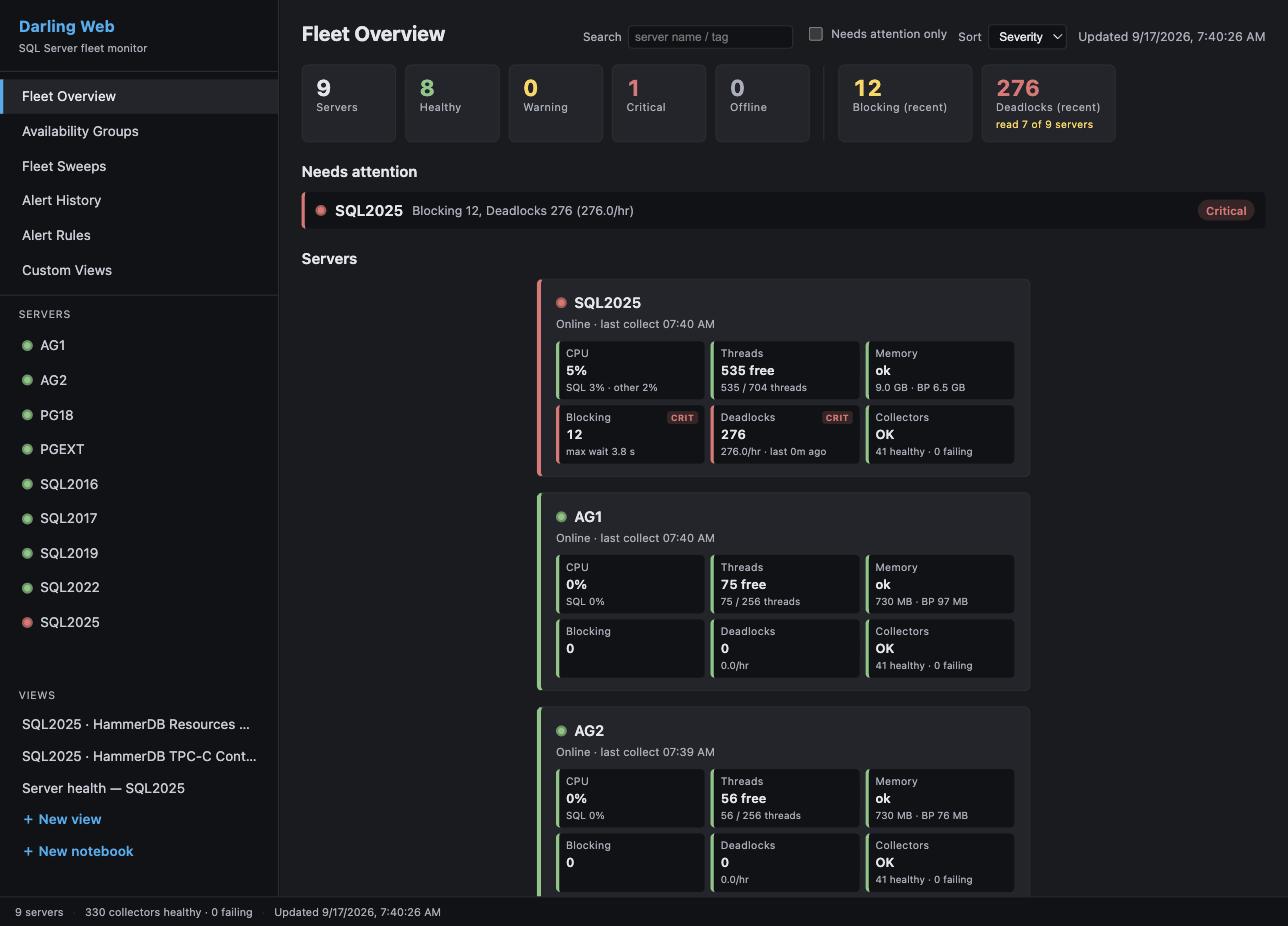
- Darling is a service on Windows or Linux that collects 24/7 into a central PostgreSQL store. The Windows viewer and the web dashboard read that store from any seat.
Both editions can hand an alert to an AI agent that you run, and Lite lets the agent read and report. Darling can also let it change alert settings (mutes, custom alert rules and thresholds). On a server, it can force or unforce a Query Store plan or evict a cached plan. It can recompile a module, create or drop a plan guide, or kill a session. Each of these has its own switch per server, and all are off until you turn them on. Darling records every change. A person can undo alert-setting changes, plan forces and plan guide changes. A plan eviction, a recompile or a session kill cannot be undone. Agent dispatch explains the levels.
The Dashboard edition is deprecated. Existing installs keep working, but we recommend Lite or Darling for new deployments. Choosing an edition compares all three.
Each release ships these downloads. For Lite, a Setup.exe and a portable ZIP. For Darling, the service ZIP (with the viewer inside), a Viewer Setup.exe for a remote seat, and the Linux and Compose tarballs. The Full Dashboard and its CLI installer ship nothing. Their last builds are in the v3.2.0 release.
Not sure which one? Start with Lite. It is one download, nothing is installed on your server, and data starts to flow in under 5 minutes.
Quick start: Lite
- Download
PerformanceMonitorLite-lite-Setup.exe. It is a self-contained build, so you do not install a .NET runtime first. - Run the installer. It adds Start Menu and Desktop shortcuts.
- Start Lite from the Start Menu or the Desktop shortcut.
- Click + Add Server, enter the connection details, test, and save.
- Double-click the server in the sidebar to connect.
Data starts to flow within 1 to 5 minutes. The monitoring login needs VIEW SERVER STATE (Permissions).
Before you upgrade an older install with Setup.exe, read the warning in the Lite guide. On versions older than 3.4.0, Setup.exe deletes the data in the install directory (see Upgrading an install older than 3.4.0). The Lite guide also covers the portable ZIP, collectors, storage, and configuration.
Quick start: Darling
- Download
PerformanceMonitorDarling-<version>.zipandSHA256SUMS.txtfrom the latest release. Check the zip hash againstSHA256SUMS.txt. The zip carries its own .NET runtime, so there is nothing to install first. - Extract the zip to
C:\Program Files\PerformanceMonitorDarling. Do not use your Desktop, Downloads, or any folder underC:\Users\. The service runs as a virtual account that cannot read a user profile (why). - Double-click
Install-Darling.cmdin the install folder. It asks Windows for administrator rights and runsinstall-darling.ps1. You can also run.\install-darling.ps1from an elevated PowerShell. It installs the Windows service and creates a Darling Viewer shortcut. With nodarling.jsonit writes a minimal one, and the service starts with no monitored servers. - Wait about two minutes for the first start, then open Darling Viewer. It opens on the fleet.
- Add your first server in the viewer.
darling.jsonis only a seed. The service reads it on its first start, so a server added to the file later is ignored (why). - The service log is in
%ProgramData%\PerformanceMonitorDarling\logs.
Install Darling gives each step with the log line or screen that proves it worked. To upgrade, run upgrade-darling.ps1. To remove the service, run uninstall-darling.ps1. Both are in the install folder. For Linux and the web dashboard, read the Darling quick start. The Darling operator guide is the configuration reference.
Documentation
| Page | What it covers |
|---|---|
| Choosing an edition | Lite, Darling, and Dashboard side by side |
| Features and screenshots | What you get, with screenshots |
| Lite guide | Install, upgrade, where Lite keeps its files, configuration, appearance, collectors |
| Lite Extended Events sessions | The sessions Lite creates on a monitored server, and how to remove them |
| Darling quick start | Install on Windows, Linux notes, web dashboard |
| Darling operator guide | Darling configuration, permissions, operations |
| Darling store sizing | Disk, RAM and vCPU for a store host, by number of servers |
| Back up, restore and move the store | Back up a Darling store, restore it, or move it to another machine |
| Darling guides | Install, viewer, web dashboard, MCP, day-to-day admin and command line reference |
| PostgreSQL target runbook | Point Darling at a PostgreSQL target, with a proof point at each step |
| Retention Held runbook | Clear a Retention Held alert |
| How collection works | A tour of the collection pipeline, for people who read the code |
| Documentation index | Every page in docs/, grouped by audience |
| Tabs | What each tab shows |
| Alerts and notifications | Alert types, channels, routes, email |
| Agent dispatch | Hand an alert to your own AI agent: levels, the brief and report, undo, the remediation login |
| Signed webhooks | Verify that a generic webhook post came from Darling |
| Agent job monitoring | Running SQL Agent jobs and jobs that run longer than expected |
| MCP server | Setup, the tool list and the Lite investigation tools for AI analysis |
| Authentication | Authentication types and credential profiles |
| Permissions | Grants for on-premises, Azure, and AWS RDS. The optional agent remediation login is in Agent dispatch |
| Platform notes | AWS RDS and Aurora configuration |
| Performance impact | Load on monitored servers, and local resources for Lite |
| Troubleshooting | Common problems for Lite and Darling |
| Building from source | Folder structure and build commands |
| Support and sponsorship | Commercial support tiers and sponsorship |
| Third-party components | Third-party components and their licenses |
| Changelog | Changes in each release |
Support
Performance Monitor is free and open source under the MIT License, with no features withheld. The tools that it replaces charge thousands of dollars per server per year. A support subscription covers all of your SQL Server instances.
| Tier | Cost per year | Email response | Includes |
|---|---|---|---|
| Supported | $500 | Within 2 business days | Guaranteed compatibility updates for new SQL Server versions, priority feature requests, a support agreement and invoices, unlimited instances |
| Priority | $2,500 | By the next business day | Everything in Supported, plus a quarterly live Q&A session, early access to new features, and direct input on the roadmap |
Support and sponsorship says what support gets you and has the link to buy. You can also sponsor on GitHub.
Sponsors
License
Copyright (c) 2026 Darling Data, LLC. Licensed under the MIT License. See LICENSE for details.
Author
Erik Darling: erikdarling.com and Darling Data, LLC
PerformanceMonitor MCPのよくある質問
PerformanceMonitorはどのデータベースを監視できますか?
SQL Server 2016 SP2から2025、Azure SQL Managed Instance、AWS RDS for SQL Server、およびRDS、Aurora、Azure Database for PostgreSQLを含むPostgreSQL 14から18を監視できます。
AIエージェントがアラート設定を変更するには特別な権限が必要ですか?
サーバーごとに有効にした場合のみ、その権限が付与されます。すべてのスイッチはデフォルトでオフになっており、すべての変更は記録されます。
PerformanceMonitorにはどのようなエディションがありますか?
主に2つのエディションがあります。データをローカルに保存する単一のデスクトップアプリであるLiteと、中央のPostgreSQLストアに24時間365日収集するサービスであるDarlingです。
PerformanceMonitorは無料ですか?
はい、MIT Licenseの下で公開されている無料のオープンソースソフトウェアであり、機能制限はありません。有料のサポートサブスクリプションは任意です。
PerformanceMonitorを使い始めるにはどうすればよいですか?
まずはLiteから始めてください。ダウンロードするだけでサーバーへのインストールは不要で、数分以内にデータの収集を開始できます。