
Dotplot MCPサーバー
✓ 検証済みユーザーごとのドットプロットを使用して、プロダクトのユーザーフローとリテンションを分析し、アハ体験(aha moments)やファネルのパフォーマンスを特定します。
別名 brownglasses/dotplot-mcp
- スター
- 1
- ツール
- —
- ダウンロード数(30日間)
- 142
- 最新バージョン
- 0.1.4
- 最終コミット
- 2026年8月14日
- ライセンス
- MIT
Dotplot MCPとは
DotplotはMCPサーバーです。 ユーザーごとのドットプロットを使用して、プロダクトのユーザーフローとリテンションを分析し、アハ体験(aha moments)やファネルのパフォーマンスを特定します。.
プロジェクトのREADMEから生成された概要
Dotplot MCP server について
Dotplot MCPは、ユーザーごとのドットプロットを通じて、プロダクトのユーザーフローとリテンションを分析する手段を開発者に提供します。DAUやMAUといった集計チャートに頼るのではなく、このMCP serverは、各行が単一のユーザーを、各セルが1日を表す視覚的な表現を作成することで、個々のユーザー行動に焦点を当てます。このアプローチにより、特定のアハ体験を特定したり、小規模なユーザーベースにおけるファネルのパフォーマンスを評価したりすることが容易になります。
ユーザーは、コマンド claude mcp add --scope user dotplot -- uvx dotplot-mcp を使用して、ローカルにサーバーをセットアップできます。このシステムは、数学的な正確性を確保するために、コードによって計算されたデータをAIが解釈することで動作します。専用のイベントテーブルを必要とせず、注文やウィッシュリストなどの既存のSQLテーブルをイベントストリームに変換できます。このサーバーには、フルレポートを作成する /dotplot-analyze-product、不足しているロギングを特定する /dotplot-add-tracking、現在のデータと以前の調査結果を比較する /dotplot-whats-changed といった特定のスラッシュコマンドが含まれています。
できること
- 1プロダクトのフル分析を実行プロダクトのリテンションとユーザー行動に関する包括的なレポートをAIに生成させます。
- 2不足しているイベントトラッキングの特定エージェントにコードベースをスキャンさせ、まだ実装されていないロギングコードを見つけて記述させます。
- 3リテンションの経時的な比較新しいレポートを以前のレポートと比較することで、ユーザー行動のパターンがどのように変化したかを確認します。
- 4SQLテーブルをイベントに変換注文などの標準的なデータベーステーブルを、分析用のイベントデータに変換します。
プロジェクトの README から作成されています。すべてのユースケースは、その引用と照らし合わせて確認されています。
Dotplot MCPのインストール方法
フォーマット検証日 2026年11月10日Cursor に追加Gooseに追加Claude CodeにDotplot MCPをインストール
$ claude mcp add dotplot-mcp -- uvx dotplot-mcpCursorにDotplot MCPをインストール
~/.cursor/mcp.json
{
  "mcpServers": {
    "dotplot-mcp": {
      "command": "uvx",
      "args": [
        "dotplot-mcp"
      ]
    }
  }
}VS CodeにDotplot MCPをインストール
.vscode/mcp.json
{
  "servers": {
    "dotplot-mcp": {
      "type": "stdio",
      "command": "uvx",
      "args": [
        "dotplot-mcp"
      ]
    }
  }
}VS Code CLIにDotplot MCPをインストール
$ code --add-mcp '{"name":"dotplot-mcp","type":"stdio","command":"uvx","args":["dotplot-mcp"]}'Claude DesktopにDotplot MCPをインストール
claude_desktop_config.json
{
  "mcpServers": {
    "dotplot-mcp": {
      "command": "uvx",
      "args": [
        "dotplot-mcp"
      ]
    }
  }
}CodexにDotplot MCPをインストール
$ codex mcp add dotplot-mcp -- uvx dotplot-mcpCodex config.tomlにDotplot MCPをインストール
~/.codex/config.toml
[mcp_servers.dotplot-mcp]
command = "uvx"
args = ["dotplot-mcp"]
Gemini CLIにDotplot MCPをインストール
$ gemini mcp add -s user dotplot-mcp uvx -- dotplot-mcpGemini settings.jsonにDotplot MCPをインストール
~/.gemini/settings.json
{
  "mcpServers": {
    "dotplot-mcp": {
      "command": "uvx",
      "args": [
        "dotplot-mcp"
      ]
    }
  }
}自動チェック
実行日 2026年11月15日完全なレポート →自動チェックに合格しました。これはセキュリティ監査ではありません。コードを読み、サーバーに必要最小限のアクセス権を与えてください。 チェックの仕組み

- ソースリポジトリがリンクされており、アクセス可能brownglasses/dotplot-mcp is public and reachablegithub.com/brownglasses/dotplot-mcp ↗合格
- パッケージがこのリポジトリをソースとして指定dotplot-mcp names brownglasses/dotplot-mcp as sourcepypi.org/project/dotplot-mcp/ ↗合格
- ビルドの来歴 (Sigstore 証明)No build attestation published for this release未チェック
- オープンソースライセンス (OSI)MITspdx.org/licenses/MIT.html ↗合格
- 過去1年以内にコミットまたはリリースありLast commit or release 2026-08-14github.com/brownglasses/dotplot-mcp ↗合格
- OpenSSF Scorecard未チェック
- パッケージ名が有名なパッケージに酷似していないNo popular package one edit away from dotplot-mcp合格
- パッケージおよびその依存関係に重大な勧告なし29 resolved dependencies checked; no critical advisoryosv.dev ↗合格
- モデルへの隠れた指示がない0 tool descriptions and the README read; no override phrases, credential paths or hidden characters合格
- 破壊的なツールがラベル付けされている未チェック
- リモートエンドポイントが MCP ハンドシェイクに応答未チェック
README
GitHubで見るDot Plot MCP
See individual users, not aggregate charts.
English | 한국어
Install
Paste this to your agent and it sets everything up:
Set up Dotplot (MCP + skills) — instructions are here https://dotplot-reports.vercel.app/setup.md
claude mcp add --scope user dotplot -- uvx dotplot-mcp
Use
Say this in any project:
"Analyze my product"
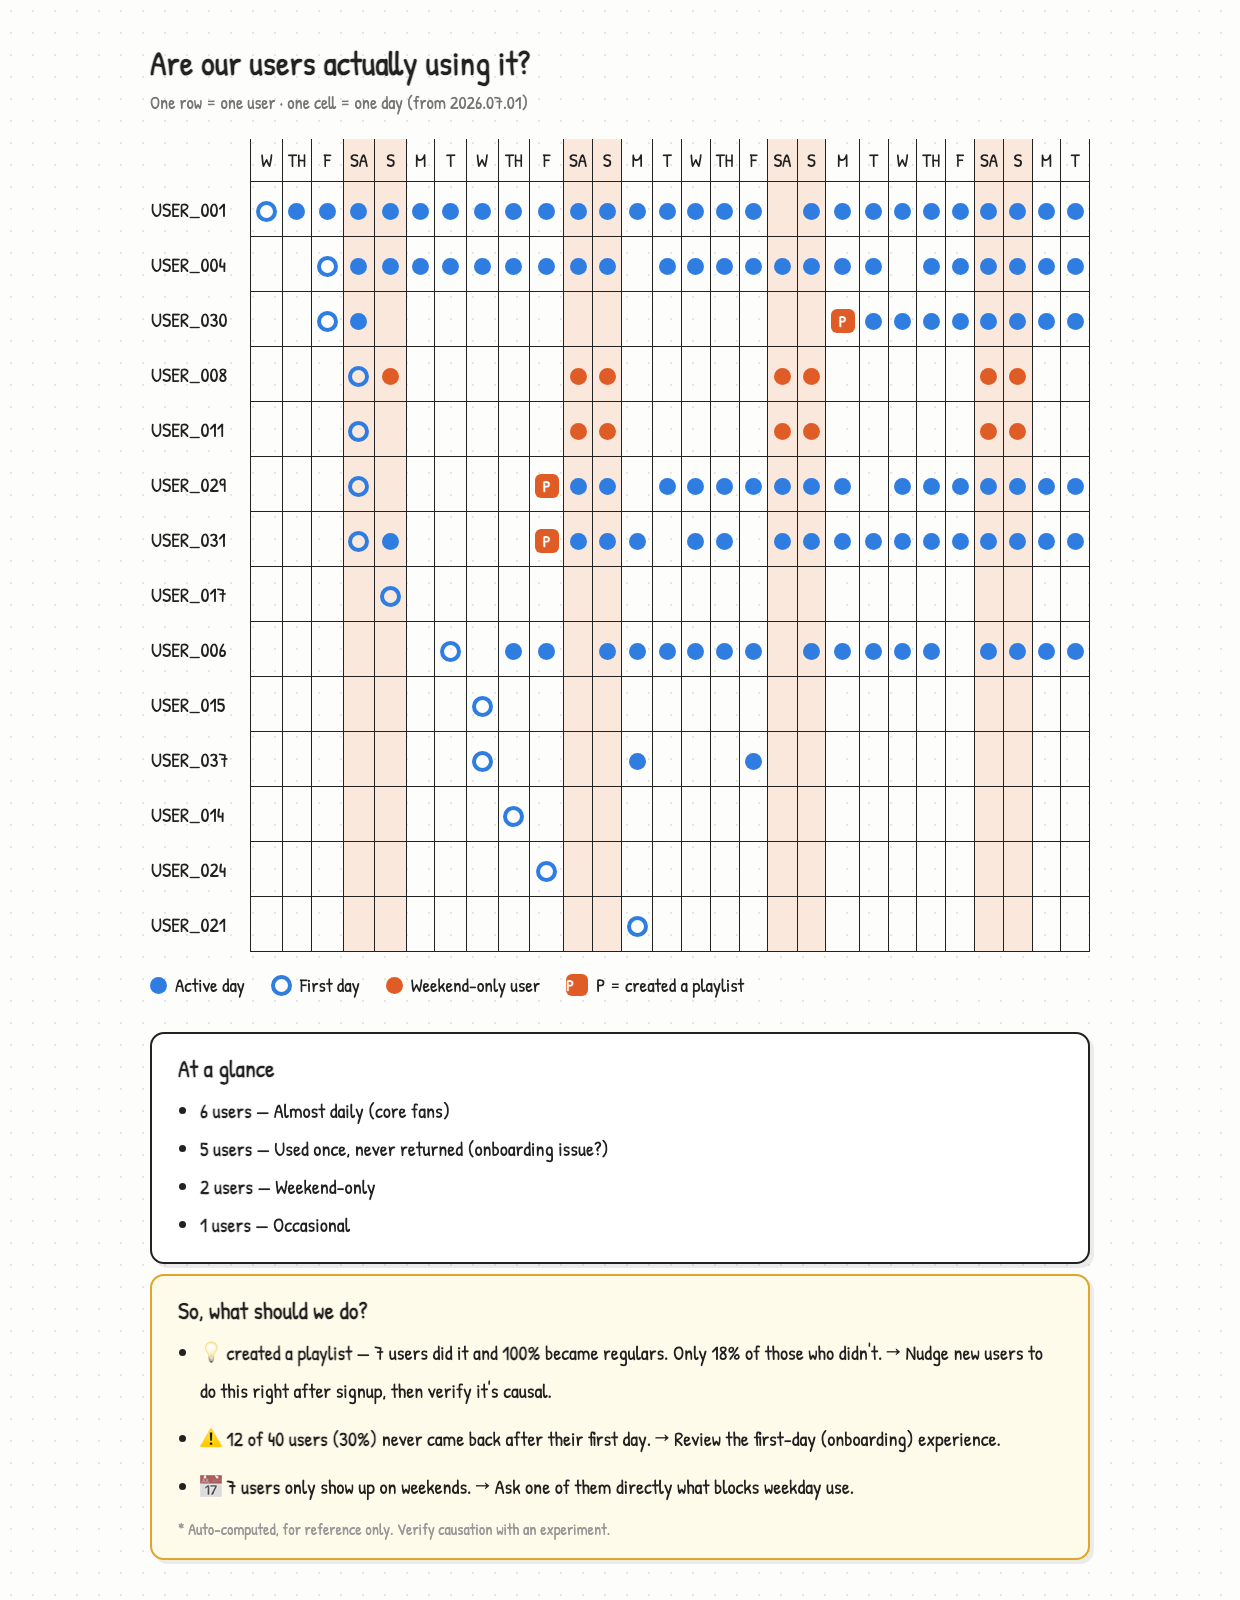
You get the report above. That's it.
Or use the slash commands:
/dotplot-analyze-product    full analysis and report
/dotplot-add-tracking       find and write the logging you're missing
/dotplot-whats-changed      compare with the previous report
Claude finds your data, picks the action that means "this user got value", and
writes the report. No events table needed — your orders table already is one:
SELECT user_id, created_at::date AS date, 'purchase' AS event FROM orders
UNION ALL
SELECT user_id, added_at::date, 'add_to_wishlist' FROM wishlist_items
Nothing tracked yet? Say "add the tracking I'm missing" and Claude reads your code, writes the logging that's absent, and tells you when to come back.
git clone https://github.com/brownglasses/dotplot-mcp && cd dotplot-mcp
uv run sample_data.py   # 40 fake users with a pattern planted in them
uv run harness.py       # watch the whole pipeline run
Why this exists
DAU/MAU charts go "up and to the right" as long as new users arrive — even when nobody stays. Until you have hundreds of users, the most informative dashboard is YC's dot plot (David Lieb): one row per user, one cell per day.
Four rules keep it honest:
- Code computes, AI only interprets — same data, same numbers, every time
- Small samples withhold judgment — under 5 users in a group, it says nothing
- Correlation isn't cause — every finding ships with "test this before you believe it"
- Vanity metrics are refused — pick
open_appas your value event and the code says no
Reports come out in your language (English, 한국어, 日本語 built in; anything else translated on the fly with the numbers verified intact).
More
MIT
Dotplot MCPのよくある質問
Dotplot MCPをClaude Codeに追加するには
ターミナルでclaude mcp add dotplot-mcp -- uvx dotplot-mcpを実行します。すべてのプロジェクトで利用するには--scope userを追加します。
Dotplot MCPをCursorに追加するには
~/.cursor/mcp.jsonを開き、上記のインストールセクションに示すCursor設定を使ってmcpServersの下にサーバーを追加します。
プロダクトの分析を始めるにはどうすればよいですか?
エージェントに「Analyze my product」と指示するだけで、レポートを生成できます。
まだトラッキングを実装していない場合はどうなりますか?
不足しているロギングをAIに探し出し、記述させることが可能です。
特定のイベントテーブルが必要ですか?
いいえ、SQLを使用して、注文やウィッシュリストなどの既存のデータベーステーブルからイベントを導き出すことができます。