
静的解析を用いて、あらゆるコードベースから視覚的なアーキテクチャ図と並行処理のボトルネック予測を生成します。
別名 askuma/workflow-generator, workflow-generator, workflow-generator-mcp
- スター
- 0
- ツール
- —
- ダウンロード数(30日間)
- 365
- 最新バージョン
- 0.5.0
- 最終コミット
- 2026年10月26日
- ライセンス
- MIT
Workflow Generator MCPとは
静的解析を用いて、あらゆるコードベースから視覚的なアーキテクチャ図と並行処理のボトルネック予測を生成します。
プロジェクトのREADMEから生成された概要
Workflow Generator MCP server について
Workflow Generatorは、コードベースからシステムアーキテクチャを可視化し、パフォーマンスのボトルネックを特定することを開発者に可能にします。Python、Node.js、Go、Java、Rust、またはRubyで記述されたプロジェクトに対して静的解析を実行し、包括的なWORKFLOW.htmlレポートを作成します。このレポートには、ダークモード対応のビジュアル図、依存関係グラフ、および並行処理の限界値と実用的なスループットの推定値が含まれます。
本ツールは、スタンドアロンのCLIツールとして実行できるほか、Claude Desktop、Cursor、VS Code、ZedなどのMCP対応クライアントに接続することも可能です。このMCP serverは、完全なHTMLレポートを作成するgenerate_workflowと、構造化されたJSONサマリーを取得するanalyze_workflowの2つの主要なツールを提供します。精度を確保するため、node_modulesやvenvなどの外部ディレクトリは自動的に無視されます。より深い洞察を得るために、アクセスログを提供して依存関係グラフに実際の要求数を重ね合わせたり、静的解析による推定値を実測値で検証するためのk6負荷テストスクリプトを生成したりすることもできます。
できること
- 1システム図の視覚化プロジェクト内のすべてのコンポーネントがどのように相互作用しているか、AIに視覚的な表現を作成させます。
- 2並行処理限界の推定現在のアーキテクチャが処理できる最大同時リクエスト数を特定します。
- 3パフォーマンスボトルネックの特定システムの透過性を制限しているスタック内の特定のレイヤーを見つけ出します。
- 4コードベースの依存関係マップ作成ソースファイルと、データベースやLLMプロバイダーなどの外部サービスとの関係を可視化します。
プロジェクトの README から作成されています。すべてのユースケースは、その引用と照らし合わせて確認されています。
Workflow Generator MCPのインストール方法
フォーマット検証日 2026年11月10日Cursor に追加Gooseに追加Claude CodeにWorkflow Generator MCPをインストール
$ claude mcp add workflow-generator -- uvx workflow-generator-mcpCursorにWorkflow Generator MCPをインストール
~/.cursor/mcp.json
{
  "mcpServers": {
    "workflow-generator": {
      "command": "uvx",
      "args": [
        "workflow-generator-mcp"
      ]
    }
  }
}VS CodeにWorkflow Generator MCPをインストール
.vscode/mcp.json
{
  "servers": {
    "workflow-generator": {
      "type": "stdio",
      "command": "uvx",
      "args": [
        "workflow-generator-mcp"
      ]
    }
  }
}VS Code CLIにWorkflow Generator MCPをインストール
$ code --add-mcp '{"name":"workflow-generator","type":"stdio","command":"uvx","args":["workflow-generator-mcp"]}'Claude DesktopにWorkflow Generator MCPをインストール
claude_desktop_config.json
{
  "mcpServers": {
    "workflow-generator": {
      "command": "uvx",
      "args": [
        "workflow-generator-mcp"
      ]
    }
  }
}CodexにWorkflow Generator MCPをインストール
$ codex mcp add workflow-generator -- uvx workflow-generator-mcpCodex config.tomlにWorkflow Generator MCPをインストール
~/.codex/config.toml
[mcp_servers.workflow-generator]
command = "uvx"
args = ["workflow-generator-mcp"]
Gemini CLIにWorkflow Generator MCPをインストール
$ gemini mcp add -s user workflow-generator uvx -- workflow-generator-mcpGemini settings.jsonにWorkflow Generator MCPをインストール
~/.gemini/settings.json
{
  "mcpServers": {
    "workflow-generator": {
      "command": "uvx",
      "args": [
        "workflow-generator-mcp"
      ]
    }
  }
}自動チェック
実行日 2026年11月14日完全なレポート →自動チェックに合格しました。これはセキュリティ監査ではありません。コードを読み、サーバーに必要最小限のアクセス権を与えてください。 チェックの仕組み

- ソースリポジトリがリンクされており、アクセス可能askuma/workflow-generator is public and reachablegithub.com/askuma/workflow-generator ↗合格
- パッケージがこのリポジトリをソースとして指定workflow-generator-mcp names askuma/workflow-generator as sourcepypi.org/project/workflow-generator-mcp/ ↗合格
- ビルドの来歴 (Sigstore 証明)Sigstore attestation for workflow-generator-mcppypi.org/project/workflow-generator-mcp/ ↗合格
- オープンソースライセンス (OSI)MITspdx.org/licenses/MIT.html ↗合格
- 過去1年以内にコミットまたはリリースありLast commit or release 2026-10-26github.com/askuma/workflow-generator ↗合格
- OpenSSF Scorecard未チェック
- パッケージ名が有名なパッケージに酷似していないNo popular package one edit away from workflow-generator-mcp合格
- パッケージおよびその依存関係に重大な勧告なし29 resolved dependencies checked; no critical advisoryosv.dev ↗合格
- モデルへの隠れた指示がない0 tool descriptions and the README read; no override phrases, credential paths or hidden characters合格
- 破壊的なツールがラベル付けされている未チェック
- リモートエンドポイントが MCP ハンドシェイクに応答未チェック
README
GitHubで見るworkflow-generator
Scan any project and generate WORKFLOW.html — a dark-mode visual system diagram showing every component, how they talk to each other, and where your throughput ceiling actually is.
Works with Python, Node.js, Go, Java, Rust, Ruby, and mixed projects. No external dependencies for the core scanner.
Vendored and generated directories (node_modules, venv, site-packages, dist, …) are never scanned,
and capacity figures are clearly labeled as static-analysis estimates.
Live demo → — generated from fastapi/full-stack-fastapi-template, unmodified.
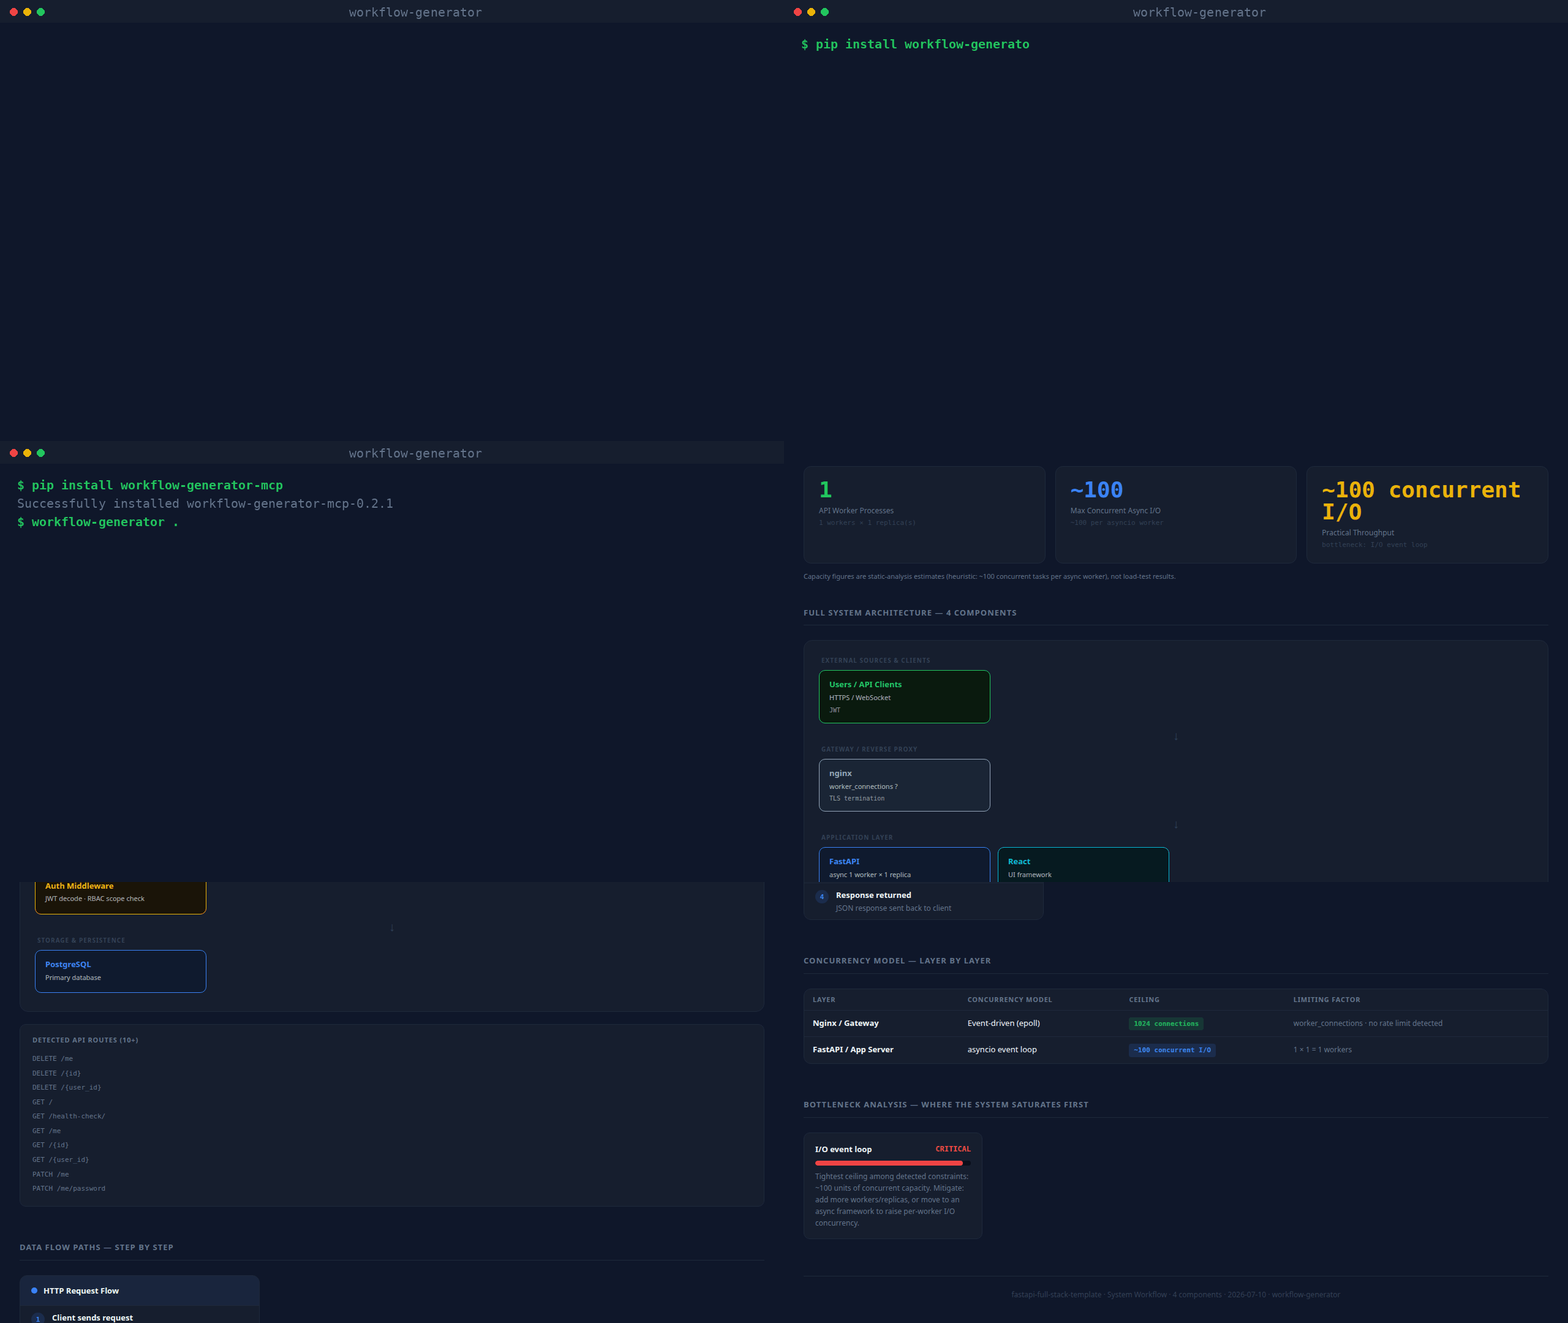
(real CLI output, unscripted — static screenshot if you'd rather not autoplay)
What it produces
Every generated page contains:
| Section | What you get |
|---|---|
| Stat row | Workers · Concurrent I/O ceiling · Semaphore limit · Rate limit · Practical throughput |
| Architecture diagram | Layered flow: external sources → gateway → API → queues → AI → storage |
| Data flow cards | Write path, read/query path, background jobs — inferred from what's detected |
| Concurrency table | Every layer: model · ceiling · limiting factor |
| Bottleneck analysis | Ranked CRITICAL → LOW with mitigation notes |
| Codebase dependency graph | Force-directed module/import graph — click a node to isolate its neighbors, hover for file details. Import-direction edges are clearly distinguished from real observed traffic (see below) |
| Guided tour | Spotlight walkthrough of every section, shown automatically the first time a report is opened; replay anytime with the ? button |
Codebase dependency graph
Every source file (Python, JS/TS, Go, Java, Rust, Ruby) becomes a node; every real import becomes
an edge — resolved with a language-appropriate parser (Python's ast module, regex for JS/TS/Go/
Java/Rust/Ruby), not guessed. Files that match an already-detected component (an LLM call, a
database client, a queue) get an edge to that component too, so you can see exactly which files
talk to Redis, OpenAI, etc. Large repos (350+ files) are automatically aggregated into
directory-level nodes so the graph stays readable; override with --graph-detail files or
--graph-detail dirs.
Test files (tests/, test_*.py, conftest.py, *.spec.ts, *_test.go, …) get their own
Test Graph section below the main one, showing which modules and services each test reaches.
Fixtures and test doubles name every service they exercise, so keeping them in the main graph
buries the real dependency structure under service edges.
Both sections have a Flow | Graph toggle over the same nodes and edges. Flow (the default up to 80 nodes) is a left-to-right layered diagram: columns are dependency depth from the sources (HTTP entry and files nothing imports), every detected service is its own node in the last column, and import cycles are drawn dashed. Graph is the force-directed view. Moving dots show data going both ways: a filled dot is the call/request, a hollow dot the return/response. On graphs with more than 60 edges, only the paths of the clicked or hovered node animate. Search, "hide isolated" and the selected node are shared between the two views.
The older layered Full System Architecture diagram is collapsed by default, since the Architecture Map covers the same ground.
By default the graph only shows what the code says (import direction, static "this file calls
Redis"), which is honest but not the same as real traffic. Pass --access-log /path/to/access.log
(any combined/common log format) to overlay real observed request counts onto the HTTP-entry
edges — and the generated report includes a ready-to-run k6 load-test script
covering up to 5 detected routes, so the "Practical throughput" number can be checked against a
real measurement instead of only a static-analysis estimate.
What it detects
| Category | Examples |
|---|---|
| API frameworks | FastAPI, Flask, Django, Express, Nest.js, Gin |
| Gateways | nginx, Caddy, Traefik (with rate limits + worker_connections) |
| LLM providers | OpenAI, Anthropic Claude, Cohere, AWS Bedrock |
| Vector stores | Qdrant, Pinecone, Weaviate, ChromaDB, pgvector, FAISS, Milvus |
| Databases | PostgreSQL, MySQL, MongoDB, SQLite, Redis |
| Queues | Celery, BullMQ, Kafka, RabbitMQ, RQ, AWS SQS |
| Async primitives | asyncio.Semaphore, run_in_executor, asyncio.gather, asyncio.Lock |
| Workers | --workers N (uvicorn/gunicorn), replicas: (docker-compose), PM2 instances |
| External sources | Jira, Azure DevOps, Slack, GitHub, Stripe, Salesforce, Twilio |
| Evaluation | TruLens, RAGAS, LangSmith |
Install
pip (CLI + MCP server)
pip install workflow-generator-mcp

workflow-generator . WORKFLOW.html       # CLI: scan and write the report
workflow-generator-mcp                    # stdio MCP server
With pip installed, any MCP host config reduces to:
{
  "mcpServers": {
    "workflow-generator": { "command": "workflow-generator-mcp" }
  }
}
Claude Code (skill)
mkdir -p ~/.claude/skills
git clone https://github.com/askuma/workflow-generator.git ~/.claude/skills/workflow-generator
Then in any Claude Code session:
/workflow-generator
/workflow-generator /path/to/project
MCP server (Claude Desktop, VS Code, Cursor, Zed, Windsurf, Continue)
1. Install the dependency:
pip install mcp
2. Add to your MCP host config (replace ~ with your actual home path):
~/Library/Application Support/Claude/claude_desktop_config.json (Mac)
%APPDATA%\Claude\claude_desktop_config.json (Windows)
{
  "mcpServers": {
    "workflow-generator": {
      "command": "python3",
      "args": ["~/.claude/skills/workflow-generator/mcp/server.py"]
    }
  }
}
.vscode/mcp.json
{
  "servers": {
    "workflow-generator": {
      "type": "stdio",
      "command": "python3",
      "args": ["~/.claude/skills/workflow-generator/mcp/server.py"]
    }
  }
}
~/.cursor/mcp.json
{
  "mcpServers": {
    "workflow-generator": {
      "command": "python3",
      "args": ["~/.claude/skills/workflow-generator/mcp/server.py"]
    }
  }
}
.zed/settings.json
{
  "context_servers": {
    "workflow-generator": {
      "command": {
        "path": "python3",
        "args": ["~/.claude/skills/workflow-generator/mcp/server.py"]
      }
    }
  }
}
~/.windsurf/mcp_config.json
{
  "mcpServers": {
    "workflow-generator": {
      "command": "python3",
      "args": ["~/.claude/skills/workflow-generator/mcp/server.py"]
    }
  }
}
3. Restart your tool, then ask:
generate a workflow diagram for this project
how many concurrent requests can this handle?
show me the system architecture
MCP tools exposed:
generate_workflow— scans project, writesWORKFLOW.html, optionally opens in browseranalyze_workflow— returns structured JSON summary (no file written)
Command line (standalone)
No install needed beyond Python 3.8+:
python3 ~/.claude/skills/workflow-generator/scripts/analyze.py . ~/WORKFLOW.html
# then open ~/WORKFLOW.html
Optional flags:
--access-log /path/to/access.log   # overlay real request counts onto the dependency graph
--graph-detail auto|files|dirs     # force file-level or directory-level graph nodes (default: auto)
Example output (terminal)
Written: /your/project/WORKFLOW.html
Framework: FastAPI · Workers: 8 · Concurrent I/O: ~800
Practical throughput: ~50–200 req/min
Bottleneck: OpenAI (LLM latency 3–30s per call)
Gateway: nginx · 2 rate limit zone(s)
LLM: OpenAI · eval: TruLens RAG Triad
Storage: Qdrant, Redis
External sources: Jira, Azure DevOps, Slack
Repo layout
workflow-generator/
├── SKILL.md                        ← Claude Code skill definition
├── INSTALL.md                      ← detailed per-platform install guide
├── workflow_generator_mcp/
│   ├── analyze.py                  ← core scanner + HTML renderer (stdlib only)
│   └── server.py                   ← MCP stdio server (package form)
├── scripts/
│   └── analyze.py                  ← thin compatibility shim -> workflow_generator_mcp/analyze.py
├── tests/                          ← pytest suite for the scanner
├── mcp/
│   ├── server.py                   ← MCP stdio server
│   └── requirements.txt            ← pip install mcp
└── copilot/
    ├── index.js                    ← GitHub Copilot Extension (Express)
    ├── package.json
    └── openai_function.json
License
MIT
Workflow Generator MCPのよくある質問
Workflow Generator MCPをClaude Codeに追加するには
ターミナルでclaude mcp add workflow-generator -- uvx workflow-generator-mcpを実行します。すべてのプロジェクトで利用するには--scope userを追加します。
Workflow Generator MCPをCursorに追加するには
~/.cursor/mcp.jsonを開き、上記のインストールセクションに示すCursor設定を使ってmcpServersの下にサーバーを追加します。
対応しているプログラミング言語は何ですか?
Python、Node.js、Go、Java、Rust、Ruby、およびこれらが混在するプロジェクトに対応しています。
node_modulesや仮想環境もスキャン対象に含まれますか?
いいえ、node_modules、venv、site-packagesなどの外部ライブラリや生成されたディレクトリはスキャンから除外されます。
容量の数値はどの程度正確ですか?
容量の数値は、静的解析に基づく推定値として提供されます。
グラフに実際のトラフィックデータを重ね合わせることはできますか?
はい、アクセスログのパスを指定することで、HTTPエントリのエッジに実際の観測リクエスト数を重ねて表示できます。