
debugium MCPサーバー
✓ 検証済みリアルタイムのWeb UIと64個のMCPツールを備え、LLMと統合したデバッグセッションを可能にするAI駆動型のマルチ言語デバッガーを提供します。
別名 Algiras/debugium, @algiras/debugium
- スター
- 4
- ツール
- —
- ダウンロード数(30日間)
- 278
- 最新バージョン
- 1.0.0
- 最終コミット
- 2026年3月16日
- ライセンス
- —
debugium MCPとは
debugiumはMCPサーバーです。 リアルタイムのWeb UIと64個のMCPツールを備え、LLMと統合したデバッグセッションを可能にするAI駆動型のマルチ言語デバッガーを提供します。.
プロジェクトのREADMEから生成された概要
debugium MCP server について
Debugiumは、AI駆動のワークフローに深いコードインスペクションを統合したい開発者のために設計された、マルチ言語デバッグ環境を提供します。さまざまなDebug Adapter Protocolアダプターのプロキシとして機能することで、Python、JavaScript、TypeScript、C、C++、Rust、Java、Scala、WebAssemblyを含む幅広い言語をサポートしています。ユーザーは、ソースビューア、変数展開、コールスタックを備えたリアルタイムのWeb UI、または13個のサブコマンドを持つコマンドラインインターフェースを通じて、デバッグセッションを操作できます。
このサーバーはModel Context Protocolを通じてLLMとの統合ができるように構築されており、Claudeなどのクライアントに対して64個の特化型ツールを公開します。これらのツールにより、AIは「変数が変化するまでステップ実行する」「例外を説明する」「プログラム状態のスナップショットを比較する」といった複雑なタスクを実行できます。開発者はセッションをローカルで実行することも、コンテナや他のマシンで実行されているリモートプロセスにアタッチすることも可能です。また、システムはマルチセッション管理とセッションのエクスポート/インポートをサポートしており、異なるワークセッション間でデバッグの知見を保持できます。
できること
- 1状態変化のモニタリング特定の変数の値が変更されるまでコードを実行するよう、AIに指示できます。
- 2リモートプロセスのインスペクション別のマシンやコンテナですでに実行されているプロセスにデバッガーを接続できます。
- 3コンテキストに基づいたデバッグスナップショットLLMは、ソースコードやローカル変数を含むプログラムの現在の全状態を、単一のリクエストで取得できます。
プロジェクトの README から作成されています。すべてのユースケースは、その引用と照らし合わせて確認されています。
debugium MCPのインストール方法
フォーマット検証日 2026年11月10日Cursor に追加Gooseに追加Claude Codeにdebugium MCPをインストール
$ claude mcp add debugium -- npx -y @algiras/debugiumCursorにdebugium MCPをインストール
~/.cursor/mcp.json
{
  "mcpServers": {
    "debugium": {
      "command": "npx",
      "args": [
        "-y",
        "@algiras/debugium"
      ]
    }
  }
}VS Codeにdebugium MCPをインストール
.vscode/mcp.json
{
  "servers": {
    "debugium": {
      "type": "stdio",
      "command": "npx",
      "args": [
        "-y",
        "@algiras/debugium"
      ]
    }
  }
}VS Code CLIにdebugium MCPをインストール
$ code --add-mcp '{"name":"debugium","type":"stdio","command":"npx","args":["-y","@algiras/debugium"]}'Claude Desktopにdebugium MCPをインストール
claude_desktop_config.json
{
  "mcpServers": {
    "debugium": {
      "command": "npx",
      "args": [
        "-y",
        "@algiras/debugium"
      ]
    }
  }
}Codexにdebugium MCPをインストール
$ codex mcp add debugium -- npx -y @algiras/debugiumCodex config.tomlにdebugium MCPをインストール
~/.codex/config.toml
[mcp_servers.debugium]
command = "npx"
args = ["-y", "@algiras/debugium"]
Gemini CLIにdebugium MCPをインストール
$ gemini mcp add -s user debugium npx -- -y @algiras/debugiumGemini settings.jsonにdebugium MCPをインストール
~/.gemini/settings.json
{
  "mcpServers": {
    "debugium": {
      "command": "npx",
      "args": [
        "-y",
        "@algiras/debugium"
      ]
    }
  }
}自動チェック
実行日 2026年11月15日完全なレポート →自動チェックに合格しました。これはセキュリティ監査ではありません。コードを読み、サーバーに必要最小限のアクセス権を与えてください。 チェックの仕組み · 点数を上げるための改善点

- ソースリポジトリがリンクされており、アクセス可能algiras/debugium is public and reachablegithub.com/algiras/debugium ↗合格
- パッケージがこのリポジトリをソースとして指定@algiras/debugium names algiras/debugium as sourcenpmjs.com/package/@algiras/debugium ↗合格
- ビルドの来歴 (Sigstore 証明)No build attestation published for this release未チェック
- オープンソースライセンス (OSI)No license検出事項
- 過去1年以内にコミットまたはリリースありLast commit or release 2026-03-16github.com/algiras/debugium ↗合格
- OpenSSF Scorecard未チェック
- パッケージ名が有名なパッケージに酷似していないNo popular package one edit away from @algiras/debugium合格
- パッケージおよびその依存関係に重大な勧告なし1 resolved dependencies checked; no critical advisoryosv.dev ↗合格
- モデルへの隠れた指示がない0 tool descriptions and the README read; no override phrases, credential paths or hidden characters合格
- 破壊的なツールがラベル付けされている未チェック
- リモートエンドポイントが MCP ハンドシェイクに応答未チェック
README
GitHubで見るDebugium
A multi-language debugger with a real-time web UI and LLM integration via MCP.
Debug Python, JavaScript, TypeScript, C, C++, Rust, Java, Scala, and WebAssembly programs from your browser — with AI-driven analysis through the Model Context Protocol.


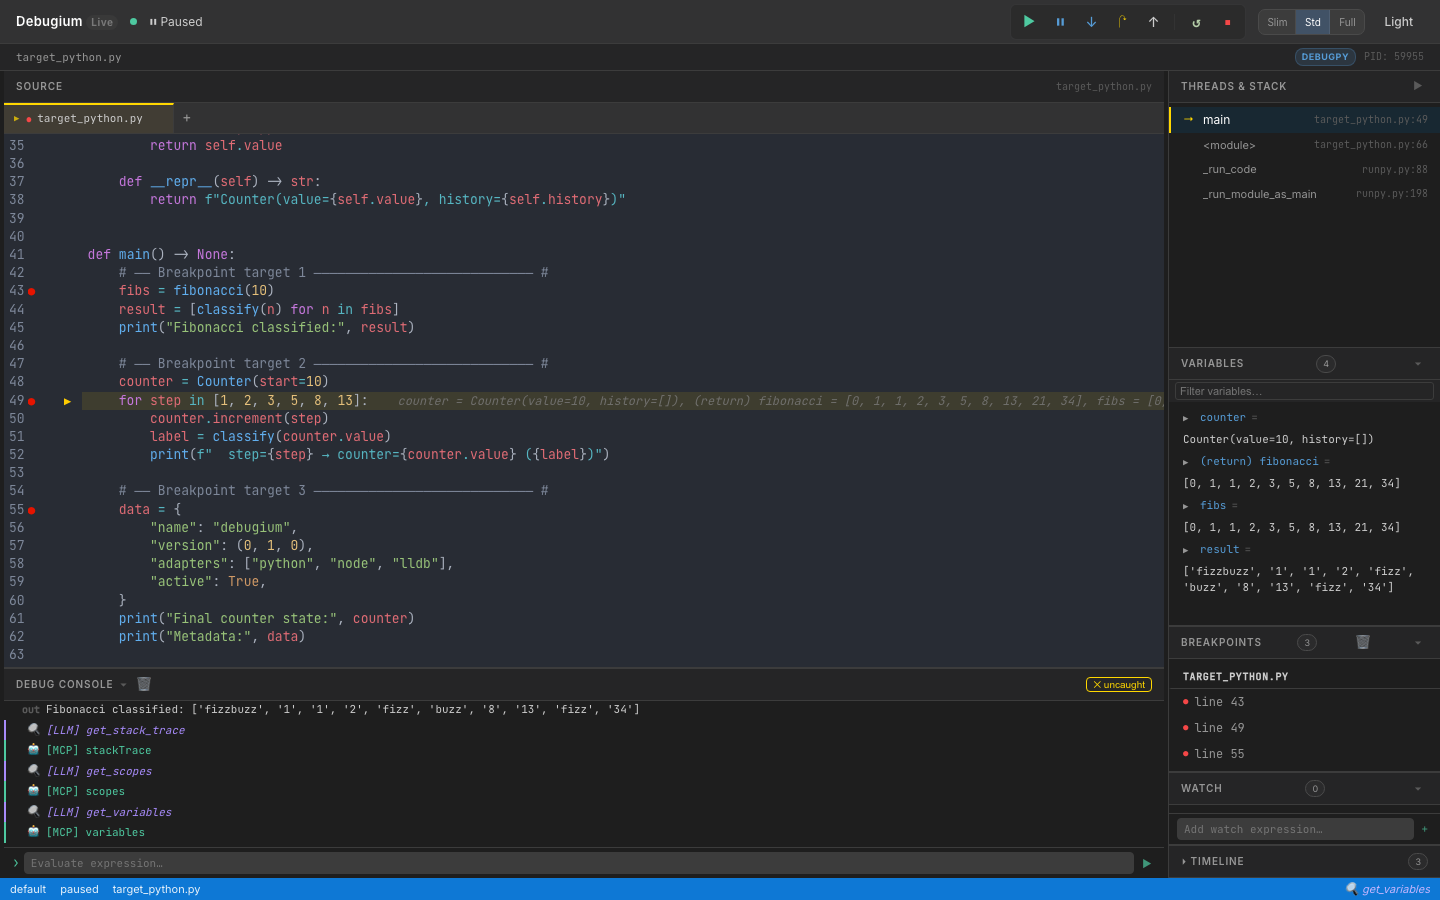
Features
Web UI
- Real-time web UI — source viewer, breakpoints, variables (recursive expansion), call stack, console, timeline, watch expressions, findings — all updated live via WebSocket
- Multi-tab source viewer — open multiple files, click stack frames to navigate
- Variable search — filter variables by name with recursive expansion
- Changed-variable highlighting — variables that changed since last stop shown in orange
- Thread selector — switch between threads in multi-threaded programs
- Panel collapse & resize — drag to resize, toggle to collapse; Slim / Standard / Full layout presets
- Dark / light mode toggle
- Auto-reconnect — UI reconnects after a dropped WebSocket, with visual status indicator
- Keyboard shortcuts — F5 continue, F10 step over, F11 step in, Shift+F11 step out, Ctrl/Cmd+D dark mode
- Button animations — in-flight spinner and completion flash for debug commands
Debugging
- Multi-language — Python (debugpy), Node.js/TypeScript (js-debug), C/C++/Rust (lldb-dap), Java (java-debug), Scala (Metals), WebAssembly (lldb-dap), or any DAP adapter via
dap.json - Comprehensive DAP coverage — 35+ DAP requests: breakpoints, stepping, goto, memory read/write, disassembly, and more
- Breakpoints — conditional, logpoints, hit-count, function, data (watchpoints), exception, run-to-cursor (
continue_until) - Multi-session — debug multiple programs simultaneously, with child session routing (js-debug)
- Remote debugging — attach to debugpy, JDWP, or Node inspector running on another machine or container
LLM / MCP Integration
- 64 MCP tools — the full debug session exposed to Claude or any LLM
- Capability-gated tools — tools automatically shown/hidden based on adapter capabilities
- Compound tools —
get_debug_context(orient in one call),step_until,step_until_change,run_until_exception,explain_exception,get_call_tree,compare_snapshots,find_first_change - Execution timeline — every stop recorded with changed variables and stack summary
- Watch expressions — evaluated automatically at every breakpoint, manageable by LLM or UI
- Annotations & findings — pin notes to source lines, record conclusions visible in the UI
- Session export/import — save and restore debugging knowledge across sessions
CLI Control
- Full CLI — 13 subcommands to drive sessions from a second terminal without the web UI
- Auto-discovery — port file at
~/.debugium/port, session logs in~/.debugium/sessions/
Install
Claude Code Plugin (recommended)
/plugin marketplace add Algiras/debugium
/plugin install debugium@debugium
Then add to your project's .mcp.json (see MCP Tools below).
macOS / Linux binary
curl -fsSL https://raw.githubusercontent.com/Algiras/debugium/main/install.sh | bash
From source
# Prerequisites: Rust stable + wasm-pack
cargo install wasm-pack

# Build UI
wasm-pack build crates/debugium-ui --target web --out-dir pkg
cp crates/debugium-ui/pkg/cm_init.js         crates/debugium-ui/dist/pkg/
cp crates/debugium-ui/pkg/debugium_ui.js      crates/debugium-ui/dist/pkg/
cp crates/debugium-ui/pkg/debugium_ui_bg.wasm crates/debugium-ui/dist/pkg/

# Build & install server
cargo install --path crates/debugium-server
Usage
Debug a Python file
debugium launch my_script.py --adapter python
Debug a Node.js / TypeScript file
debugium launch app.js --adapter node
debugium launch app.ts --adapter typescript
Debug C / C++ / Rust
# C or C++ (compile with -g for debug info)
cc -g -O0 main.c -o main && debugium launch ./main --adapter lldb
c++ -g -O0 main.cpp -o main && debugium launch ./main --adapter lldb

# Rust
cargo build && debugium launch target/debug/my_binary --adapter lldb
Debug Java / Scala
# Java (requires microsoft/java-debug adapter)
debugium launch MainClass --adapter java

# Scala (connect to a running Metals DAP server)
debugium launch build-target --adapter metals
debugium launch build-target --adapter metals:5005  # custom port
Attach to a running process (remote debugging)
# Python (debugpy listening on port 5678)
debugium attach --port 5678 --adapter python

# Java (JDWP on port 5005)
debugium attach --port 5005 --adapter java

# Node.js (inspector on port 9229)
debugium attach --port 9229 --adapter node
Or via MCP: attach_session(port=5678, adapter="python", breakpoints=["/path/app.py:42"])
Use a custom adapter via dap.json
# Create a dap.json (see dap.json.example) then:
debugium launch my_program --config ./dap.json

# Or place dap.json in cwd / .debugium/ for auto-discovery:
debugium launch my_program   # finds ./dap.json automatically
Set initial breakpoints
debugium launch my_script.py --adapter python \
  --breakpoint /abs/path/my_script.py:42 \
  --breakpoint /abs/path/helpers.py:15
Enable LLM / MCP integration
Add a .mcp.json to your project root (Claude Code picks this up automatically):
{
  "mcpServers": {
    "debugium": {
      "command": "debugium",
      "args": ["mcp"]
    }
  }
}
Then launch the session normally — the MCP server connects to whichever port is active:
debugium launch my_script.py --adapter python --breakpoint /abs/path/my_script.py:42
Claude Code will now have access to all Debugium MCP tools. See CLAUDE.md for the recommended workflow and SKILL.md for the full tool reference.
CLI Control Commands
Once a session is running (debugium launch …), you can drive it from a second terminal — or from an LLM agent — without touching the web UI.
Port is auto-discovered from ~/.debugium/port; override with --port.
Global flags (all subcommands)
| Flag | Default | Description |
|---|---|---|
--port PORT |
~/.debugium/port |
Server port to connect to |
--session ID |
default |
Session to target |
--json |
off | Print raw JSON instead of human-readable output |
Inspection
debugium sessions                  # list active sessions
debugium threads                   # list threads
debugium stack                     # show call stack
debugium vars                      # show local variables (auto-resolves top frame)
debugium vars --frame-id 2         # show variables for a specific frame
debugium eval "len(fibs)"          # evaluate expression in top frame
debugium eval "x + 1" --frame-id 2
debugium source path/to/file.py    # print full source file
debugium source path/to/file.py --line 43  # windowed ±10 lines with → marker
debugium context                   # full snapshot: paused-at, stack, locals, source, breakpoints
debugium context --compact         # same but truncated (3 frames, 10 vars)
Breakpoints
debugium bp set FILE:LINE [FILE:LINE …]   # set breakpoints (replaces existing in that file)
debugium bp list                          # list all breakpoints
debugium bp clear                         # clear all breakpoints
Execution control
debugium continue                  # resume execution
debugium step over                 # step over (next line)
debugium step in                   # step into a function call
debugium step out                  # step out of current function
UI annotations (visible in the web UI)
debugium annotate FILE:LINE "message" [--color info|warning|error]
debugium finding "message"         [--level  info|warning|error]
Example workflow
# Terminal A — start the session
debugium launch tests/target_python.py --adapter python \
  --breakpoint "$(pwd)/tests/target_python.py:43"

# Terminal B (or LLM agent) — inspect and drive it
debugium sessions
debugium stack
debugium vars
debugium eval "len(fibs)"
debugium bp set tests/target_python.py:49
debugium continue                  # runs to line 49
debugium vars
debugium step over
debugium context --json            # machine-readable snapshot
debugium annotate tests/target_python.py:43 "called here" --color info
debugium finding "fibs has 10 elements" --level info
debugium bp clear
MCP Tools
When connected via MCP, 64 tools are available. Key ones:
| Category | Tools |
|---|---|
| Orient | get_debug_context ★ (paused location + locals + stack + source in one call) |
| Breakpoints | set_breakpoint, set_breakpoints, set_logpoint, list_breakpoints, clear_breakpoints, set_function_breakpoints, set_exception_breakpoints, set_data_breakpoint, list_data_breakpoints, clear_data_breakpoints, breakpoint_locations |
| Execution | continue_execution, step_over, step_in, step_out, pause, goto, disconnect, terminate, restart |
| Inspection | get_stack_trace, get_scopes, get_variables, evaluate, get_threads, get_source, get_capabilities, loaded_sources, source_by_reference, step_in_targets |
| Mutation | set_variable, set_expression |
| Output | get_console_output, wait_for_output (with from_line to avoid stale matches) |
| Memory | read_memory, write_memory, disassemble (native debugging) |
| History | get_timeline, get_variable_history, compare_snapshots, find_first_change |
| Annotations | annotate, get_annotations, add_finding, get_findings |
| Watches | add_watch, remove_watch, get_watches |
| Compound | step_until, step_until_change, continue_until, run_until_exception, explain_exception, get_call_tree, restart_frame |
| Session | get_sessions, list_sessions, launch_session, attach_session, stop_session, export_session, import_session |
| Control | goto_targets, cancel_request |
Note:
step_over,step_in, andstep_outare blocking — they wait for the adapter to pause before returning. Safe to chain back-to-back without sleeps.continue_executionreturnsconsole_line_countfor use withwait_for_output. Tools likeread_memory,goto, andrestart_frameonly appear when the adapter supports them.
See SKILL.md for the full reference with input schemas.
Keyboard Shortcuts
| Key | Action |
|---|---|
F5 |
Continue |
F10 |
Step Over |
F11 |
Step Into |
Shift+F11 |
Step Out |
Ctrl/⌘+D |
Toggle dark/light mode |
Architecture
debugium-server (Rust + Axum)
├── DAP proxy     — spawns / attaches to debug adapters (debugpy, js-debug, lldb-dap, java-debug, Metals, custom)
├── HTTP API      — /state, /sessions, /annotations, /findings, /watches, /timeline
├── WebSocket     — broadcasts DAP events + enriched stop data (changed vars, timeline) to UI
├── MCP stdio     — JSON-RPC 2.0 server exposing 64 tools for LLM integration
├── CLI control   — 13 subcommands to drive sessions from a second terminal
└── ~/.debugium/  — port file, session logs (events.ndjson), debug log

debugium-ui (Leptos + WASM)
├── CodeMirror 6  — source viewer with breakpoint gutters, exec arrow, LLM annotations, multi-tab
├── Reactive panels — Variables, Stack, Breakpoints, Findings, Watch, Timeline, Console (18 components)
└── WebSocket     — receives events, sends DAP commands, auto-reconnects with status indicator
Supported Languages & Adapters
| Language | --adapter flag |
Prerequisite | Verified |
|---|---|---|---|
| Python | python / debugpy |
pip install debugpy |
✅ |
| Node.js | node / js |
js-debug (bundled or build from vscode-js-debug) | ✅ |
| TypeScript | typescript / ts / tsx |
js-debug + tsx or ts-node in PATH |
✅ |
| C / C++ | lldb / codelldb |
lldb-dap (Xcode on macOS; apt install lldb on Linux) |
✅ |
| Rust | lldb / rust |
lldb-dap + cargo build |
✅ |
| Java | java / jvm |
microsoft/java-debug adapter JAR | ✅ |
| Scala | metals / scala |
Running Metals DAP server | ⚠️ (requires running Metals) |
| WebAssembly | wasm |
lldb-dap (LLVM ≥16) |
⚠️ (requires WASM-aware LLVM) |
| Any DAP adapter | --config dap.json |
See dap.json.example |
✅ |
Remote debugging
Connect to a DAP server running on another machine (or in a container):
{
  "adapterId": "debugpy",
  "request": "attach",
  "host": "192.168.1.100",
  "port": 5678,
  "pathMappings": [{ "localRoot": ".", "remoteRoot": "/app" }]
}
debugium launch app.py --config remote.json
License
MIT
debugium MCPのよくある質問
debugium MCPをClaude Codeに追加するには
ターミナルでclaude mcp add debugium -- npx -y @algiras/debugiumを実行します。すべてのプロジェクトで利用するには--scope userを追加します。
debugium MCPをCursorに追加するには
~/.cursor/mcp.jsonを開き、上記のインストールセクションに示すCursor設定を使ってmcpServersの下にサーバーを追加します。
Debugiumがサポートしているプログラミング言語は何ですか?
Python、JavaScript、TypeScript、C、C++、Rust、Java、Scala、およびWebAssemblyをサポートしています。
利用可能なMCPツールは何個ありますか?
ブレークポイント、実行制御、インスペクション、ミューテーション用のツールを含む、64個のMCPツールが利用可能です。
別のマシンで実行されているプロセスをデバッグできますか?
はい、リモートデバッグを使用して、別のマシンやコンテナで実行されているdebugpy、JDWP、またはNode inspectorにアタッチできます。
LLMとの統合を有効にするにはどうすればよいですか?
プロジェクトのルートに、mcp引数とともにdebugiumコマンドを指定した.mcp.jsonを追加することで有効にできます。