
AgentLatch MCPサーバー
コミット 2026年11月15日AIエージェントのコードをスキャンしてセキュリティリスクを特定し、シークレットをマスキングしながらMCP toolのトラフィックを監視します。
別名 AgentLatch/agent-latch
- スター
- 11
- ツール
- —
- ダウンロード数(30日間)
- —
- 最新バージョン
- —
- 最終コミット
- 2026年11月15日
- ライセンス
- MIT
AgentLatch MCPとは
AIエージェントのコードをスキャンしてセキュリティリスクを特定し、シークレットをマスキングしながらMCP toolのトラフィックを監視します。
プロジェクトのREADMEから生成された概要
AgentLatch MCP server について
agent-latchは、コード内の脆弱性を特定し、ツール間のインタラクションを監視することで、AIエージェントプロジェクトのセキュリティを強化します。開発者は静的スキャナーを使用して、実行前にPythonエージェントのコード、プロンプトテンプレート、およびエージェントマニフェスト内のリスクのあるパターンを監査できます。このツールは、ターミナル、JSON、またはSARIF形式で結果を報告し、GitHub Actionsやpre-commit hookを使用してワークフローに統合できます。
リアルタイムの監視には、agent-latch-runtimeがAIエージェントとModel Context Protocol (MCP) serverの間のローカルファーストなプロキシとして機能します。このプロキシは、シークレットを自動的にマスキングしながら、toolのリスト、呼び出し、結果、およびプロンプトを記録します。これはモニターとしてのみ機能するため、呼び出しをブロックしたり変更したりすることなく、トラフィックを観察します。ローカルファーストであるため、オプションの依存関係監査(パッケージ名をアドバイザリサービスに送信するもの)を除き、すべてのプロジェクトファイルとスキャン結果はお使いのマシン内に保持されます。
できること
- 1MCP toolのトラフィックを監視機密情報をマスキングしながら、実行中にエージェントがツールを使用して何を行うかを観察します。
- 2CIでのセキュリティチェックの自動化セキュリティスキャンをプルリクエストのワークフローに統合し、高深刻度のリスクが検出された場合にビルドを失敗させます。
- 3ログの整合性を検証改ざん防止機能を持つ台帳を使用して、ランタイムログが編集または削除されていないことを確認します。
プロジェクトの README から作成されています。すべてのユースケースは、その引用と照らし合わせて確認されています。
自動チェック
実行日 2026年11月14日完全なレポート →まだ検証されていません。サーバーには80点のスコア、重大な問題がないこと、および検証に必要な十分なデータが必要です。 チェックの仕組み · 点数を上げるための改善点

- ソースリポジトリがリンクされており、アクセス可能agentlatch/agent-latch is public and reachablegithub.com/agentlatch/agent-latch ↗合格
- パッケージがこのリポジトリをソースとして指定未チェック
- ビルドの来歴 (Sigstore 証明)未チェック
- オープンソースライセンス (OSI)MITspdx.org/licenses/MIT.html ↗合格
- 過去1年以内にコミットまたはリリースありLast commit or release 2026-11-14github.com/agentlatch/agent-latch ↗合格
- OpenSSF Scorecard未チェック
- パッケージ名が有名なパッケージに酷似していない未チェック
- パッケージおよびその依存関係に重大な勧告なし未チェック
- モデルへの隠れた指示がないInstruction aimed at the model found in the description or README検出事項
- 破壊的なツールがラベル付けされている未チェック
- リモートエンドポイントが MCP ハンドシェイクに応答未チェック
README
GitHubで見るAgentLatch — Local-First AI Agent Security Scanner and MCP Traffic Monitor




Find selected security risks in AI-agent projects before you run them, and see what your agent does with its MCP tools while it runs. AgentLatch is an open-source, local-first AI agent security toolkit with two parts:
- Static scanner (
agent-latch scan): checks Python agent code, agent manifests (tools, permissions, authentication) and prompt templates, optionally audits pinned Python dependencies, and reports evidence in your terminal, JSON or SARIF. Run it from the command line, as a pre-commit hook or as a GitHub Action. - Runtime proxy for MCP, preview (
agent-latch-runtime): sits between an AI agent and a Model Context Protocol (MCP) server and records every tool list, tool call, result and prompt, with secrets masked. Monitor only: it never blocks or changes traffic.
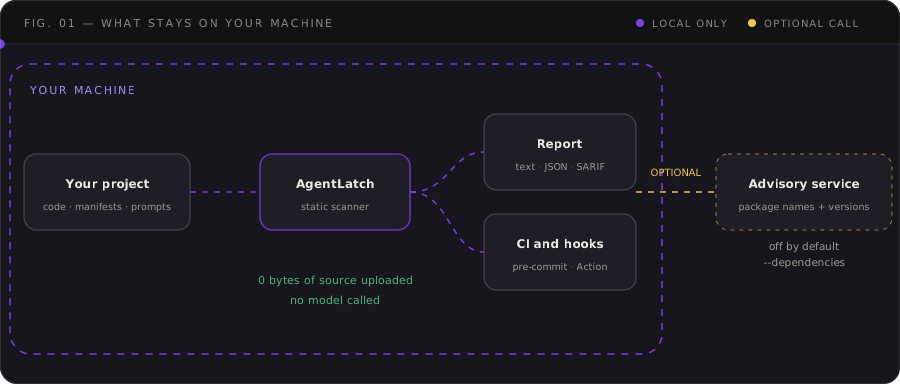
Project status: early proof of concept. AgentLatch is not a complete vulnerability scanner, runtime protection system, security score, or certification. A clean scan means only that the enabled checks did not report a finding. The runtime proxy records traffic and runs two preview gates: ALR03 on the connection handshake and ALR04 on MCP tool definitions. It reports findings and does not block calls.
What AgentLatch does so far
AgentLatch checks an AI agent at three points, and you can use each on its own:
- Static scan: reads an agent project's code, prompts and manifests before anything runs, and reports risky patterns with the file and line.
- Runtime monitor (preview): sits between an agent and its MCP server, records the tool traffic with secrets masked, and flags tool definitions that contain instruction-like content.
- Tamper-evident ledger (preview): seals that record in a hash chain, so an edited, deleted or rebuilt log shows up when you verify it.
Everything runs on your machine and nothing is uploaded. The only network use is the opt-in --dependencies audit. AgentLatch reports findings and never blocks a tool call, and a clean result is not a security guarantee.
Every section below follows the same four steps: what it does, Run it (copy-paste), See the result (the command that shows the output), and Go deeper (links).
| I want to… | Go to |
|---|---|
| Scan an agent project on my laptop | 1. Static scan |
| Fail a pull request on risky changes | 2. Static scan in CI |
| See what my agent asks its MCP tools to do | 3. Runtime monitor |
| Prove the runtime log was not edited | 4. Tamper-evident ledger |
| Hook up Claude, ChatGPT or Cursor | 5. Connect your app |
Contents
- What AgentLatch does so far
- Install once
- 1. Static scan (local)
- 2. Static scan in CI (GitHub Actions and pre-commit)
- 3. Runtime monitor for MCP (preview)
- 4. Tamper-evident ledger (preview)
- 5. Connect Claude, ChatGPT or Cursor
- How it works
- What the scanner checks today
- OWASP Agentic Top 10 coverage
- Documentation
- Why AgentLatch?
- Reports and data handling
- Important limitations
- FAQ
- Development and tests
- Roadmap
- Contributing and security reports
Install once
Requires Python 3.11+. pipx keeps AgentLatch in its own environment (Windows and other options: Getting started).
pipx install agentlatch-security
Sections 3 to 5 use the runtime proxy, which needs the runtime extra (it adds FastMCP). Install this instead if you want everything:
pipx install "agentlatch-security[runtime]"
Or use a virtual environment:
python3 -m venv .venv && source .venv/bin/activate
python -m pip install "agentlatch-security[runtime]"
Check it:
agent-latch -V
On PyPI, AgentLatch is published as agentlatch-security. It installs the agent-latch and agent-latch-runtime commands. The PyPI package named agentlatch is a separate project.
Prefer containers? Two images, ghcr.io/agentlatch/agent-latch (scanner) and ghcr.io/agentlatch/agent-latch-runtime (runtime proxy), run as a non-root user with pinned dependencies. See Container images:
docker run --rm -v "$PWD:/src:ro" ghcr.io/agentlatch/agent-latch:<version> scan . --fail-on high
New to Docker? The setup guide goes from installing Docker to a first scan and a recorded MCP session.
1. Static scan (local)
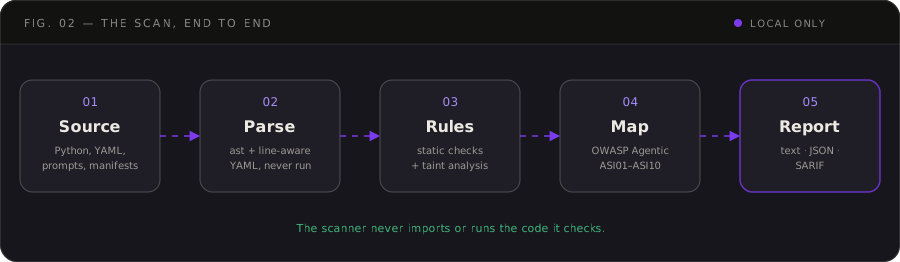
What it does: reads the files of an agent project (Python code, prompts, YAML, manifests) and reports risky patterns. It never imports or runs the code it checks. No configuration or manifest is needed: every folder and text file is scanned.
Run it:
agent-latch scan /path/to/my-agent
Try it on the deliberately insecure example in this repository:
git clone https://github.com/AgentLatch/agent-latch.git
agent-latch scan agent-latch/examples/vulnerable-agent
Common options:
agent-latch scan --config agent-manifest.yaml        # also audit a manifest's declared tools (optional)
agent-latch scan . --project-ignores                 # your own repo: apply its .agent-latch-ignore
agent-latch scan . --min-severity medium             # hide low and info findings (still counted)
agent-latch scan . --dependencies                    # add known-vulnerability checks (sends package names to PyPI)
agent-latch scan . --fail-on high                    # exit 1 on high-severity findings, for CI
agent-latch scan . --exclude tests/                  # skip a path for one run
agent-latch scan . --format sarif --output results.sarif
agent-latch --interactive                            # guided mode
Suppressions written inside the scanned project (.agent-latch-ignore, inline ignore comments) are not applied unless you add --project-ignores, so a project you scan cannot hide its own findings.
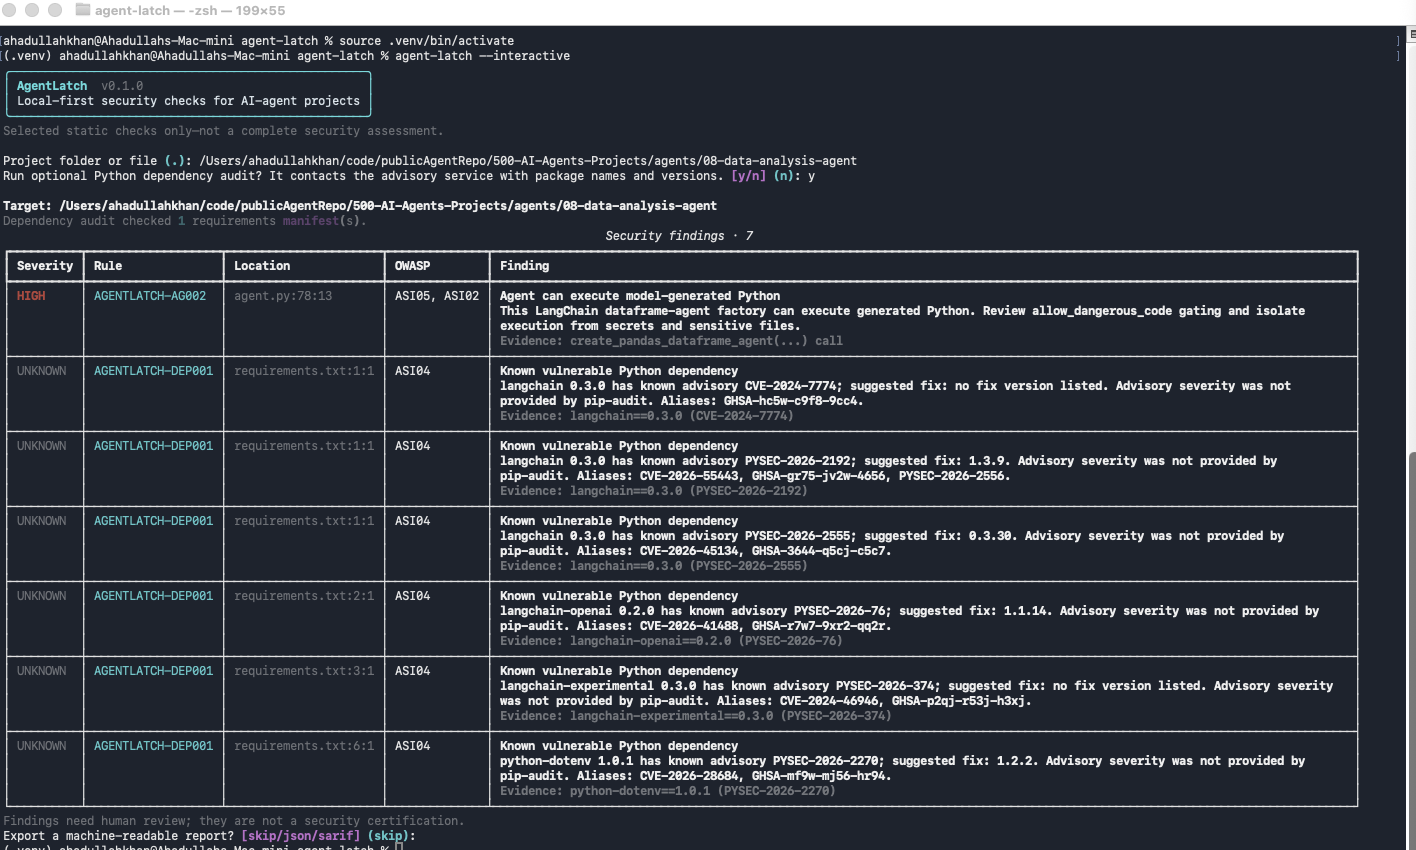
See the result: the terminal shows each finding with its rule, file and line, and OWASP mapping. This is real output for the example above (shortened):
Findings: 12

[HIGH] MAN001 (ALR09) High-risk tool without human approval
  agent-manifest.yaml:29:1
  Tool 'run_shell' can perform high-impact actions with no approval gate declared. ...
  Gate: ALR09 Human approval for sensitive actions
  OWASP Agentic: ASI02 Tool Misuse and Exploitation; ASI05 Unexpected Code Execution (RCE); ...
agent-latch scan . --plain                     # plain text, for logs and pipes
agent-latch scan . --format json               # machine-readable
agent-latch scan . --format sarif --output results.sarif   # for code scanning and SARIF viewers
echo $?                                        # 0 passed, 1 findings at or above --fail-on, 2 error
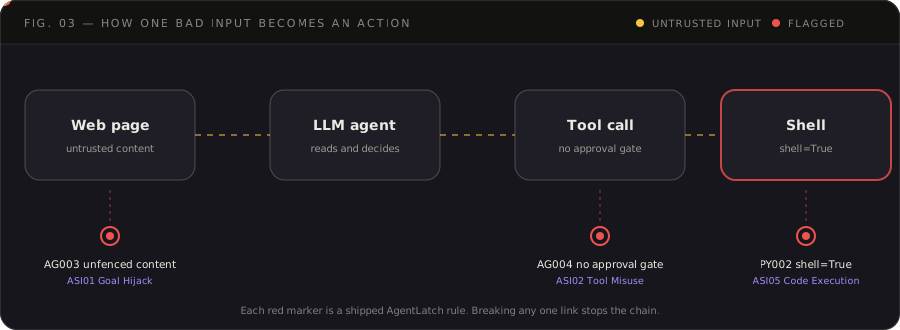
What the rules look for: how one piece of untrusted text can travel from a web page to a shell command. Each red marker is a shipped rule (AG003, AG004, PY002), and breaking any one link stops the chain.
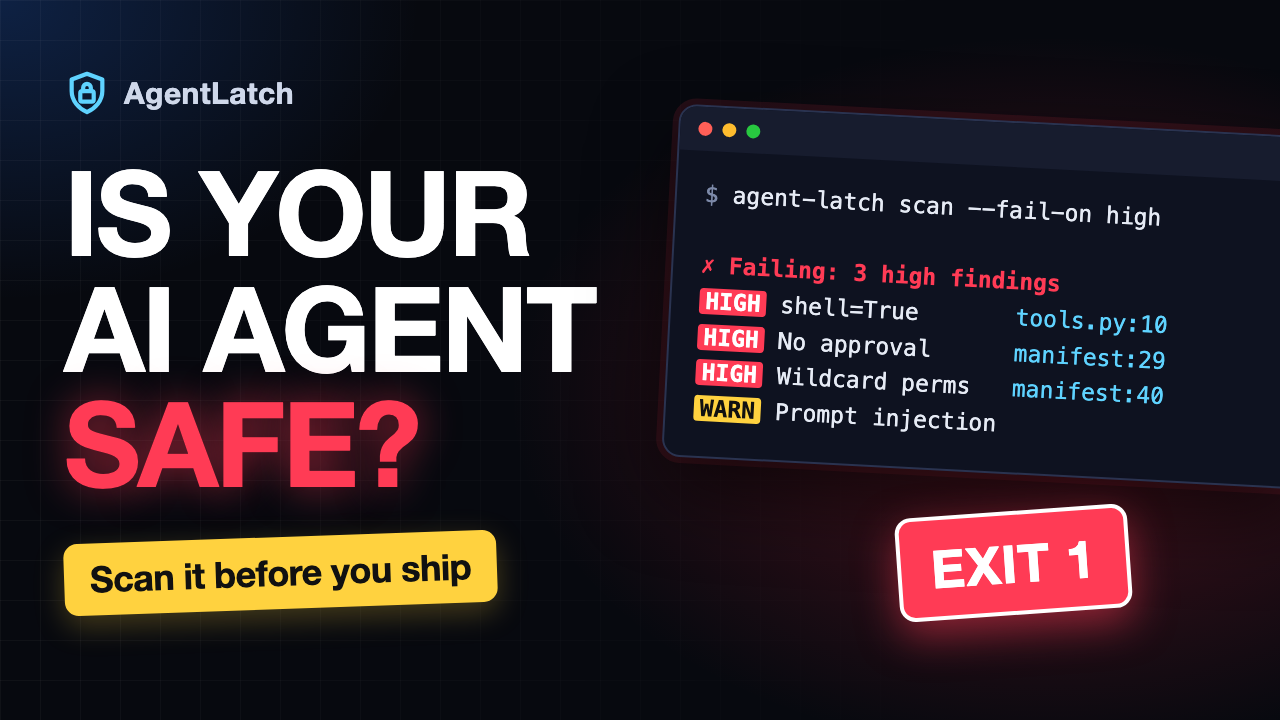
Go deeper: Getting started (ignores, output formats, exit codes) · Rule reference · Agent manifest
2. Static scan in CI (GitHub Actions and pre-commit)
What it does: runs the same scan on every pull request, or before every commit, and fails the check when a finding meets your threshold.
Run it, GitHub Actions: save this as .github/workflows/agent-latch.yml (Marketplace listing):
name: agent-latch
on: [push, pull_request]

permissions:
  contents: read
  security-events: write  # needed to upload results to code scanning

jobs:
  scan:
    runs-on: ubuntu-latest
    steps:
      - uses: actions/checkout@v4
      - uses: AgentLatch/agent-latch@v0.5.1
        with:
          fail-on: high
          # min-severity: medium      # optional: hide low and info findings
          # project-ignores: "true"   # apply your repo's .agent-latch-ignore (a pull request can edit it)
Run it, pre-commit: add this to .pre-commit-config.yaml, then run pre-commit install:
repos:
  - repo: https://github.com/AgentLatch/agent-latch
    rev: v0.5.1
    hooks:
      - id: agent-latch
See the result:
- Actions: open the run's log and its job summary (a findings table), or the repository's Security → Code scanning tab and the pull request's checks. The job exposes the outputs
sarif-file,finding-countandexit-code. - pre-commit: the commit is blocked on a high or critical finding. Check the whole repo at any time with:
pre-commit run agent-latch --all-files
Upgrading from v0.1.0: the project's own
.agent-latch-ignore,pyproject.tomlexcludes, and inline ignore comments are no longer applied by default. If your repository relies on them, addproject-ignores: "true"to the Action or--project-ignoreson the command line. See the v0.2.0 release notes.
Go deeper: pre-commit and CI (all inputs and outputs, other CI systems, choosing a threshold)
3. Runtime monitor for MCP (preview)
What it does: agent-latch-runtime sits between an AI agent and an MCP server and records what the agent asks its tools to do and what comes back. It is a preview and monitor only: it never blocks a call. It runs ALR04, which reports a finding when a tool definition contains instruction-like content. Secrets are masked in every file.
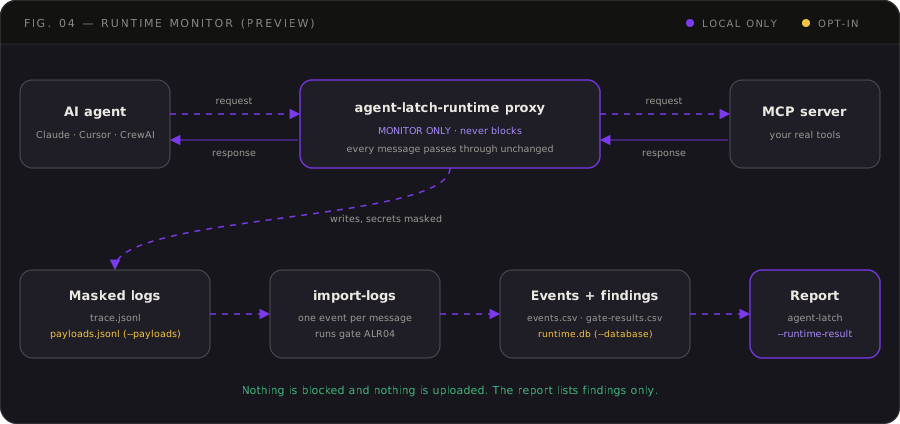
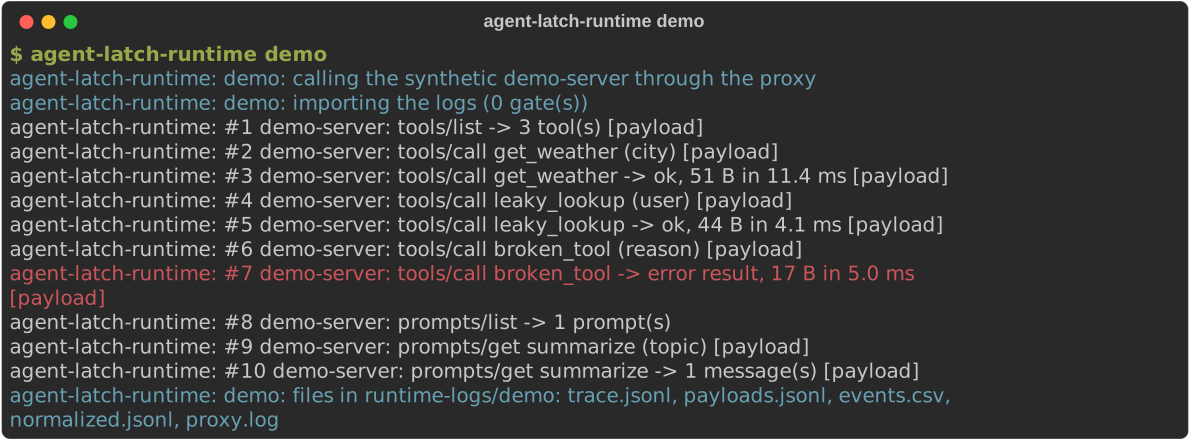
Run it: try it with a bundled synthetic server, no setup:
agent-latch-runtime demo
demo starts the synthetic server behind the real proxy, makes a few tool calls (one returns a fake credential, one fails), then imports the logs. This is real output:
Watch a real agent. Put the proxy in front of any MCP server, then follow its logs from a second terminal:
# Terminal 1: the agent's MCP traffic goes through the proxy.
agent-latch-runtime proxy --trace runtime-logs/trace.jsonl --payloads runtime-logs/payloads.jsonl \
  -- npx -y @modelcontextprotocol/server-github
# Terminal 2: one line per message, plus events.csv and gate-results.csv in runtime-logs/.
agent-latch-runtime import-logs
Run both from the same folder, in the environment where AgentLatch is installed. mcp-server/.venv does not provide agent-latch-runtime. To also keep a queryable local copy, add --database runtime-logs/runtime.db to import-logs (SQLite, nothing is uploaded).
See the result:
agent-latch . --runtime-result runtime-logs/gate-results.csv
This prints the gate findings in the same table as a scan, with the local tool's file and line when the project defines it (add --plain for text). Real output, shortened:
Runtime findings · 3

HIGH     ALR04-003  mcp-server/tools/alr04_fixture_tools.py:14
  concealment
  Tool definition contains above-threshold injection indicators; no exploit confirmed.
  Evidence: instruction_to_conceal_from_user @ $/description
  OWASP: ASI01 Agent Goal Hijack; ASI02 Tool Misuse and Exploitation; ...
The report lists findings only. Nothing was blocked. Add --fail-on high to exit 1 on a high finding, and --min-severity to hide lower ones.
Go deeper: Runtime proxy guide (limits, SQLite store, HTTP mode) · Live run with a CrewAI agent, plus 20 test scenarios
What the proxy records
| MCP message | Trace (always) | Full payload (--payloads) |
|---|---|---|
tools/list: tool names, descriptions, schemas |
✅ | ✅ |
tools/call: request, response and error |
✅ | ✅ (a failed call is logged with its error type) |
prompts/get: request and response |
✅ | ✅ |
prompts/list |
✅ | names only |
The trace keeps argument names, sizes, SHA-256 hashes and a short secret-masked excerpt, never raw values. The opt-in payloads file keeps full argument values and tool output, secret-masked and cut to --payload-max-chars. import-logs joins the two into one event per message.
Not recorded yet: resources/list and resources/read, initialize, sampling/createMessage, notifications (including tools/list_changed), image, audio and embedded-resource content in tool results, and a failed prompts/get. These pass through the proxy unchanged with no record. The proxy also never sees the user's chat with the model, an app's built-in tools, or servers not routed through it. Details: docs/runtime.md.
4. Tamper-evident ledger (preview)
What it does: a log the agent can rewrite is not evidence. --ledger FILE seals every trace record into a local hash chain, and one short digest per batch (an anchor) is published somewhere the agent cannot write. An edit, a deletion or a full rebuild then shows up when you verify. It is off unless you ask for it, uses only the standard library, makes no network call, and is never in the request path.
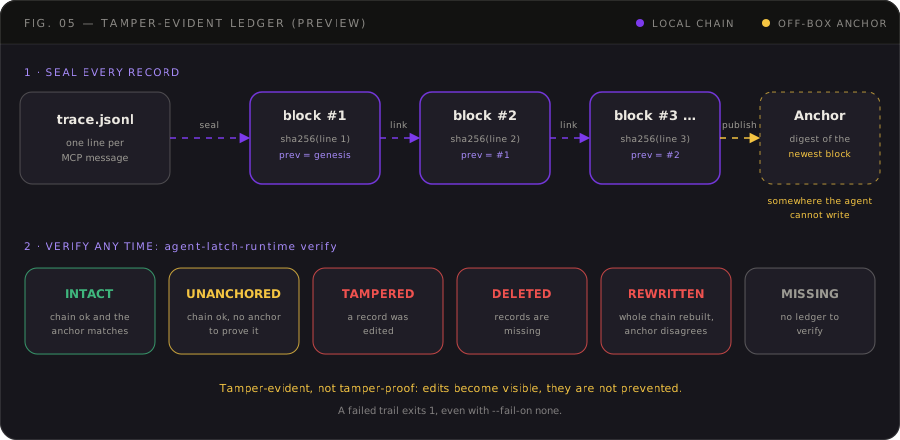
Run it:
# 1. Record with a ledger (the ledger needs a trace file beside it)
agent-latch-runtime proxy --trace runtime-logs/trace.jsonl \
  --ledger runtime-logs/trace.ledger.jsonl -- npx -y @modelcontextprotocol/server-github
# 2. Publish an anchor to a place the agent cannot write (a mounted drive, another host, ...)
agent-latch-runtime anchor --ledger runtime-logs/trace.ledger.jsonl --to /mnt/audit/anchors.jsonl
# 3. Verify, any time
agent-latch-runtime verify runtime-logs/trace.ledger.jsonl                       # finds trace.jsonl beside it
agent-latch-runtime verify runtime-logs/trace.ledger.jsonl --anchor /mnt/audit/anchors.jsonl
agent-latch-runtime verify runtime-logs                                          # every ledger in a folder
agent-latch-runtime verify runtime-logs --all                                    # ... and its subfolders, archives included
See the result: verify prints one verdict (intact, unanchored, tampered, deleted, rewritten or missing) and exits 1 when the trail cannot be trusted. For the full picture, put the ledger in the runtime report:
agent-latch . --runtime-result runtime-logs/gate-results.csv \
  --ledger runtime-logs/trace.ledger.jsonl --anchor /mnt/audit/anchors.jsonl
The verdict leads the report, followed by a table with one row per record. Problem records are always listed, and --ledger-rows N sets how many intact ones to show (0 for all). Real output for a ledger with one edited record, one gap and one out-of-order block (shortened):
AUDIT TRAIL TAMPERED — a record was altered; the log cannot be trusted.
  #5: the block's digest does not match its content
  #11: 2 records are missing here
  #13: this block does not follow the block before it

#   TIME                      METHOD      STAGE    DIGEST        STATE
5   2026-10-31T15:52:51.881Z  tools/list  request  b1c5e3ae7973  EDITED
11  -                         -           -        -             DELETED
13  2026-10-31T15:52:51.882Z  tools/call  request  65cbcbd329ef  REORDERED
30  2026-10-31T15:52:51.883Z  tools/call  request  97adbec2a3bd  ok
Export it as SARIF for a viewer or code scanning. The file gets the SARIF and the terminal still shows the report above:
agent-latch . --runtime-result runtime-logs/gate-results.csv \
  --ledger runtime-logs/trace.ledger.jsonl --anchor /mnt/audit/anchors.jsonl \
  --format sarif --output audit.sarif
A failed trail exits 1 even with --fail-on none, because log integrity is not a severity threshold.
What to expect: without an anchor the best verdict is unanchored: the chain is consistent, but nothing outside the machine proves the file was not rebuilt. The ledger makes tampering visible; it does not prevent it, and it cannot show a change made before a record was sealed. Check live sessions with verify runtime-logs (the folder, without --all) and use --all to audit archived sessions on purpose. What an agent with write access can still do, and how to narrow it: the ledger operations guide.
Go deeper: Audit ledger overview · Setup · Reference · Operations and incident runbook
5. Connect Claude, ChatGPT or Cursor
What it does: your app starts the proxy instead of the MCP server, and the proxy starts the real server. Nothing else about the app changes.
Run it: in the app's MCP settings, replace the server's command with the proxy and move the old command after --. Use full paths: desktop apps often start servers with a different PATH and working directory.
{
  "mcpServers": {
    "github": {
      "command": "/full/path/to/.venv/bin/agent-latch-runtime",
      "args": [
        "proxy", "--name", "github", "--trace", "/full/path/to/runtime-logs/trace.jsonl", "--",
        "npx", "-y", "@modelcontextprotocol/server-github"
      ]
    }
  }
}
Restart the app afterwards. Add "--ledger", "/full/path/to/runtime-logs/trace.ledger.jsonl" before the -- to also seal the log (section 4).
| App | Settings file |
|---|---|
| Claude Code | .mcp.json in the project |
| Claude Desktop | Settings → Developer → Edit Config |
| Cursor | ~/.cursor/mcp.json |
| GitHub Copilot in VS Code | .vscode/mcp.json (top-level key is servers, not mcpServers) |
| ChatGPT (web) | cannot start a local program: it reaches the proxy through OpenAI's Secure MCP Tunnel, see the ChatGPT guide |
See the result: use the app as usual, then follow the traffic with agent-latch-runtime import-logs and read it with the commands from sections 3 and 4.
Go deeper: Connect an app (exact paths per OS, remote servers over HTTP, the supported-clients table) · ChatGPT through the tunnel · Claude Desktop on Windows with the MCP server in WSL
AgentLatch MCPのよくある質問
AgentLatchはtoolの呼び出しをブロックしますか?
いいえ、ランタイムプロキシはトラフィックを記録して検出結果を報告するだけで、呼び出しをブロックすることはありません。
データはクラウドにアップロードされますか?
すべてはお使いのマシン上でローカルに実行されます。唯一のネットワーク通信は、パッケージ名とバージョンのみをアドバイザリサービスに送信する、オプションの依存関係監査のみです。