
Ermöglicht es Coding Agents, intermittierende Testfehler zu reproduzieren, Reproduktions-Inputs zu minimieren und Code-Fixes mit empirischen Belegen zu verifizieren.
Auch bekannt als LBarimi/FailTrace
- Stars
- 0
- Tools
- —
- Downloads, 30 Tage
- —
- Neueste Version
- 1.5.0
- Letzter Commit
- 7. Sept. 2026
- Lizenz
- MIT
Was ist FailTrace MCP?
FailTrace ist ein MCP server. Ermöglicht es Coding Agents, intermittierende Testfehler zu reproduzieren, Reproduktions-Inputs zu minimieren und Code-Fixes mit empirischen Belegen zu verifizieren.
Zusammenfassung generiert aus dem README des Projekts
Über FailTrace MCP server
FailTrace bietet Coding Agents eine Möglichkeit, mit intermittierenden Testfehlern umzugehen, indem es empirische Belege für das Debugging erstellt. Es funktioniert über einen lokalen stdio MCP server oder ein CLI und erlaubt es Entwicklern, eine fehlerhafte Baseline zu erfassen, Reproduktions-Inputs zu minimieren und Code-Patches zu verifizieren. Das Tool läuft lokal auf deinem Rechner mit Node.js 22.12+ und npm, was bedeutet, dass für die Funktion keine externen AI APIs, Accounts oder Telemetrie benötigt werden.
Agents können sieben spezifische MCP Tools nutzen, um den gesamten Investigations-Lifecycle zu verwalten, einschließlich Regression Search, Minimization und Verification. Das System verfolgt Failure Signatures und Investigations-Belege über mehrere Versuche hinweg. Es unterstützt bestehende Testrunner und Assertions, inklusive spezifischem Support für NUnit und Unity EditMode Tests. Um Datenmüll zu vermeiden, begrenzt der Server das gespeicherte stdout und stderr auf 16 MiB pro Trial und 256 MiB pro Run oder Minimization-Prozess.
Was du damit machen kannst
- 1Reproduktions-Inputs minimierenEin Agent kann einen komplexen Satz von Inputs auf die kleinstmöglichen Daten reduzieren, die erforderlich sind, um einen spezifischen Testfehler auszulösen.
- 2Code-Patches verifizierenEin Entwickler kann das Tool nutzen, um zu prüfen, ob ein vorgeschlagener Fix den Zielfehler im Vergleich zu einer gespeicherten Baseline tatsächlich behebt.
- 3Regressionsquellen identifizierenDas System kann dabei helfen, durch einen Bisect-Prozess zu finden, welche spezifische Git-Änderung einen fehlerhaften Test eingeführt hat.
- 4Intermittierende Fehler erfassenNutzer können einen Befehl ausführen, um einen Test mehrfach zu wiederholen, um eine konsistente Failure Signature zu erfassen.
Geschrieben aus dem README des Projekts. Jeder Use Case wurde gegen ein Zitat daraus geprüft.
So installierst du FailTrace MCP
Formate geprüft am 10. Nov. 2026Zu Cursor hinzufügenZu Goose hinzufügenFailTrace MCP in Claude Code installieren
$ claude mcp add failtrace -- npx -y failtraceFailTrace MCP in Cursor installieren
~/.cursor/mcp.json
{
  "mcpServers": {
    "failtrace": {
      "command": "npx",
      "args": [
        "-y",
        "failtrace"
      ]
    }
  }
}FailTrace MCP in VS Code installieren
.vscode/mcp.json
{
  "servers": {
    "failtrace": {
      "type": "stdio",
      "command": "npx",
      "args": [
        "-y",
        "failtrace"
      ]
    }
  }
}FailTrace MCP in VS Code CLI installieren
$ code --add-mcp '{"name":"failtrace","type":"stdio","command":"npx","args":["-y","failtrace"]}'FailTrace MCP in Claude Desktop installieren
claude_desktop_config.json
{
  "mcpServers": {
    "failtrace": {
      "command": "npx",
      "args": [
        "-y",
        "failtrace"
      ]
    }
  }
}FailTrace MCP in Codex installieren
$ codex mcp add failtrace -- npx -y failtraceFailTrace MCP in Codex config.toml installieren
~/.codex/config.toml
[mcp_servers.failtrace]
command = "npx"
args = ["-y", "failtrace"]
FailTrace MCP in Gemini CLI installieren
$ gemini mcp add -s user failtrace npx -- -y failtraceFailTrace MCP in Gemini settings.json installieren
~/.gemini/settings.json
{
  "mcpServers": {
    "failtrace": {
      "command": "npx",
      "args": [
        "-y",
        "failtrace"
      ]
    }
  }
}Automatisierte Checks
Geluften am 15. Nov. 2026Vollständiger Bericht →Unsere automatisierten Checks bestanden. Das ist kein Security-Audit: Lies den Code und gib dem Server nur den minimal notwendigen Zugriff. Wie die Checks funktionieren

- Source Repository verknüpft und erreichbarlbarimi/failtrace is public and reachablegithub.com/lbarimi/failtrace ↗Bestanden
- Paket nennt dieses Repository als Quellefailtrace names lbarimi/failtrace as sourcenpmjs.com/package/failtrace ↗Bestanden
- Build-Provenienz (Sigstore-Attestierung)No build attestation published for this releaseNicht geprüft
- Open Source Lizenz (OSI)MITspdx.org/licenses/MIT.html ↗Bestanden
- Commit oder Release im letzten JahrLast commit or release 2026-09-07github.com/lbarimi/failtrace ↗Bestanden
- OpenSSF ScorecardNicht geprüft
- Package-Name ähnelt keinem populären PackageNo popular package one edit away from failtraceBestanden
- Keine kritischen Advisories im Paket oder seinen Abhängigkeiten6 resolved dependencies checked; no critical advisoryosv.dev ↗Bestanden
- Keine versteckten Anweisungen an das Modell0 tool descriptions and the README read; no override phrases, credential paths or hidden charactersBestanden
- Destruktive Tools sind markiertNicht geprüft
- Remote-Endpoint beantwortet den MCP-HandshakeNicht geprüft
README
Auf GitHub ansehenFailTrace
Reproduce the failure. Check the fix.
A test fails intermittently. Your coding agent changes the code. One passing retry leaves you guessing.
FailTrace repeats the same check, saves a failing baseline, and checks the proposed fix against it. Use the CLI or MCP tools to get trial results, a smaller reproducer, and evidence your agent can inspect before accepting a patch.


Local execution. No AI API, account, or telemetry required. Keep your existing test runner and assertions.
Quick start
With Node.js 22.12+ and npm, run this in any working directory:
npx --yes failtrace demo
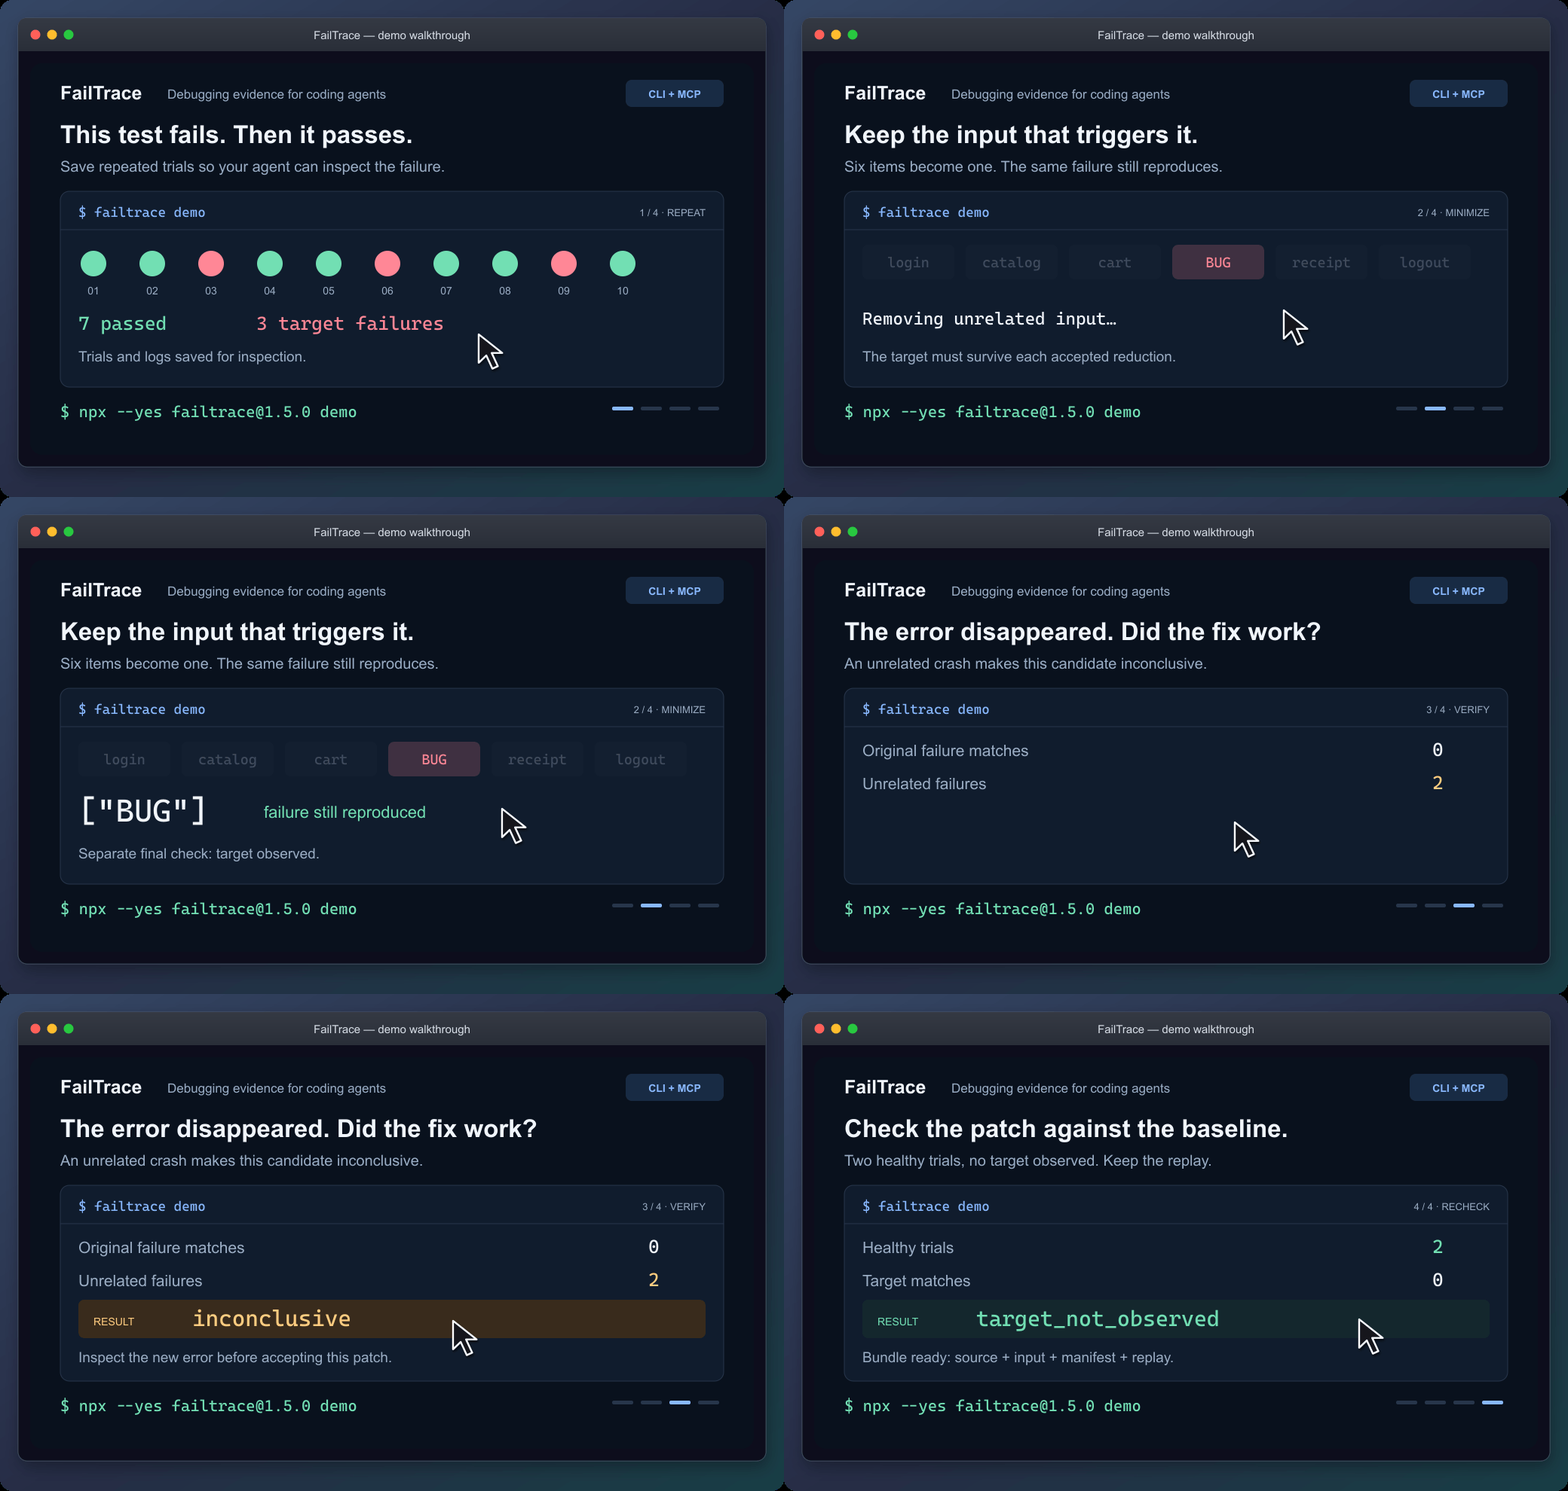
Static walkthrough · Static poster · Demo guide
The demo reduces six input items to ["BUG"], rejects a patch that crashes for another reason, and checks a working patch. It saves the evidence in .failtrace/ and prints a replay command.
For coding agents
Connect the local stdio MCP server through your client's configuration:
npx --yes failtrace@1.5.0 mcp --cwd "/absolute/path/to/your/project"
Copy the MCP configuration and check the connection →
Your client launches this command. Running it alone in a terminal waits for MCP requests. The guide includes Windows setup.
Then ask your agent:
Use FailTrace to capture this test failure before editing. Choose the exact test or failure message, save a bounded baseline, and inspect the matching trial. After the change, verify against that baseline and explain any unrelated errors or incomplete evidence.
The seven MCP tools share the CLI's Core engine. They retain the failure signature and investigation evidence across repetition, comparison, regression search, minimization, verification and replay. Agents can retrieve saved trial and log pages without rerunning the command. Shell-capable agents can also use the CLI with --json.
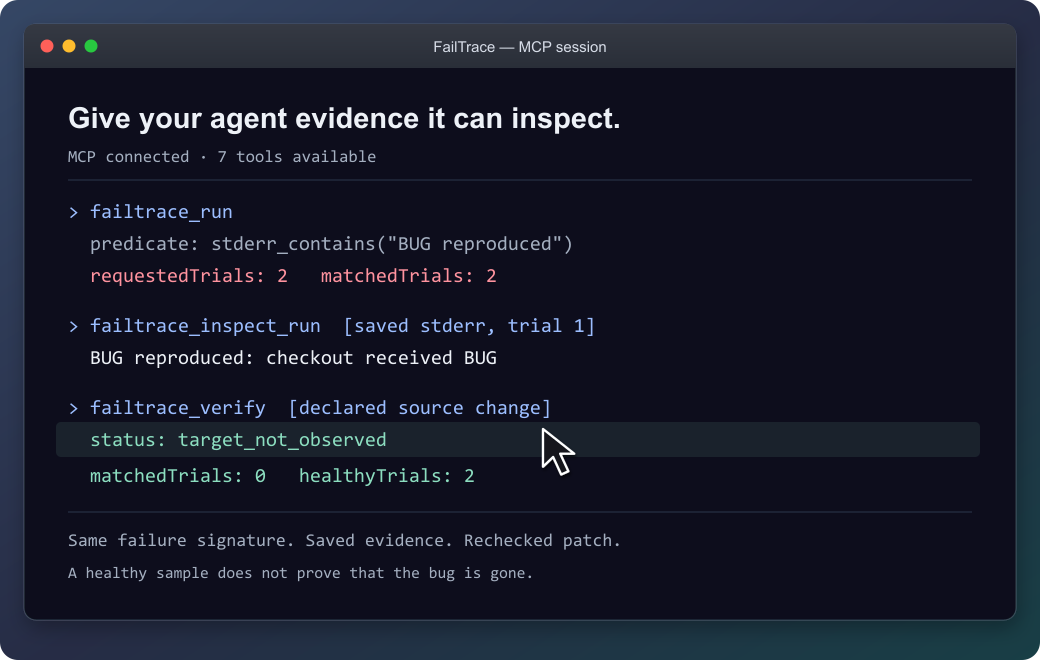
The agent can inspect the saved failure before checking the patch.
Recheck an existing unit test
Follow an exact NUnit or Unity test through a fix. Each attempt gets a fresh NUnit 3 report. Missing or skipped tests and unrelated failures stay inconclusive, so an agent cannot accept them as evidence that the selected test passed.
Connect your test or try the original EditMode example →
NUnit support is included in 1.3.0 through CLI and MCP. The documented Unity validation covers the Windows EditMode example.
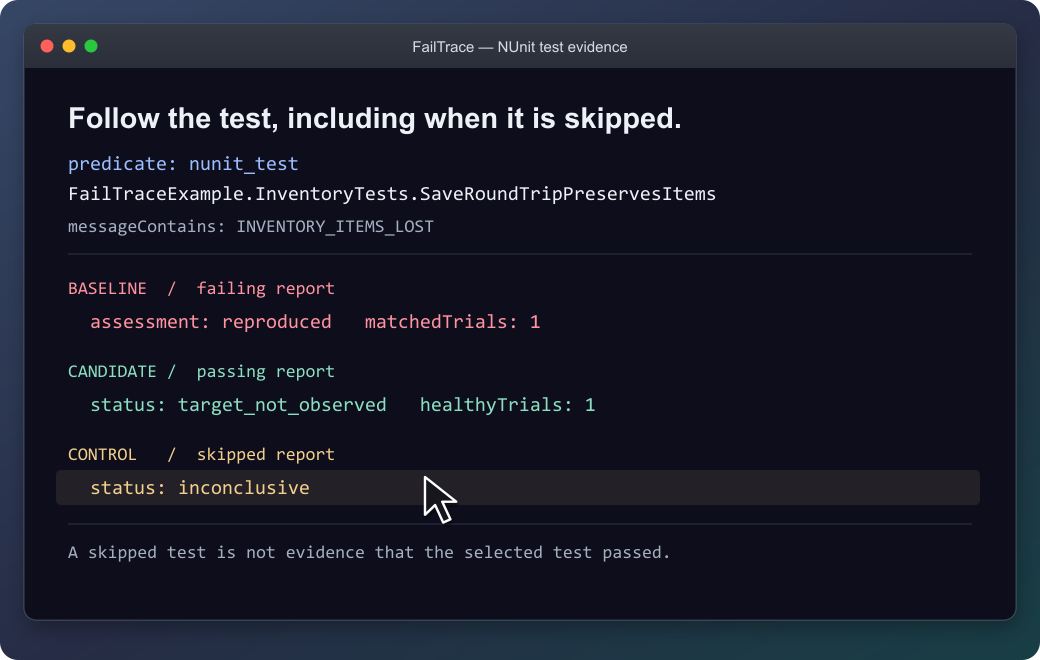
The selected test stays the same; a skipped report is not accepted as a passing test.
Use it on your own failure
From your project, replace the command and message with your own:
npx --yes failtrace@1.5.0 run "npm test -- checkout" --repeat 20 --stderr-contains "checkout failed" --capture-context
Run this before editing in a Git project. --capture-context records source identity for Verify; outside Git, select files with --context-source. Each trial saves its output, and exit 1 can mean the target was captured successfully. Then edit and verify the patch →
| Your next question | Command |
|---|---|
| How often does this failure appear? | run |
| What differs between a healthy and failing trial? | compare |
| Which Git change introduced it? | bisect |
| What input is enough to reproduce it? | minimize |
| What happened after the proposed fix? | verify |
| How can I replay this investigation? | bundle |
Command reference · Literal executable arguments · Reusable project scripts
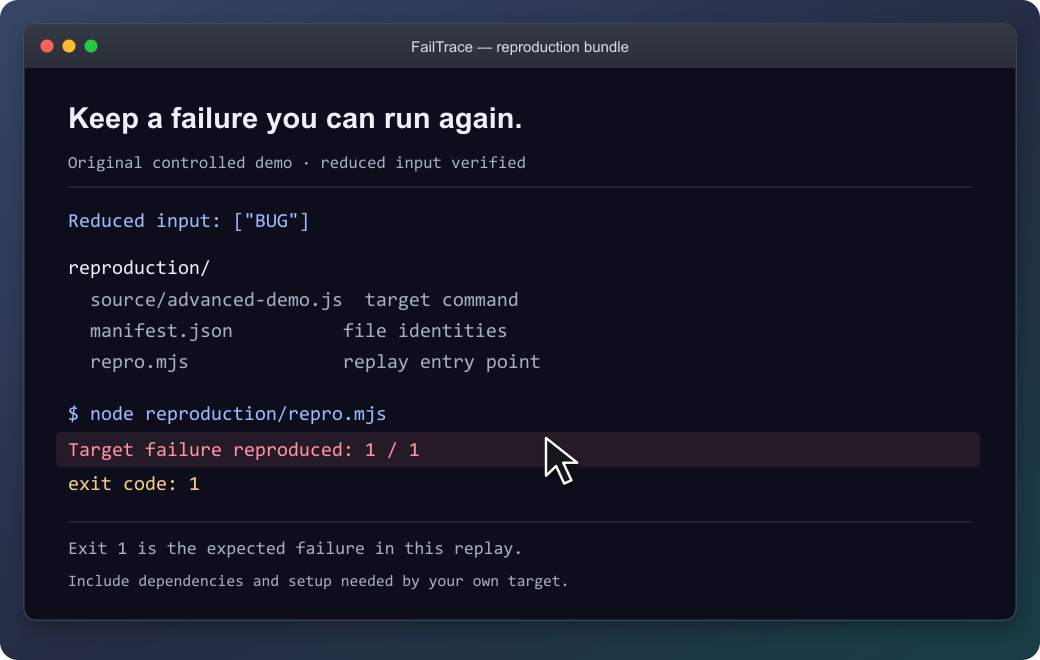
The demo's bundle reproduces its original failure with exit 1. Keep the source, input and replay together; supply the target's prerequisites when packaging your own investigation.
What the results establish
FailTrace reports observations under the chosen settings. Verify separates a target observed, a healthy sample without that target, and inconclusive evidence. Bisect reports a sampled first-parent boundary; minimization rechecks its result without promising the smallest possible input.
The demo shows controlled example outcomes, not performance measurements. A passing sample does not prove a bug is gone.
Commands run with your permissions, and process cleanup is best effort. Retained stdout/stderr is capped by default at 16 MiB per trial and 256 MiB per run or bisect/minimization. Previous investigations accumulate separately. Review logs, commands and selected files before sharing; bundles still require the target's dependencies and setup.
Result and exit-code reference · Resource limits · Storage inventory · Bundle guide
Availability and contributing
The quick start uses npm's latest release; the verified version is 1.5.0. MCP configuration and repeatable installation examples keep that exact version pinned: installation options, GitHub release, and MCP Registry entry.
Version 1.5.0 adds: short run references, Verify readiness and next-step guidance, and intermittent-minimization guidance. See the changelog.
Documentation: choose your next task →
Development instructions · Compatibility · Roadmap · Third-party notices
FailTrace MCP Fragen
Wie füge ich FailTrace MCP zu Claude Code hinzu?
Führe claude mcp add failtrace -- npx -y failtrace in deinem Terminal aus. Füge --scope user hinzu, damit der Server in jedem Projekt verfügbar ist.
Wie füge ich FailTrace MCP zu Cursor hinzu?
Öffne ~/.cursor/mcp.json und füge den Server unter mcpServers hinzu, mit der Cursor-Config aus dem Installationsabschnitt oben.
Benötigt FailTrace eine AI API oder einen Account?
Nein, es führt lokale Ausführungen durch, ohne dass eine AI API, ein Account oder Telemetrie erforderlich sind.
Kann ich FailTrace mit NUnit-Tests verwenden?
Ja, NUnit-Support ist ab Version 1.3.0 sowohl über das CLI als auch über MCP enthalten.
Wie hoch sind die Ressourcenlimits für Logs?
Das gespeicherte stdout/stderr ist auf 16 MiB pro Trial und 256 MiB pro Run, Bisect oder Minimization begrenzt.
Beweist ein erfolgreiches Sample, dass ein Bug behoben ist?
Nein, ein erfolgreiches Sample liefert keinen absoluten Beweis dafür, dass ein Bug vollständig beseitigt wurde.