
Claude Code for Visual Studio MCP server
Commit 4. Nov. 2026Integriert Claude Code in Visual Studio 2026 für natives Diffing, Live-Debugger-Steuerung, Roslyn-basierte semantische Navigation und Test Runner Integration.
Auch bekannt als firish/claude_code_vs, claude-code-vs
- Stars
- 107
- Tools
- —
- Downloads, 30 Tage
- —
- Neueste Version
- —
- Letzter Commit
- 4. Nov. 2026
- Lizenz
- MIT
Was ist Claude Code for Visual Studio MCP?
Integriert Claude Code in Visual Studio 2026 für natives Diffing, Live-Debugger-Steuerung, Roslyn-basierte semantische Navigation und Test Runner Integration.
Zusammenfassung generiert aus dem README des Projekts
Über Claude Code for Visual Studio MCP server
Die Einbindung von Claude Code in Visual Studio 2026 ermöglicht es Entwicklern, das Claude CLI mit tiefer IDE-Integration zu nutzen. Diese Extension fungiert als Brücke, die es dem Agenten erlaubt, nativ mit der Visual Studio Umgebung zu interagieren. Anstatt manuell per Copy-Paste zu arbeiten, kann der Agent Compiler-Diagnosen lesen, Builds über die hauseigene Engine der IDE verwalten und das Output-Fenster einsehen, um Debug-Traces oder Fehler beim Assembly-Binding zu analysieren.
Entwickler, die an C# oder C++ Projekten arbeiten, profitieren von der Roslyn-basierten semantischen Navigation. Das erlaubt dem Agenten Aufgaben wie das Finden aller Referenzen oder das Navigieren durch Typ-Hierarchien mit der Präzision des Compilers auszuführen. Die Integration beinhaltet einen Live-Debugger, den der Agent steuern kann, um durch den Code zu steppen, Breakpoints zu setzen oder Deadlocks zu untersuchen. Zudem besteht eine Verbindung zum Visual Studio Test Explorer, um Unit Tests auszuführen und Fehler direkt an der Fehlerstelle zu debuggen. Alle Code-Änderungen werden in einem nativen Diff-Fenster angezeigt, in dem du Vorschläge bearbeiten oder ablehnen kannst, bevor sie angewendet werden.
Was du damit machen kannst
- 1Runtime-Fehler debuggenLass den Agenten den Debugger steuern, um einen Bug zu finden, indem er durch den Code steppt und den Call Stack sowie die Variablen inspiziert.
- 2Compiler-Diagnosen behebenLass den Agenten C# oder C++ Fehler und Warnungen, die in der Visual Studio Error List angezeigt werden, automatisch beheben.
- 3Semantische Code-Analyse durchführenFordere den Agenten auf, alle Implementierungen zu finden oder mithilfe von Roslyn durch komplexe, über Interfaces bereitgestellte Referenzen zu navigieren.
- 4Flaky Unit Tests untersuchenAnweisung an den Agenten, einen fehlerhaften Test unter dem Debugger auszuführen, um den exakten Moment des Fehlers zu erfassen.
Geschrieben aus dem README des Projekts. Jeder Use Case wurde gegen ein Zitat daraus geprüft.
Automatisierte Checks
Geluften am 14. Nov. 2026Vollständiger Bericht →Noch nicht verifiziert. Ein Server benötigt einen Score von 80, keine kritischen Befunde und genug Daten für unsere Prüfung. Wie die Checks funktionieren · Was du für mehr Punkte verbessern kannst

- Source Repository verknüpft und erreichbarfirish/claude_code_vs is public and reachablegithub.com/firish/claude_code_vs ↗Bestanden
- Paket nennt dieses Repository als QuelleNicht geprüft
- Build-Provenienz (Sigstore-Attestierung)Nicht geprüft
- Open Source Lizenz (OSI)MITspdx.org/licenses/MIT.html ↗Bestanden
- Commit oder Release im letzten JahrLast commit or release 2026-11-04github.com/firish/claude_code_vs ↗Bestanden
- OpenSSF ScorecardNicht geprüft
- Package-Name ähnelt keinem populären PackageNicht geprüft
- Keine kritischen Advisories im Paket oder seinen AbhängigkeitenNicht geprüft
- Keine versteckten Anweisungen an das Modell0 tool descriptions and the README read; no override phrases, credential paths or hidden charactersBestanden
- Destruktive Tools sind markiertNicht geprüft
- Remote-Endpoint beantwortet den MCP-HandshakeNicht geprüft
README
Auf GitHub ansehenClaude Code for Visual Studio
Bring Claude Code into Visual Studio 2026. The claude CLI does the agent work. This extension is the IDE half of Claude Code's integration protocol: a native diff window with accept and reject, automatic selection and compiler-diagnostics context, a live debugger Claude can read and drive, Roslyn code navigation with decompile, and a test runner that catches failures under the debugger.
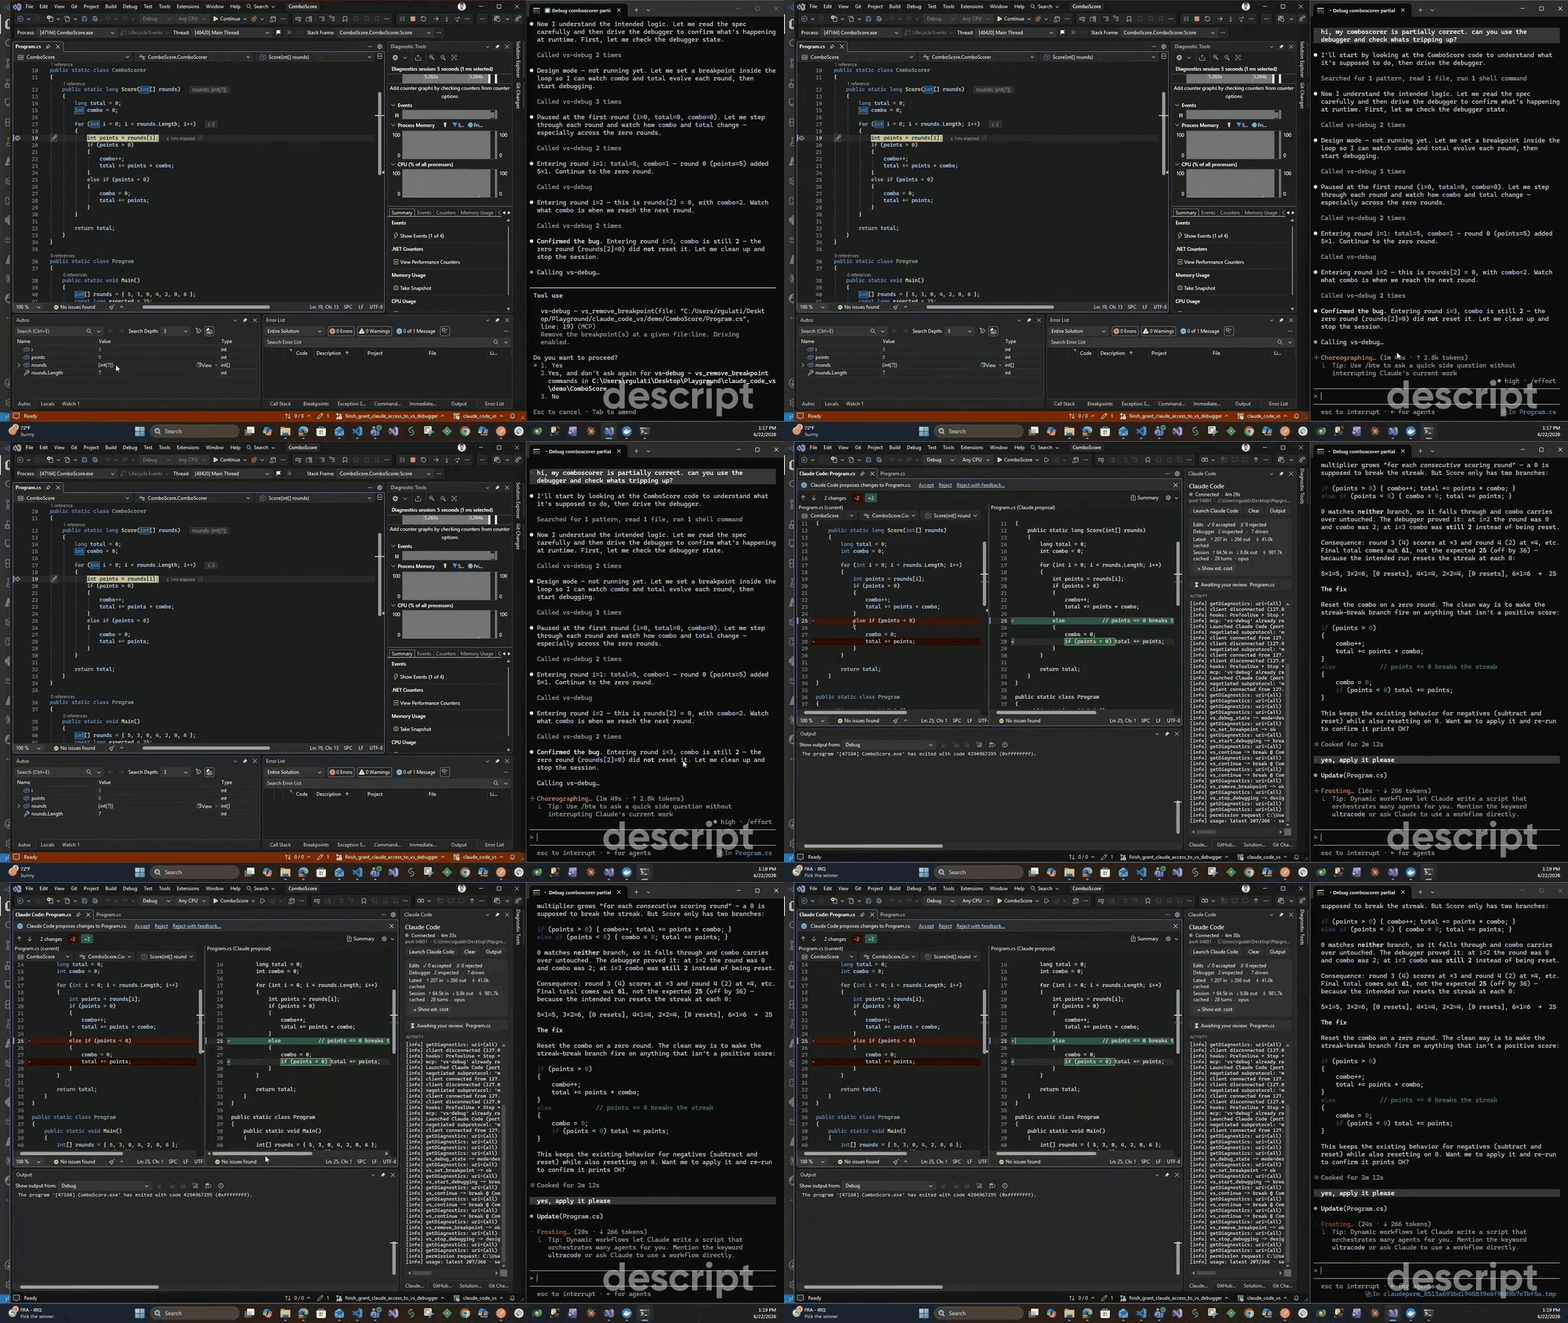
A fresh Claude session driving the Visual Studio debugger to find a bug that is invisible in the output, then opening the fix in the native diff.
Status: community project, not affiliated with Anthropic. Visual Studio 2026 only for now. Tested against claude 2.1.223.
Jump to a feature: Native diff · Drive the debugger · Data breakpoints · Catch flaky tests · Semantic navigation · Integrated terminal · Attach files · Claude's eyes · The panel
More: What you get · Requirements · Install · Quickstart · How it works · Privacy and security · Limitations · Troubleshooting · Build from source
Why
Claude Code ships first-class IDE integration for VS Code and JetBrains, but not Visual Studio. This extension implements that same integration protocol natively for VS, so the CLI drives a real Visual Studio diff window and reads your selection and build errors instead of you copy-pasting into a terminal.
The demand for this is on the Claude Code tracker. These requests ask for what the extension provides:
- Visual Studio support: #15942 for VS 2026, and #70516 for VS 2022+.
- A debugger Claude can use: #13865 for an interactive debug mode aimed at hard-to-reproduce runtime bugs, and #27110 to expose debugger state, the variables and call stack, to Claude.
- Reaching more IDEs, and stronger C#/.NET code intelligence: #1234 for IDEs beyond VS Code and JetBrains, and #16360 for the C# code intelligence our Roslyn navigation provides.
What you get
- Native diff with a single accept/reject gate - Claude's edits open in Visual Studio's diff viewer, and approving there is the only step (no duplicate y/n prompt in the terminal).
- Edit before you accept - the diff's right pane is a live editor: fix the name, drop the line it shouldn't have touched, then Accept, and your version is what lands. Claude is told the file now differs from its proposal so it re-reads before touching it again. Full reference:
docs/QOL.md. - Reject with feedback - reject an edit and tell Claude what to change, and it reconsiders with your note.
- Run wild (auto-accept) - a panel toggle that applies edits without opening the diff, for when you want to let it cook. Resets each session.
- Diagnostics sharing - Claude reads Visual Studio's compiler errors and warnings (C# and C++) and fixes them.
- Build it the way the IDE does - Claude runs Visual Studio's own build, not a separate
dotnet build, and gets back real errors and warnings with file, line and project. That matters because the Error List those diagnostics come from is populated by the IDE's build, so before this Claude was reading whatever your last manualCtrl+Shift+Bleft behind. It can build a single project (or just the one owning the file it edited), and a long build keeps running in the background instead of timing out. Full reference:docs/BUILD.md. - Read the Output window - under F5, a lot of what your program says never reaches a terminal:
Debug/Traceoutput, assembly-binding failures, and first-chance exception notices even when the exception is caught and swallowed. All of it lands in the Output window's Debug pane, which no CLI can see. Claude can read it, filter it, and tail it. Full reference:docs/BUILD.md. - Semantic code navigation - Claude asks Visual Studio's compiler (Roslyn) for the resolved meaning of your C# instead of grepping text: find-all-references, go-to-definition, find-implementations, and call/type hierarchies. These are the ground-truth answers text search gets wrong, like indirect and interface-dispatched references, the right overload, explicit interface implementations, and transitive callers for impact analysis. No debug session needed; it works whenever a C#/VB solution is loaded. Full reference:
docs/SEMANTIC.md. - The evaluated project graph - Claude reads what MSBuild and NuGet actually resolved instead of guessing from
.csprojtext: real target frameworks, package versions including the transitive ones and what pulled each in, project references, the active configuration, the analyzer set, and evaluated properties likeLangVersionandNullable- the values aDirectory.Build.propsor Central Package Management sets where no project file ever mentions them. Full reference:docs/SEMANTIC.md. - Live debugger - while you are paused at a breakpoint, Claude sees your program's runtime state (call stack, variable values, threads) and, opt-in, can drive the debugger: continue, step, set breakpoints, break at the throw site of an exception, set a data breakpoint that breaks (or traces the full change history) the moment a value changes, attach to a running app (a hosted web service or desktop app, not just F5), and pause a hung process to untangle a deadlock by following the lock-ownership chain across threads to the exact cycle. Full reference:
docs/DEBUGGER.md. - Test integration - Claude discovers, runs, and debugs your unit tests through Visual Studio's Test Explorer engine: real per-test results (outcome, message, stack), re-run just the failures, and run a failing test under the debugger to stop at the fault, or hammer a flaky test until it fails and catch that iteration red-handed, paused inside the failure. Because it is the debugger's own session, a red test becomes a live investigation. Full reference:
docs/TESTING.md. - Jump to what Claude changed - every change Claude makes gets a clickable row in the panel, opening the file at that exact line. One row per changed region, not one per file, each with its own
+3 -1count. Scoped to the current turn so it stays short, and it is the only record of what happened when auto-accept is on.F8steps through the whole session's changes from the Output window. Full reference:docs/QOL.md. - Selection context - Claude automatically knows the file and lines you are looking at.
- Right-click → Claude Code - an editor context menu with the common asks one click away: Explain and Add to Chat (
Alt+K) hand Claude your selection or file; Fix Errors bundles the code with its actual Error List diagnostics; Generate Documentation and Add Comments resolve the function at your caret through Roslyn - no selection needed; Generate Tests finds your test project and its framework, the tests that already cover the function, and asks for new ones verified with a build and a run; in test files, Fix This Test hands Claude the run → debug-at-the-throw → fix → re-run loop. Nothing auto-submits: references land in the CLI composer, the terminal gets focus so Enter sends, and every edit still goes through the diff gate. Full reference:docs/QOL.md. - Right-click → Add to Chat in Solution Explorer - point Claude at files it hasn't opened: select any number of files (or folders, or a selection spanning projects), right-click, and each is
@-mentioned whole-file. A folder is mentioned as itself - the CLI walks the tree - and every reference arrives as a tray chip with its token estimate. Full reference:docs/QOL.md. - Claude in the IDE's own terminal - Launch opens
claudeinside Visual Studio's docked Terminal tool window (the same group as Developer PowerShell), already connected - it docks and tabs like any other VS terminal instead of floating over your desktop. An External console button keeps the standalone-window option. Full reference:docs/QOL.md. - Attach screenshots and files - the Windows CLI cannot take a pasted screenshot at all, so the panel is the paste point: Win+Shift+S, click Paste (or drop files from Explorer), and an
@reference lands directly in the CLI's input box with the real image attached. Every attachment shows an estimated token cost before you send, Excel/video/archives attach too (Claude gets the path and reaches for a script), and staged copies live in a gitignored.claude/attachments/. Full reference:docs/QOL.md. - Screen capture: Claude takes its own screenshots (opt-in) - two gated tools give Claude eyes: capture the debugged app's window, any window by title (the browser showing your site), the VS window, or the whole screen. Captures land in the attachment tray as visible chips with a token estimate, and the tool returns a path Claude Reads with real vision - UI layouts, images, rendered pages, text in windows that are not files. Off by default behind an Allow screen capture toggle; every capture is logged. Full reference:
docs/VISION.md. - Notifications - an in-IDE heads-up when Claude finishes responding or needs your input (a permission prompt, or it went idle waiting for you): a notification bar in Visual Studio, plus a taskbar flash when VS is in the background. For working in another window while it cooks. A panel toggle mutes it. Full reference:
docs/QOL.md. - Live panel - a dockable Claude Code panel: connection status, edit decisions, and token usage with estimated cost (latest call vs cumulative session). During a turn it shows what Claude is doing right now - elapsed time, the tool call in flight, and its task list - read from the session transcript, so it costs the session nothing. Full reference:
docs/QOL.md. - 简体中文界面 - the extension's UI (panel, dialogs, the diff Accept/Reject bar, notifications) follows Visual Studio's display language, with Simplified Chinese included. Run VS in 中文(简体) and the extension matches; anything untranslated falls back to English per-string. The
claudeCLI's own terminal text stays English (upstream). Translation corrections welcome via issue or PR.
A closer look
A few of these are hard to picture from a bullet. Here they are running in the IDE.
A native diff with one approval step
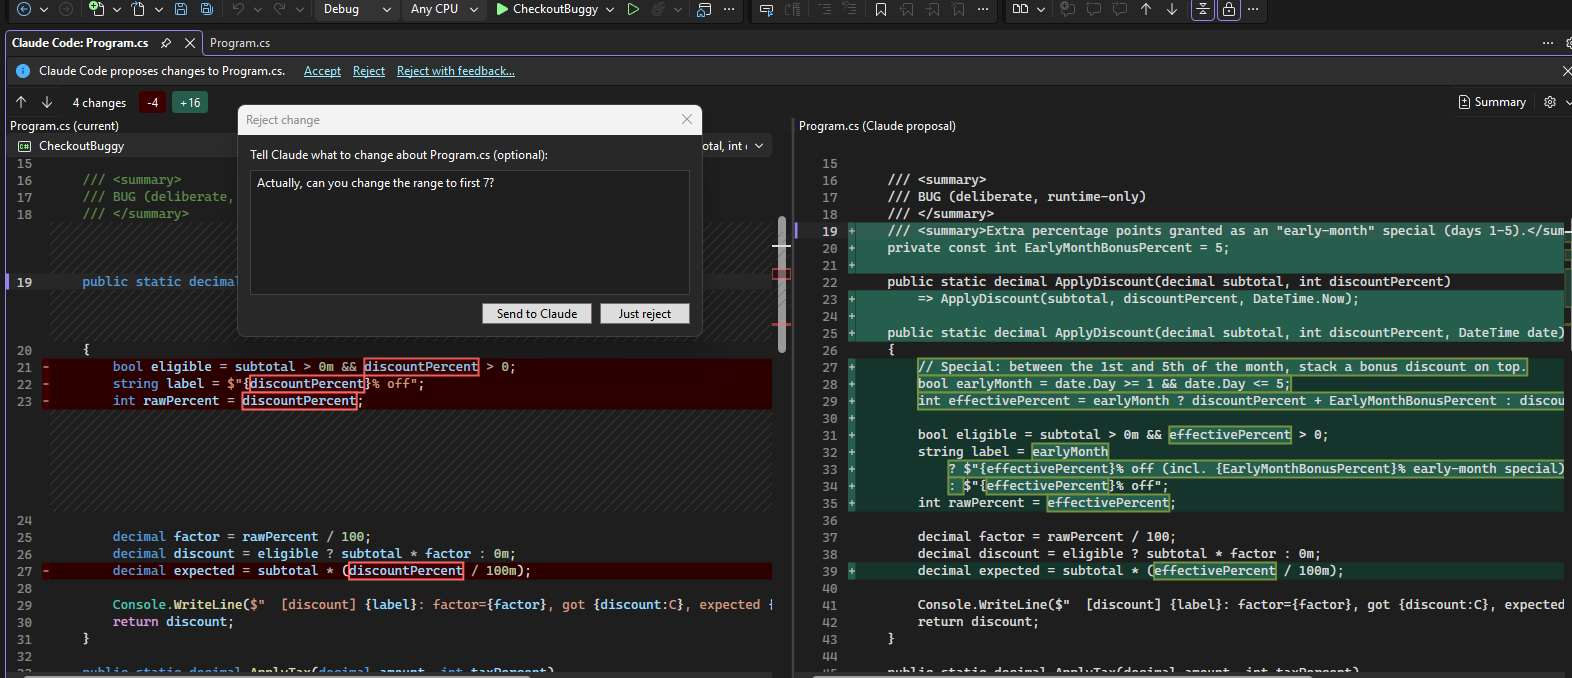
Claude's edits open in Visual Studio's own diff viewer, and approving there is the only step. There is no second yes/no prompt in the terminal. You can reject an edit and leave a note, and Claude reconsiders with your feedback. You can also just fix it: the right pane is editable, and Accept applies what you left there. A panel toggle applies edits without the diff for when you want it to run ahead, and it resets each session so it is never silently left on.
A debugger Claude can drive
While you are paused at a breakpoint, Claude reads your program's runtime state: the call stack, variable values, and threads. With driving turned on it also steps, sets breakpoints, and runs your code to corner a bug instead of guessing from the source. The clip above is a scoring function that returns the wrong total. Claude stopped inside the loop, stepped through the rounds, and watched a counter that should reset but did not.
It kept a running trace of what it saw at each round, which is how it caught the reset it was missing. For the input {5, 3, 0, 4, 2, 0, 6}:
| round | points | combo (after) | total | should be |
|---|---|---|---|---|
| 0 | 5 | 1 | 5 | 5 |
| 1 | 3 | 2 | 11 | 11 |
| 2 | 0 | 2, stays | 11 | 11 |
| 3 | 4 | 3 | 23 | 15 |
| 4 | 2 | 4 | 31 | 19 |
| 5 | 0 | 4, stays | 31 | 19 |
| 6 | 6 | 5 | 61 | 25 |
It has grown well past stepping. Claude can attach to a program that is already running (a hosted web service or a desktop app, not just F5), break at the throw site of an exception instead of the catch that swallows it, and pause a hung process to walk a deadlock back to the exact cycle. Full tool list and worked walkthroughs are in docs/DEBUGGER.md.
Break when a value changes
Point Claude at a field and it stops the moment that field is written, or traces every value the field takes, in order. It can watch conditionally (break only when the value goes below zero, for example) and on several fields at once. Visual Studio's own UI can set this, but there is no automation API for it, so the extension arms it through a bundled debug-engine component. That makes it new ground for catching the write that corrupts your state.
The plain watch records every write, so the corrupting step is obvious at a glance, and the conditional watch (< 0) breaks on exactly that one:
| # | value (cents) | written by | |
|---|---|---|---|
| 1-3 | 0 → 30000 → 42000 → 54000 | AddItems |
three line items |
| 4 | 54000 → 48600 | ApplyBulkDiscount |
10% off |
| 5 | 48600 → 52488 | ApplyTax |
+8% tax |
| 6 | 52488 → -47512 | ApplyLoyaltyCredit |
the corruption |
The full data-breakpoint reference is in docs/DEBUGGER.md.
Catch a failing test, even the flaky ones
Claude discovers, runs, and debugs your unit tests through Visual Studio's Test Explorer engine. You get real per-test results (outcome, message, and stack), and after a fix it re-runs only the tests that failed. The test tools sit on top of the debugger, so a red test becomes a live investigation: Claude can launch one failing test and stop at the throw with the exception and locals in view. It can also loop a flaky test until the failing run happens and leave you paused inside that run, holding the state that caused it.
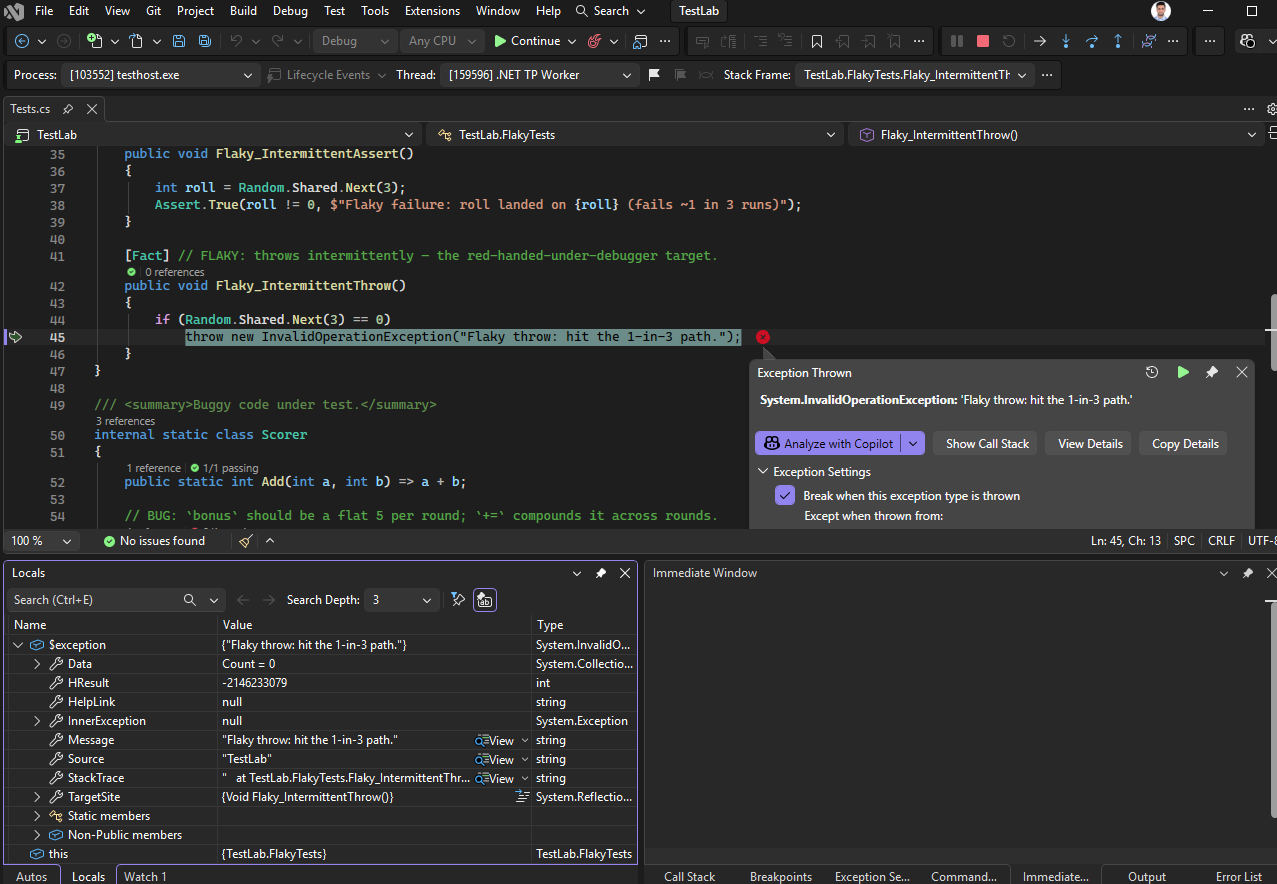
Full tool list and the worked flow are in docs/TESTING.md.
Read code the way the compiler does
Most assistants navigate code by searching text, which misses indirect references and over-counts on comments and same-named symbols. This gives Claude Visual Studio's resolved model of your C# (Roslyn): find-all-references, go-to-definition, find-implementations, and call and type hierarchies, resolved through interfaces, overrides, and overloads. It also reads the decompiled body of a method inside a referenced DLL, which searching your repo cannot do. Point it at a framework or NuGet call and it returns the real decompiled C#, and for core .NET types it fetches the actual runtime source via SourceLink.
| Tool | What it caught that a text search misses |
|---|---|
| find-implementations | Triangle's explicit IShape.Area, which .Area() or : IShape never ties back to the interface |
| type-hierarchy | Circle and Square reach IShape transitively through ShapeBase; grep on : IShape finds only the two direct implementers |
| call-hierarchy | the interface-dispatched callers of IShape.Area, back to Main, that a search on the concrete Circle.Area would miss |
| go-to-definition | the right Describe overload at a call site, not all three declarations |
| decompile | the real body of Enumerable.Sum from the library, with Math.Sqrt falling back to SourceLink |
It needs no debug session and works whenever a C#/VB solution is open. Details are in docs/SEMANTIC.md.
The same server also answers what the project actually builds with. A .csproj in a modern repo is missing most of it: the LangVersion and Nullable a Directory.Build.props sets two folders up, the package versions Central Package Management moved into Directory.Packages.props, and the whole transitive package closure. vs_solution_model returns the evaluated graph instead - target frameworks, resolved package versions with what pulled each one in, project references, the active configuration, analyzers, and evaluated properties - so "which Newtonsoft.Json is this using, and why" gets the real answer. Details: docs/SEMANTIC.md.
Click straight to what it changed
Claude tells you it edited Pricing.cs:22, but that text lives in the terminal, where Visual Studio offers nothing to click. The panel lists the changes instead, one row per changed region:
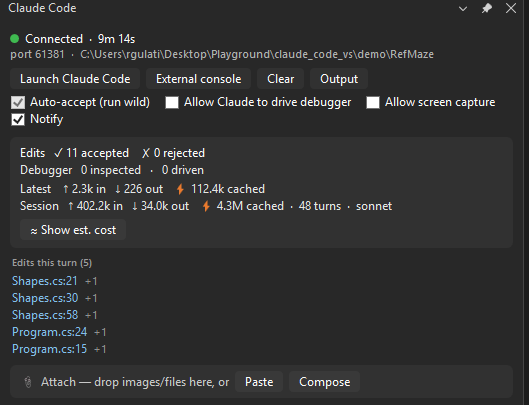
Click a row and the file opens at that line. The list covers the current turn, so it stays short, and it survives while you type your next message. It earns its keep most with auto-accept on, where no diff opens and this is the only record of what changed. The Output window keeps the same list for the whole session, steppable with F8. Details: docs/QOL.md.
Right-click, and Claude is in the loop
The Claude Code flyout sits mid-menu in the editor's right-click menu - below the Go To block, where you'd expect it:
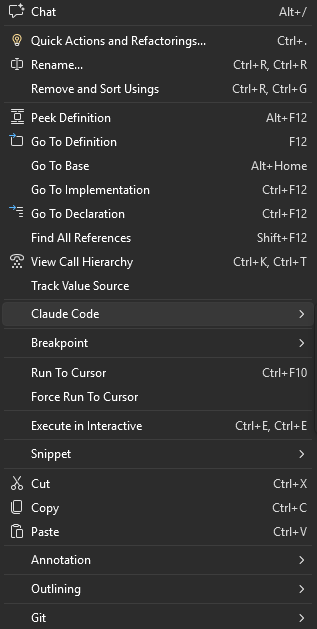
The separator inside is the design: above it, actions that give Claude context (Explain, Add to Chat with Alt+K); below it, actions that ask Claude to change the file (Fix Errors with the real Error List diagnostics attached, Generate Documentation and Add Comments resolved to the function at your caret by Roslyn, Generate Tests composed with your test project, its framework and the tests that already cover the function - and in test files, in its place, Fix This Test, which hands Claude the run → debug → fix → re-run loop):
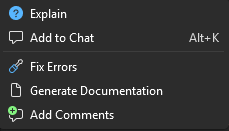
Every action stages a self-describing reference in the CLI composer (never auto-submits), focuses the terminal so Enter sends, and every resulting edit still comes through the diff gate. Details: docs/QOL.md.
Claude in the IDE's own terminal
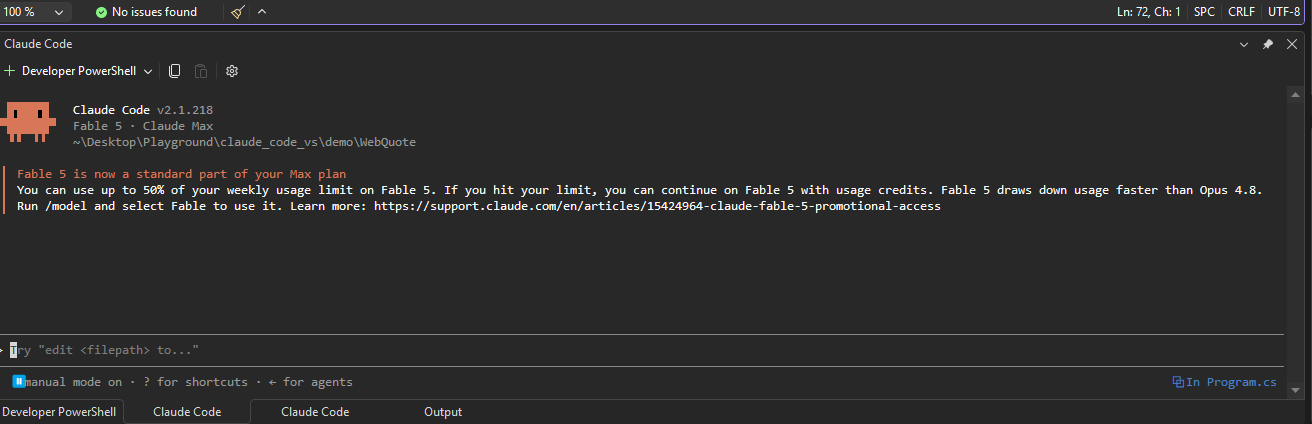
claude runs inside Visual Studio's docked Terminal tool window - the same terminal group as Developer PowerShell - instead of a separate console floating over your desktop. Under the hood this is VS 2026's own terminal engine, reached through an undocumented service, so the launch is guarded: any failure or stall falls back to the classic external console automatically. Prefer the standalone window anyway (a second monitor, or a session that survives closing VS)? The External console button next to Launch does exactly that. Details and known quirks: docs/QOL.md.
Attach a screenshot, or any file
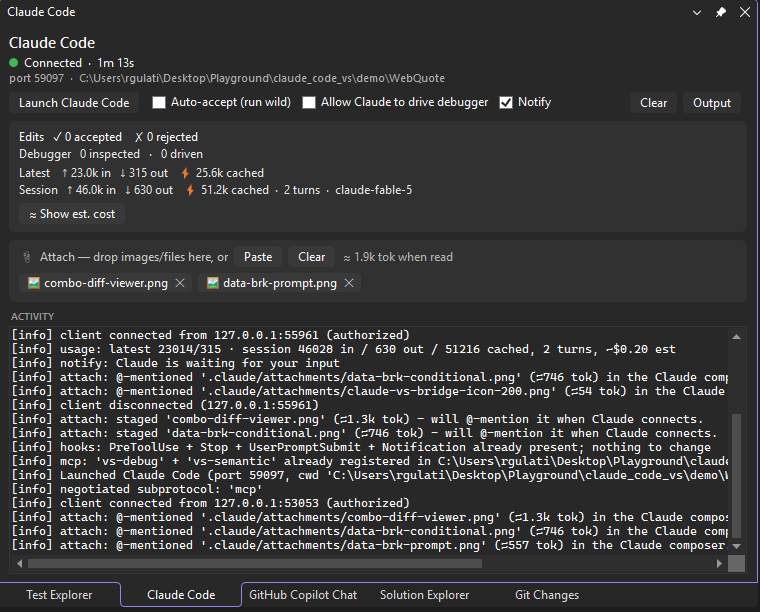
Pasting a screenshot into the Claude Code CLI on Windows silently does nothing (a long-open upstream gap), and a screenshot is not a file you can drag. The panel closes that gap: take the capture, click Paste (or Ctrl+V in the panel, or drop files from Explorer), and the extension stages it and pushes an @ reference straight into the CLI's input box - the same at_mentioned protocol message the official VS Code plugin uses, verified to deliver the actual pixels, not just a path. You type your question around the chip and send.
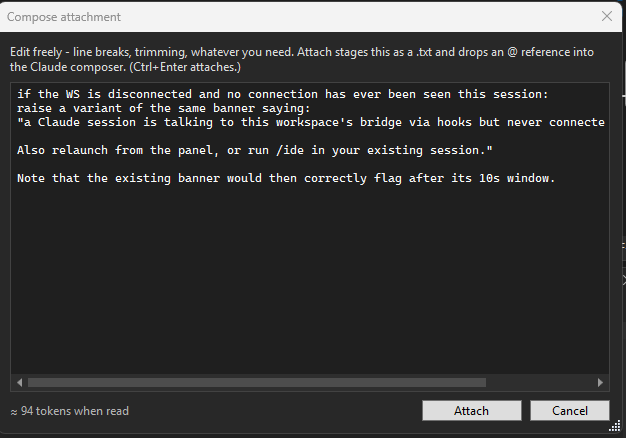
Text gets a composer (1.15.0): pasting or dragging multi-line text opens an editor to review and shape it first - line breaks, trimming, a live token estimate - and Attach stages it as a .txt with its @ reference in the CLI. The Compose button opens the same editor empty, which is the pleasant way to write multi-line prompt material from scratch.
Every attachment shows an estimated token cost before you send - on the chip's tooltip, and totaled next to the tray. A full screenshot and a 4K one both land near ~1.5k tokens (the API downscales), while a tight Win+Shift+S crop costs a fraction of that, and a 2 MB JSON log announcing ≈212k tokens is your cue to ask Claude to Grep it instead of reading it whole. Formats Claude cannot read directly (Excel, video, archives) still attach - the chip is labeled, Claude gets the path, and it reaches for a script or tool on its own. BMPs are transcoded to vision-ready PNGs automatically. Files already in your workspace are referenced in place; everything else is copied into a gitignored .claude/attachments/ so reads never hit a permission prompt.
Claude takes its own screenshots
With the Allow screen capture toggle on, Claude stops asking you for screenshots and takes its own: the debugged app's window, any window by title (the browser running your site), or the screen. Asked only "in one of my monitors I have an image, a notepad, and a documentation file - screen grab that and tell me what you see", it captured the desktop once (≈922 tokens) and read all three: the sunflower photo described, the Notepad numbers transcribed digit-for-digit, the visible .NET 11 doc bullets summarized.
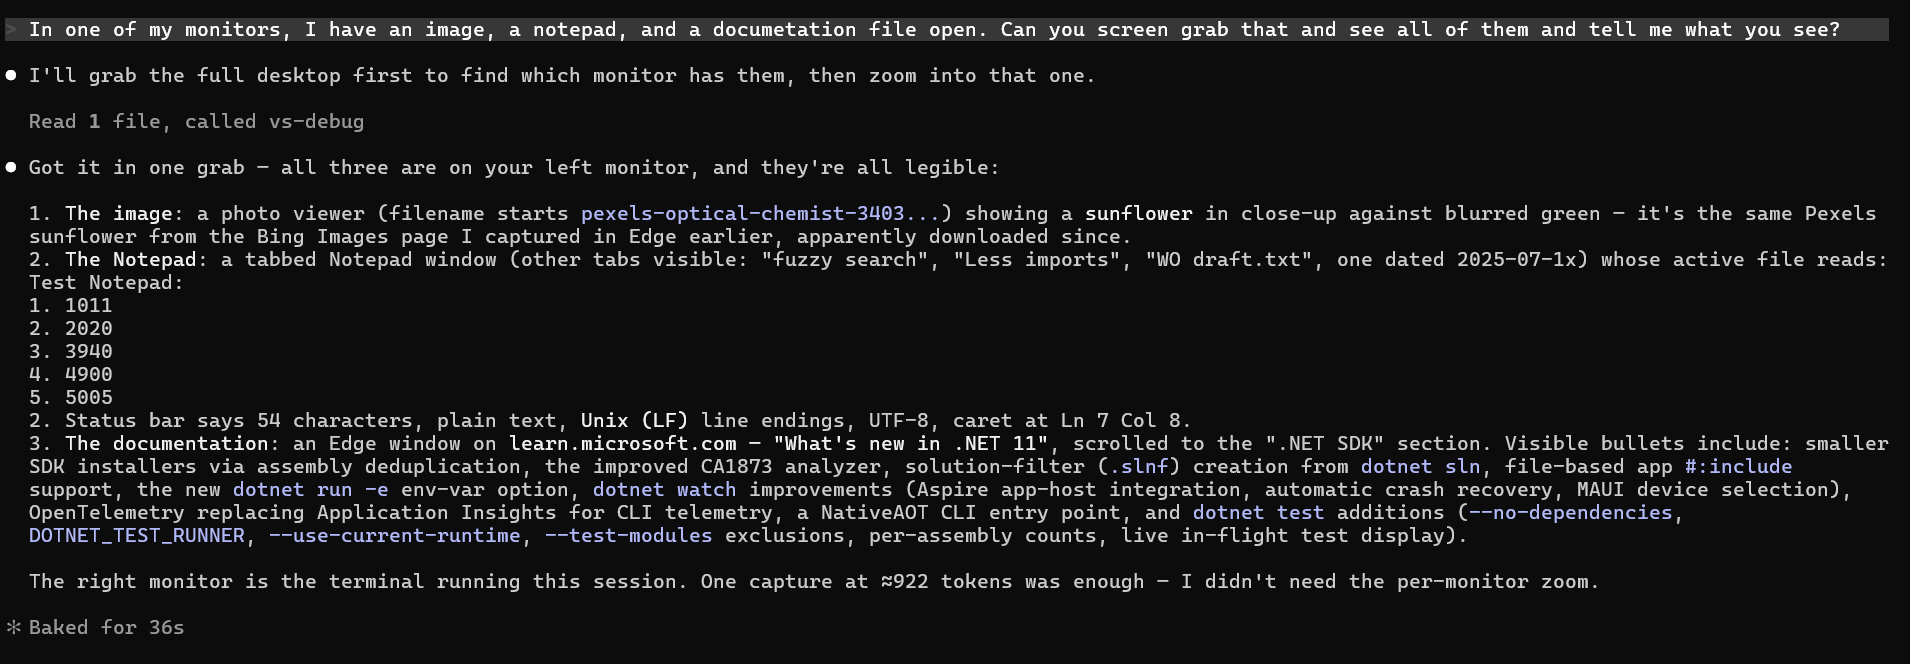
Every capture is staged as a visible chip in the attachment tray and logged in the activity feed, so what Claude saw is never invisible to you. The full story - the browser flow for web apps, the debugger composition, safety and limitations - is in docs/VISION.md.
Claude Code for Visual Studio MCP Fragen
Welche Version von Visual Studio wird unterstützt?
Aktuell wird nur Visual Studio 2026 unterstützt.
Ist dies ein offizielles Produkt von Anthropic?
Nein, dies ist ein inoffizielles Community-Projekt und steht nicht mit Anthropic in Verbindung.
Kann Claude den Visual Studio Debugger nutzen?
Ja, Claude kann den Runtime-Status inklusive Call Stacks und Variablen sehen und den Debugger steuern, um durch den Code zu steppen oder Breakpoints zu setzen.
Wie übernimmt Claude die Code-Navigation?
Es nutzt die Roslyn-basierte semantische Navigation, um Referenzen, Definitionen und Hierarchien zu finden, anstatt nur eine einfache Textsuche durchzuführen.