
PerformanceMonitor MCP server
Commit 15. Nov. 2026Ermöglicht es einem AI-Client, gesammelte SQL Server und PostgreSQL Performance-Daten, Alerts und Execution Plans zur Analyse abzufragen.
Auch bekannt als erikdarlingdata/PerformanceMonitor
- Stars
- 536
- Tools
- —
- Downloads, 30 Tage
- —
- Neueste Version
- —
- Letzter Commit
- 15. Nov. 2026
- Lizenz
- MIT
Was ist PerformanceMonitor MCP?
PerformanceMonitor ist ein MCP server. Ermöglicht es einem AI-Client, gesammelte SQL Server und PostgreSQL Performance-Daten, Alerts und Execution Plans zur Analyse abzufragen.
Zusammenfassung generiert aus dem README des Projekts
Über PerformanceMonitor MCP server
PerformanceMonitor ermöglicht es Datenbankadministratoren und Entwicklern, SQL Server und PostgreSQL Performance-Daten direkt aus einem AI-Client heraus zu analysieren. Durch die Verbindung eines AI Agents mit dem integrierten MCP server können Nutzer gesammelte Performance-Metriken, Echtzeit-Alerts und Execution Plans abfragen, um Datenbankprobleme zu diagnostizieren. Das System bietet zwei verschiedene Betriebsmodi: Lite, eine einzelne Desktop-Anwendung für die Remote-Überwachung auf Abruf unter Verwendung von lokalem DuckDB und Parquet-Dateien, und Darling, ein Service für die kontinuierliche 24/7-Sammlung in einem zentralen PostgreSQL-Store.
Je nach verwendeter Edition kann der AI Agent mehr als nur Berichte lesen. Während Lite auf die Untersuchung fokussiert ist, erlaubt die Darling Edition dem Agent, aktiv zu werden, indem er Alert-Einstellungen ändert, Query Store Plans erzwingt oder aufhebt, Module neu kompiliert oder sogar Sessions killt. Alle Aktionen unterliegen vom Nutzer aktivierbaren Schaltern, um die volle Kontrolle zu gewährleisten. Dieses Setup funktioniert in verschiedenen Umgebungen, einschließlich On-Premises-Servern, Azure SQL Managed Instance, AWS RDS und verschiedenen PostgreSQL-Versionen.
Was du damit machen kannst
- 1Datenbankprobleme automatisch behebenEin Entwickler kann eine KI damit beauftragen, Execution Plans zu verwalten oder problematische Sessions zu beenden.
- 2Datenbank-Alert-Konfigurationen verwaltenNutzer können einen AI Client verwenden, um anzupassen, wie das Monitoring-System sie über Probleme benachrichtigt.
Geschrieben aus dem README des Projekts. Jeder Use Case wurde gegen ein Zitat daraus geprüft.
Automatisierte Checks
Geluften am 14. Nov. 2026Vollständiger Bericht →Noch nicht verifiziert. Ein Server benötigt einen Score von 80, keine kritischen Befunde und genug Daten für unsere Prüfung. Wie die Checks funktionieren · Was du für mehr Punkte verbessern kannst

- Source Repository verknüpft und erreichbarerikdarlingdata/performancemonitor is public and reachablegithub.com/erikdarlingdata/performancemonitor ↗Bestanden
- Paket nennt dieses Repository als QuelleNicht geprüft
- Build-Provenienz (Sigstore-Attestierung)Nicht geprüft
- Open Source Lizenz (OSI)MITspdx.org/licenses/MIT.html ↗Bestanden
- Commit oder Release im letzten JahrLast commit or release 2026-11-13github.com/erikdarlingdata/performancemonitor ↗Bestanden
- OpenSSF ScorecardNicht geprüft
- Package-Name ähnelt keinem populären PackageNicht geprüft
- Keine kritischen Advisories im Paket oder seinen AbhängigkeitenNicht geprüft
- Keine versteckten Anweisungen an das Modell0 tool descriptions and the README read; no override phrases, credential paths or hidden charactersBestanden
- Destruktive Tools sind markiertNicht geprüft
- Remote-Endpoint beantwortet den MCP-HandshakeNicht geprüft
README
Auf GitHub ansehenSQL Server Performance Monitor
Free, open-source monitoring that replaces the tools charging you thousands per server per year. It includes specialized collectors, real-time alerts, and a built-in MCP server for AI analysis. Nothing phones home. Your data stays on your server and your machine.
If you pay for a monitoring tool now, read the comparison for yours.
Redgate SQL Monitor · SQL Sentry · SolarWinds DPA · Idera SQL Diagnostic Manager · Quest Spotlight · Datadog Database Monitoring · Database Health Monitor
It supports SQL Server 2016 SP2 to 2025. SQL Server 2017 needs CU3 or later. It also supports Azure SQL Managed Instance, AWS RDS for SQL Server, and Azure SQL Database (Lite and Darling). Darling also monitors PostgreSQL. It supports PostgreSQL 14 to 18, plus Amazon RDS, Aurora and Azure Database for PostgreSQL, and makes a best effort on PostgreSQL 10 to 13. See Supported PostgreSQL versions.
Editions
- Lite is a single desktop app that monitors your servers remotely, on demand. Nothing is installed on your server. It stores data in local DuckDB and Parquet files.
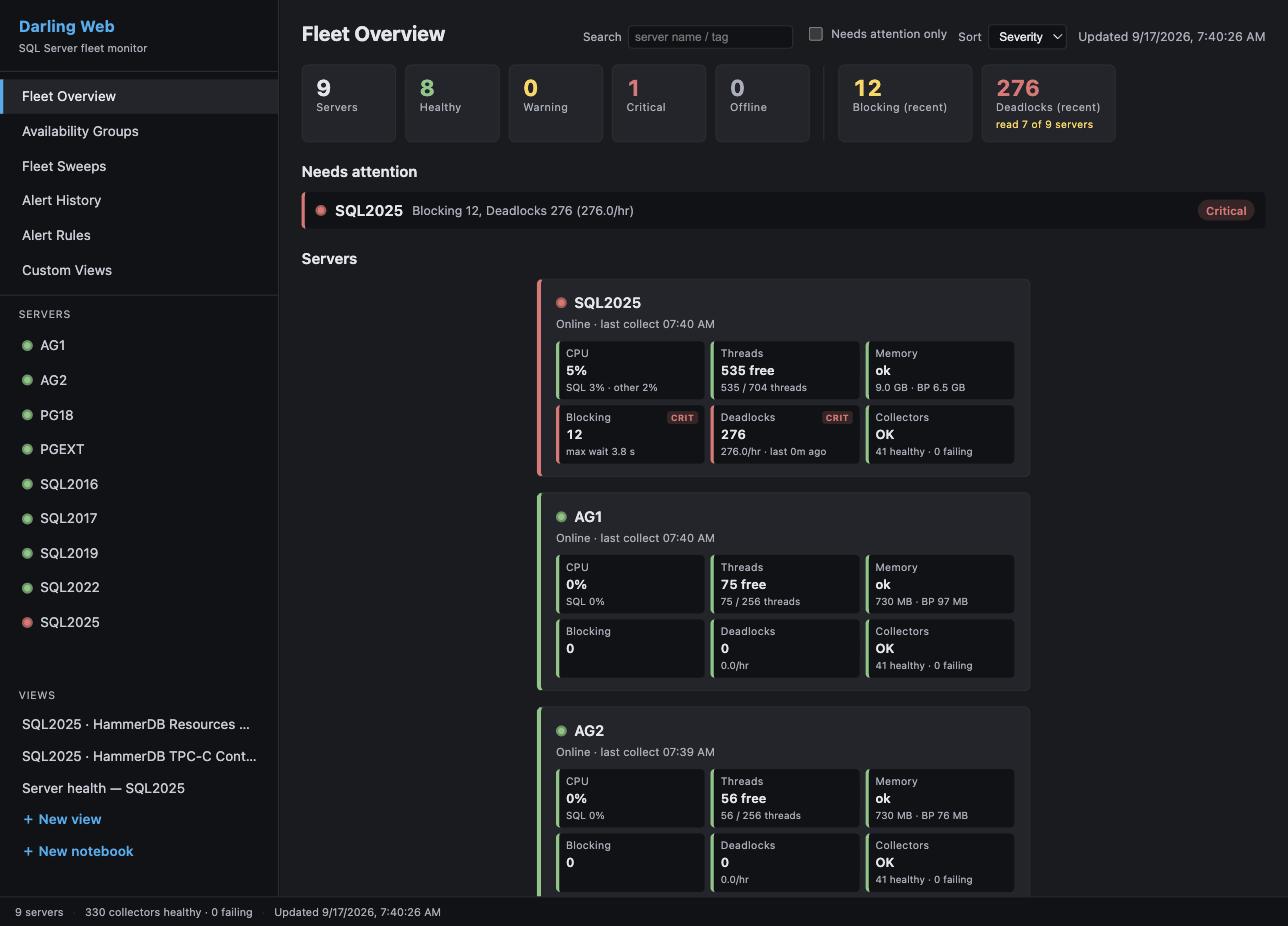
- Darling is a service on Windows or Linux that collects 24/7 into a central PostgreSQL store. The Windows viewer and the web dashboard read that store from any seat.
Both editions can hand an alert to an AI agent that you run, and Lite lets the agent read and report. Darling can also let it change alert settings (mutes, custom alert rules and thresholds). On a server, it can force or unforce a Query Store plan or evict a cached plan. It can recompile a module, create or drop a plan guide, or kill a session. Each of these has its own switch per server, and all are off until you turn them on. Darling records every change. A person can undo alert-setting changes, plan forces and plan guide changes. A plan eviction, a recompile or a session kill cannot be undone. Agent dispatch explains the levels.
The Dashboard edition is deprecated. Existing installs keep working, but we recommend Lite or Darling for new deployments. Choosing an edition compares all three.
Each release ships these downloads. For Lite, a Setup.exe and a portable ZIP. For Darling, the service ZIP (with the viewer inside), a Viewer Setup.exe for a remote seat, and the Linux and Compose tarballs. The Full Dashboard and its CLI installer ship nothing. Their last builds are in the v3.2.0 release.
Not sure which one? Start with Lite. It is one download, nothing is installed on your server, and data starts to flow in under 5 minutes.
Quick start: Lite
- Download
PerformanceMonitorLite-lite-Setup.exe. It is a self-contained build, so you do not install a .NET runtime first. - Run the installer. It adds Start Menu and Desktop shortcuts.
- Start Lite from the Start Menu or the Desktop shortcut.
- Click + Add Server, enter the connection details, test, and save.
- Double-click the server in the sidebar to connect.
Data starts to flow within 1 to 5 minutes. The monitoring login needs VIEW SERVER STATE (Permissions).
Before you upgrade an older install with Setup.exe, read the warning in the Lite guide. On versions older than 3.4.0, Setup.exe deletes the data in the install directory (see Upgrading an install older than 3.4.0). The Lite guide also covers the portable ZIP, collectors, storage, and configuration.
Quick start: Darling
- Download
PerformanceMonitorDarling-<version>.zipandSHA256SUMS.txtfrom the latest release. Check the zip hash againstSHA256SUMS.txt. The zip carries its own .NET runtime, so there is nothing to install first. - Extract the zip to
C:\Program Files\PerformanceMonitorDarling. Do not use your Desktop, Downloads, or any folder underC:\Users\. The service runs as a virtual account that cannot read a user profile (why). - Double-click
Install-Darling.cmdin the install folder. It asks Windows for administrator rights and runsinstall-darling.ps1. You can also run.\install-darling.ps1from an elevated PowerShell. It installs the Windows service and creates a Darling Viewer shortcut. With nodarling.jsonit writes a minimal one, and the service starts with no monitored servers. - Wait about two minutes for the first start, then open Darling Viewer. It opens on the fleet.
- Add your first server in the viewer.
darling.jsonis only a seed. The service reads it on its first start, so a server added to the file later is ignored (why). - The service log is in
%ProgramData%\PerformanceMonitorDarling\logs.
Install Darling gives each step with the log line or screen that proves it worked. To upgrade, run upgrade-darling.ps1. To remove the service, run uninstall-darling.ps1. Both are in the install folder. For Linux and the web dashboard, read the Darling quick start. The Darling operator guide is the configuration reference.
Documentation
| Page | What it covers |
|---|---|
| Choosing an edition | Lite, Darling, and Dashboard side by side |
| Features and screenshots | What you get, with screenshots |
| Lite guide | Install, upgrade, where Lite keeps its files, configuration, appearance, collectors |
| Lite Extended Events sessions | The sessions Lite creates on a monitored server, and how to remove them |
| Darling quick start | Install on Windows, Linux notes, web dashboard |
| Darling operator guide | Darling configuration, permissions, operations |
| Darling store sizing | Disk, RAM and vCPU for a store host, by number of servers |
| Back up, restore and move the store | Back up a Darling store, restore it, or move it to another machine |
| Darling guides | Install, viewer, web dashboard, MCP, day-to-day admin and command line reference |
| PostgreSQL target runbook | Point Darling at a PostgreSQL target, with a proof point at each step |
| Retention Held runbook | Clear a Retention Held alert |
| How collection works | A tour of the collection pipeline, for people who read the code |
| Documentation index | Every page in docs/, grouped by audience |
| Tabs | What each tab shows |
| Alerts and notifications | Alert types, channels, routes, email |
| Agent dispatch | Hand an alert to your own AI agent: levels, the brief and report, undo, the remediation login |
| Signed webhooks | Verify that a generic webhook post came from Darling |
| Agent job monitoring | Running SQL Agent jobs and jobs that run longer than expected |
| MCP server | Setup, the tool list and the Lite investigation tools for AI analysis |
| Authentication | Authentication types and credential profiles |
| Permissions | Grants for on-premises, Azure, and AWS RDS. The optional agent remediation login is in Agent dispatch |
| Platform notes | AWS RDS and Aurora configuration |
| Performance impact | Load on monitored servers, and local resources for Lite |
| Troubleshooting | Common problems for Lite and Darling |
| Building from source | Folder structure and build commands |
| Support and sponsorship | Commercial support tiers and sponsorship |
| Third-party components | Third-party components and their licenses |
| Changelog | Changes in each release |
Support
Performance Monitor is free and open source under the MIT License, with no features withheld. The tools that it replaces charge thousands of dollars per server per year. A support subscription covers all of your SQL Server instances.
| Tier | Cost per year | Email response | Includes |
|---|---|---|---|
| Supported | $500 | Within 2 business days | Guaranteed compatibility updates for new SQL Server versions, priority feature requests, a support agreement and invoices, unlimited instances |
| Priority | $2,500 | By the next business day | Everything in Supported, plus a quarterly live Q&A session, early access to new features, and direct input on the roadmap |
Support and sponsorship says what support gets you and has the link to buy. You can also sponsor on GitHub.
Sponsors
License
Copyright (c) 2026 Darling Data, LLC. Licensed under the MIT License. See LICENSE for details.
Author
Erik Darling: erikdarling.com and Darling Data, LLC
PerformanceMonitor MCP Fragen
Welche Datenbanken kann PerformanceMonitor überwachen?
Es überwacht SQL Server 2016 SP2 bis 2025, Azure SQL Managed Instance, AWS RDS für SQL Server sowie PostgreSQL 14 bis 18 inklusive RDS, Aurora und Azure Database for PostgreSQL.
Benötigen die AI Agents spezielle Berechtigungen, um Alert-Einstellungen zu ändern?
Sie erhalten diese Berechtigung nur, wenn du sie pro Server aktivierst; alle entsprechenden Schalter sind standardmäßig deaktiviert und jede Änderung wird protokolliert.
Welche Editionen bietet PerformanceMonitor an?
Zwei Haupteditionen: Lite, eine einzelne Desktop-App, die Daten lokal speichert, und Darling, ein Service, der rund um die Uhr in einem zentralen PostgreSQL-Store sammelt.
Ist PerformanceMonitor kostenlos?
Ja, es ist kostenlos und Open Source unter der MIT License, ohne eingeschränkte Funktionen; kostenpflichtige Support-Abos sind optional.
Wie starte ich mit PerformanceMonitor?
Beginne mit Lite: ein Download, nichts auf deinem Server installieren, und die Daten fließen innerhalb weniger Minuten.