
debugium MCP server
✓ VerifiziertBietet einen KI-gestützten Multi-Language-Debugger mit einer Echtzeit-Web-UI und 64 MCP Tools für LLM-integrierte Debugging-Sessions.
Auch bekannt als Algiras/debugium, @algiras/debugium
- Stars
- 4
- Tools
- —
- Downloads, 30 Tage
- 278
- Neueste Version
- 1.0.0
- Letzter Commit
- 16. März 2026
- Lizenz
- —
Was ist debugium MCP?
debugium ist ein MCP server. Bietet einen KI-gestützten Multi-Language-Debugger mit einer Echtzeit-Web-UI und 64 MCP Tools für LLM-integrierte Debugging-Sessions.
Zusammenfassung generiert aus dem README des Projekts
Über debugium MCP server
Debugium bietet eine Multi-Language-Debugging-Umgebung für Entwickler, die tiefe Code-Inspektion in KI-gestützte Workflows integrieren möchten. Es unterstützt eine breite Palette von Sprachen wie Python, JavaScript, TypeScript, C, C++, Rust, Java, Scala und WebAssembly, indem es als Proxy für verschiedene Debug Adapter Protocol Adapter fungiert. Nutzer können mit ihren Debugging-Sessions über eine Echtzeit-Web-UI interagieren, die einen Source Viewer, Variable Expansion und einen Call Stack bietet, oder über eine CLI mit 13 Subcommands.
Der Server ist für die LLM-Integration über das Model Context Protocol konzipiert und stellt 64 spezialisierte Tools für Clients wie Claude bereit. Diese Tools ermöglichen es einer KI, komplexe Aufgaben auszuführen, wie zum Beispiel so lange zu stepfen, bis sich eine Variable ändert, Exceptions zu erklären oder Snapshots des Programmzustands zu vergleichen. Entwickler können Sessions lokal ausführen oder sich mit Remote-Prozessen verbinden, die in Containern oder auf anderen Maschinen laufen. Das System unterstützt zudem Multi-Session-Management sowie den Export und Import von Sessions, um Debugging-Wissen über verschiedene Arbeitssitzungen hinweg zu bewahren.
Was du damit machen kannst
- 1Überwachung von ZustandsänderungenEin Entwickler kann eine KI anweisen, den Code so lange auszuführen, bis ein spezifischer Variablenwert geändert wird.
- 2Remote-Prozess-InspektionDu kannst den Debugger mit einem Prozess verbinden, der bereits auf einer anderen Maschine oder innerhalb eines Containers läuft.
- 3Kontextuelle Debugging-SnapshotsEin LLM kann den gesamten aktuellen Zustand des Programms, einschließlich Quellcode und lokaler Variablen, in einer einzigen Anfrage abrufen.
Geschrieben aus dem README des Projekts. Jeder Use Case wurde gegen ein Zitat daraus geprüft.
So installierst du debugium MCP
Formate geprüft am 10. Nov. 2026Zu Cursor hinzufügenZu Goose hinzufügendebugium MCP in Claude Code installieren
$ claude mcp add debugium -- npx -y @algiras/debugiumdebugium MCP in Cursor installieren
~/.cursor/mcp.json
{
  "mcpServers": {
    "debugium": {
      "command": "npx",
      "args": [
        "-y",
        "@algiras/debugium"
      ]
    }
  }
}debugium MCP in VS Code installieren
.vscode/mcp.json
{
  "servers": {
    "debugium": {
      "type": "stdio",
      "command": "npx",
      "args": [
        "-y",
        "@algiras/debugium"
      ]
    }
  }
}debugium MCP in VS Code CLI installieren
$ code --add-mcp '{"name":"debugium","type":"stdio","command":"npx","args":["-y","@algiras/debugium"]}'debugium MCP in Claude Desktop installieren
claude_desktop_config.json
{
  "mcpServers": {
    "debugium": {
      "command": "npx",
      "args": [
        "-y",
        "@algiras/debugium"
      ]
    }
  }
}debugium MCP in Codex installieren
$ codex mcp add debugium -- npx -y @algiras/debugiumdebugium MCP in Codex config.toml installieren
~/.codex/config.toml
[mcp_servers.debugium]
command = "npx"
args = ["-y", "@algiras/debugium"]
debugium MCP in Gemini CLI installieren
$ gemini mcp add -s user debugium npx -- -y @algiras/debugiumdebugium MCP in Gemini settings.json installieren
~/.gemini/settings.json
{
  "mcpServers": {
    "debugium": {
      "command": "npx",
      "args": [
        "-y",
        "@algiras/debugium"
      ]
    }
  }
}Automatisierte Checks
Geluften am 15. Nov. 2026Vollständiger Bericht →Unsere automatisierten Checks bestanden. Das ist kein Security-Audit: Lies den Code und gib dem Server nur den minimal notwendigen Zugriff. Wie die Checks funktionieren · Was du für mehr Punkte verbessern kannst

- Source Repository verknüpft und erreichbaralgiras/debugium is public and reachablegithub.com/algiras/debugium ↗Bestanden
- Paket nennt dieses Repository als Quelle@algiras/debugium names algiras/debugium as sourcenpmjs.com/package/@algiras/debugium ↗Bestanden
- Build-Provenienz (Sigstore-Attestierung)No build attestation published for this releaseNicht geprüft
- Open Source Lizenz (OSI)No licenseBefund
- Commit oder Release im letzten JahrLast commit or release 2026-03-16github.com/algiras/debugium ↗Bestanden
- OpenSSF ScorecardNicht geprüft
- Package-Name ähnelt keinem populären PackageNo popular package one edit away from @algiras/debugiumBestanden
- Keine kritischen Advisories im Paket oder seinen Abhängigkeiten1 resolved dependencies checked; no critical advisoryosv.dev ↗Bestanden
- Keine versteckten Anweisungen an das Modell0 tool descriptions and the README read; no override phrases, credential paths or hidden charactersBestanden
- Destruktive Tools sind markiertNicht geprüft
- Remote-Endpoint beantwortet den MCP-HandshakeNicht geprüft
README
Auf GitHub ansehenDebugium
A multi-language debugger with a real-time web UI and LLM integration via MCP.
Debug Python, JavaScript, TypeScript, C, C++, Rust, Java, Scala, and WebAssembly programs from your browser — with AI-driven analysis through the Model Context Protocol.


Features
Web UI
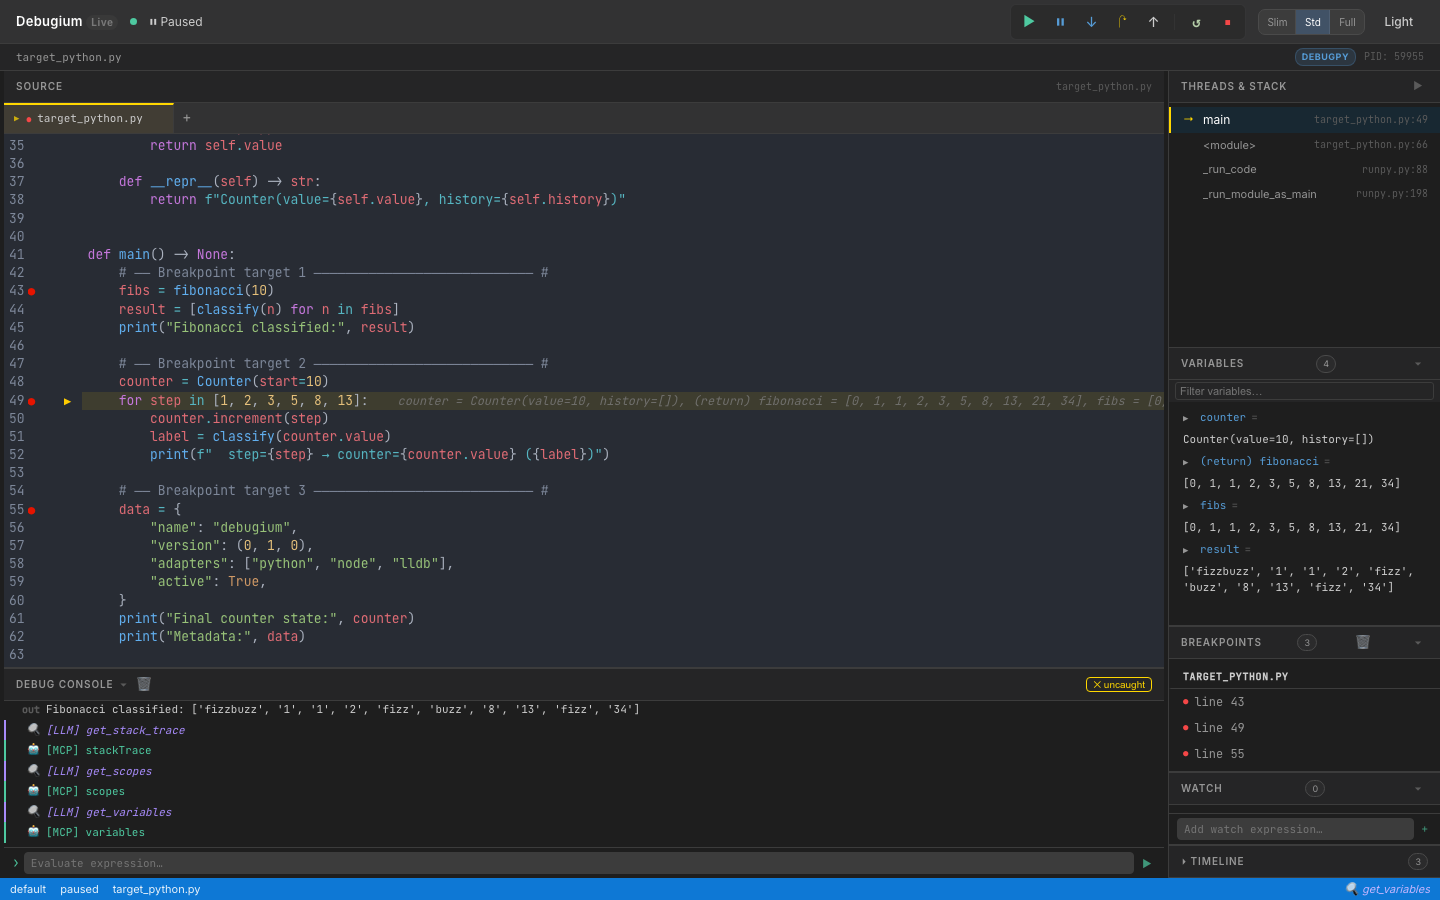
- Real-time web UI — source viewer, breakpoints, variables (recursive expansion), call stack, console, timeline, watch expressions, findings — all updated live via WebSocket
- Multi-tab source viewer — open multiple files, click stack frames to navigate
- Variable search — filter variables by name with recursive expansion
- Changed-variable highlighting — variables that changed since last stop shown in orange
- Thread selector — switch between threads in multi-threaded programs
- Panel collapse & resize — drag to resize, toggle to collapse; Slim / Standard / Full layout presets
- Dark / light mode toggle
- Auto-reconnect — UI reconnects after a dropped WebSocket, with visual status indicator
- Keyboard shortcuts — F5 continue, F10 step over, F11 step in, Shift+F11 step out, Ctrl/Cmd+D dark mode
- Button animations — in-flight spinner and completion flash for debug commands
Debugging
- Multi-language — Python (debugpy), Node.js/TypeScript (js-debug), C/C++/Rust (lldb-dap), Java (java-debug), Scala (Metals), WebAssembly (lldb-dap), or any DAP adapter via
dap.json - Comprehensive DAP coverage — 35+ DAP requests: breakpoints, stepping, goto, memory read/write, disassembly, and more
- Breakpoints — conditional, logpoints, hit-count, function, data (watchpoints), exception, run-to-cursor (
continue_until) - Multi-session — debug multiple programs simultaneously, with child session routing (js-debug)
- Remote debugging — attach to debugpy, JDWP, or Node inspector running on another machine or container
LLM / MCP Integration
- 64 MCP tools — the full debug session exposed to Claude or any LLM
- Capability-gated tools — tools automatically shown/hidden based on adapter capabilities
- Compound tools —
get_debug_context(orient in one call),step_until,step_until_change,run_until_exception,explain_exception,get_call_tree,compare_snapshots,find_first_change - Execution timeline — every stop recorded with changed variables and stack summary
- Watch expressions — evaluated automatically at every breakpoint, manageable by LLM or UI
- Annotations & findings — pin notes to source lines, record conclusions visible in the UI
- Session export/import — save and restore debugging knowledge across sessions
CLI Control
- Full CLI — 13 subcommands to drive sessions from a second terminal without the web UI
- Auto-discovery — port file at
~/.debugium/port, session logs in~/.debugium/sessions/
Install
Claude Code Plugin (recommended)
/plugin marketplace add Algiras/debugium
/plugin install debugium@debugium
Then add to your project's .mcp.json (see MCP Tools below).
macOS / Linux binary
curl -fsSL https://raw.githubusercontent.com/Algiras/debugium/main/install.sh | bash
From source
# Prerequisites: Rust stable + wasm-pack
cargo install wasm-pack

# Build UI
wasm-pack build crates/debugium-ui --target web --out-dir pkg
cp crates/debugium-ui/pkg/cm_init.js         crates/debugium-ui/dist/pkg/
cp crates/debugium-ui/pkg/debugium_ui.js      crates/debugium-ui/dist/pkg/
cp crates/debugium-ui/pkg/debugium_ui_bg.wasm crates/debugium-ui/dist/pkg/

# Build & install server
cargo install --path crates/debugium-server
Usage
Debug a Python file
debugium launch my_script.py --adapter python
Debug a Node.js / TypeScript file
debugium launch app.js --adapter node
debugium launch app.ts --adapter typescript
Debug C / C++ / Rust
# C or C++ (compile with -g for debug info)
cc -g -O0 main.c -o main && debugium launch ./main --adapter lldb
c++ -g -O0 main.cpp -o main && debugium launch ./main --adapter lldb

# Rust
cargo build && debugium launch target/debug/my_binary --adapter lldb
Debug Java / Scala
# Java (requires microsoft/java-debug adapter)
debugium launch MainClass --adapter java

# Scala (connect to a running Metals DAP server)
debugium launch build-target --adapter metals
debugium launch build-target --adapter metals:5005  # custom port
Attach to a running process (remote debugging)
# Python (debugpy listening on port 5678)
debugium attach --port 5678 --adapter python

# Java (JDWP on port 5005)
debugium attach --port 5005 --adapter java

# Node.js (inspector on port 9229)
debugium attach --port 9229 --adapter node
Or via MCP: attach_session(port=5678, adapter="python", breakpoints=["/path/app.py:42"])
Use a custom adapter via dap.json
# Create a dap.json (see dap.json.example) then:
debugium launch my_program --config ./dap.json

# Or place dap.json in cwd / .debugium/ for auto-discovery:
debugium launch my_program   # finds ./dap.json automatically
Set initial breakpoints
debugium launch my_script.py --adapter python \
  --breakpoint /abs/path/my_script.py:42 \
  --breakpoint /abs/path/helpers.py:15
Enable LLM / MCP integration
Add a .mcp.json to your project root (Claude Code picks this up automatically):
{
  "mcpServers": {
    "debugium": {
      "command": "debugium",
      "args": ["mcp"]
    }
  }
}
Then launch the session normally — the MCP server connects to whichever port is active:
debugium launch my_script.py --adapter python --breakpoint /abs/path/my_script.py:42
Claude Code will now have access to all Debugium MCP tools. See CLAUDE.md for the recommended workflow and SKILL.md for the full tool reference.
CLI Control Commands
Once a session is running (debugium launch …), you can drive it from a second terminal — or from an LLM agent — without touching the web UI.
Port is auto-discovered from ~/.debugium/port; override with --port.
Global flags (all subcommands)
| Flag | Default | Description |
|---|---|---|
--port PORT |
~/.debugium/port |
Server port to connect to |
--session ID |
default |
Session to target |
--json |
off | Print raw JSON instead of human-readable output |
Inspection
debugium sessions                  # list active sessions
debugium threads                   # list threads
debugium stack                     # show call stack
debugium vars                      # show local variables (auto-resolves top frame)
debugium vars --frame-id 2         # show variables for a specific frame
debugium eval "len(fibs)"          # evaluate expression in top frame
debugium eval "x + 1" --frame-id 2
debugium source path/to/file.py    # print full source file
debugium source path/to/file.py --line 43  # windowed ±10 lines with → marker
debugium context                   # full snapshot: paused-at, stack, locals, source, breakpoints
debugium context --compact         # same but truncated (3 frames, 10 vars)
Breakpoints
debugium bp set FILE:LINE [FILE:LINE …]   # set breakpoints (replaces existing in that file)
debugium bp list                          # list all breakpoints
debugium bp clear                         # clear all breakpoints
Execution control
debugium continue                  # resume execution
debugium step over                 # step over (next line)
debugium step in                   # step into a function call
debugium step out                  # step out of current function
UI annotations (visible in the web UI)
debugium annotate FILE:LINE "message" [--color info|warning|error]
debugium finding "message"         [--level  info|warning|error]
Example workflow
# Terminal A — start the session
debugium launch tests/target_python.py --adapter python \
  --breakpoint "$(pwd)/tests/target_python.py:43"

# Terminal B (or LLM agent) — inspect and drive it
debugium sessions
debugium stack
debugium vars
debugium eval "len(fibs)"
debugium bp set tests/target_python.py:49
debugium continue                  # runs to line 49
debugium vars
debugium step over
debugium context --json            # machine-readable snapshot
debugium annotate tests/target_python.py:43 "called here" --color info
debugium finding "fibs has 10 elements" --level info
debugium bp clear
MCP Tools
When connected via MCP, 64 tools are available. Key ones:
| Category | Tools |
|---|---|
| Orient | get_debug_context ★ (paused location + locals + stack + source in one call) |
| Breakpoints | set_breakpoint, set_breakpoints, set_logpoint, list_breakpoints, clear_breakpoints, set_function_breakpoints, set_exception_breakpoints, set_data_breakpoint, list_data_breakpoints, clear_data_breakpoints, breakpoint_locations |
| Execution | continue_execution, step_over, step_in, step_out, pause, goto, disconnect, terminate, restart |
| Inspection | get_stack_trace, get_scopes, get_variables, evaluate, get_threads, get_source, get_capabilities, loaded_sources, source_by_reference, step_in_targets |
| Mutation | set_variable, set_expression |
| Output | get_console_output, wait_for_output (with from_line to avoid stale matches) |
| Memory | read_memory, write_memory, disassemble (native debugging) |
| History | get_timeline, get_variable_history, compare_snapshots, find_first_change |
| Annotations | annotate, get_annotations, add_finding, get_findings |
| Watches | add_watch, remove_watch, get_watches |
| Compound | step_until, step_until_change, continue_until, run_until_exception, explain_exception, get_call_tree, restart_frame |
| Session | get_sessions, list_sessions, launch_session, attach_session, stop_session, export_session, import_session |
| Control | goto_targets, cancel_request |
Note:
step_over,step_in, andstep_outare blocking — they wait for the adapter to pause before returning. Safe to chain back-to-back without sleeps.continue_executionreturnsconsole_line_countfor use withwait_for_output. Tools likeread_memory,goto, andrestart_frameonly appear when the adapter supports them.
See SKILL.md for the full reference with input schemas.
Keyboard Shortcuts
| Key | Action |
|---|---|
F5 |
Continue |
F10 |
Step Over |
F11 |
Step Into |
Shift+F11 |
Step Out |
Ctrl/⌘+D |
Toggle dark/light mode |
Architecture
debugium-server (Rust + Axum)
├── DAP proxy     — spawns / attaches to debug adapters (debugpy, js-debug, lldb-dap, java-debug, Metals, custom)
├── HTTP API      — /state, /sessions, /annotations, /findings, /watches, /timeline
├── WebSocket     — broadcasts DAP events + enriched stop data (changed vars, timeline) to UI
├── MCP stdio     — JSON-RPC 2.0 server exposing 64 tools for LLM integration
├── CLI control   — 13 subcommands to drive sessions from a second terminal
└── ~/.debugium/  — port file, session logs (events.ndjson), debug log

debugium-ui (Leptos + WASM)
├── CodeMirror 6  — source viewer with breakpoint gutters, exec arrow, LLM annotations, multi-tab
├── Reactive panels — Variables, Stack, Breakpoints, Findings, Watch, Timeline, Console (18 components)
└── WebSocket     — receives events, sends DAP commands, auto-reconnects with status indicator
Supported Languages & Adapters
| Language | --adapter flag |
Prerequisite | Verified |
|---|---|---|---|
| Python | python / debugpy |
pip install debugpy |
✅ |
| Node.js | node / js |
js-debug (bundled or build from vscode-js-debug) | ✅ |
| TypeScript | typescript / ts / tsx |
js-debug + tsx or ts-node in PATH |
✅ |
| C / C++ | lldb / codelldb |
lldb-dap (Xcode on macOS; apt install lldb on Linux) |
✅ |
| Rust | lldb / rust |
lldb-dap + cargo build |
✅ |
| Java | java / jvm |
microsoft/java-debug adapter JAR | ✅ |
| Scala | metals / scala |
Running Metals DAP server | ⚠️ (requires running Metals) |
| WebAssembly | wasm |
lldb-dap (LLVM ≥16) |
⚠️ (requires WASM-aware LLVM) |
| Any DAP adapter | --config dap.json |
See dap.json.example |
✅ |
Remote debugging
Connect to a DAP server running on another machine (or in a container):
{
  "adapterId": "debugpy",
  "request": "attach",
  "host": "192.168.1.100",
  "port": 5678,
  "pathMappings": [{ "localRoot": ".", "remoteRoot": "/app" }]
}
debugium launch app.py --config remote.json
License
MIT
debugium MCP Fragen
Wie füge ich debugium MCP zu Claude Code hinzu?
Führe claude mcp add debugium -- npx -y @algiras/debugium in deinem Terminal aus. Füge --scope user hinzu, damit der Server in jedem Projekt verfügbar ist.
Wie füge ich debugium MCP zu Cursor hinzu?
Öffne ~/.cursor/mcp.json und füge den Server unter mcpServers hinzu, mit der Cursor-Config aus dem Installationsabschnitt oben.
Welche Programmiersprachen unterstützt Debugium?
Es unterstützt Python, JavaScript, TypeScript, C, C++, Rust, Java, Scala und WebAssembly.
Wie viele MCP Tools stehen zur Verfügung?
Es stehen 64 MCP Tools zur Verfügung, darunter Tools für Breakpoints, Execution Control, Inspection und Mutation.
Kann ich einen Prozess debuggen, der auf einer anderen Maschine läuft?
Ja, du kannst Remote Debugging nutzen, um dich mit debugpy, JDWP oder dem Node Inspector zu verbinden, die auf einer anderen Maschine oder in einem Container laufen.
Wie aktiviere ich die LLM-Integration?
Du kannst sie aktivieren, indem du eine .mcp.json in dein Projektverzeichnis legst, die den debugium-Befehl mit dem mcp-Argument spezifiziert.