
GitHub Traffic Analytics MCP server
2026년 10월 17일 커밋Allows AI agents to bypass GitHub's 14-day limit by backing up, analyzing, and querying historical repository traffic metrics via a local SQLite database.
다른 이름 KikeVen/GitHub-Traffic-Analytics
- 스타
- 0
- Tools
- —
- 다운로드, 30일
- —
- 최신 버전
- —
- 마지막 커밋
- 2026년 10월 17일
- 라이선스
- MIT
GitHub Traffic Analytics MCP란?
GitHub Traffic Analytics은(는) MCP server입니다. Allows AI agents to bypass GitHub's 14-day limit by backing up, analyzing, and querying historical repository traffic metrics via a local SQLite database.
프로젝트 README에서 생성된 요약
GitHub Traffic Analytics MCP server 정보
Tracking long-term repository growth and traffic trends from inside your IDE is what this tool enables for developers. It overcomes the standard 14-day limitation of GitHub traffic metrics by automatically backing up views, clones, and visitor data into a local SQLite database. By running as a local-first Python application, it creates a permanent historical record that you can access through a FastAPI web dashboard or via an MCP server connected to agents in Cursor or VS Code.
Users interact with the system using the GitHub CLI for data ingestion and can manage multiple repositories through the web interface. The MCP server provides specific tools like get_repo_metrics, list_events, and query_sql to allow AI agents to perform deep analysis. It also includes a staleness detection mechanism to ensure that identical snapshots from the GitHub API do not create duplicate or incorrect entries in your local database.
활용 사례
- 1Correlate traffic spikes with marketingIdentify if a specific Reddit post or release caused a sudden increase in repository views or clones.
프로젝트의 README를 바탕으로 작성되었습니다. 모든 활용 사례는 해당 내용의 인용문과 대조하여 확인합니다.
구성
GITHUB_REPO
| 이름 | 설명 | 유형 |
|---|---|---|
| GITHUB_REPO | — |
README
GitHub에서 보기GitHub Traffic Analytics & Historical Data Tracker
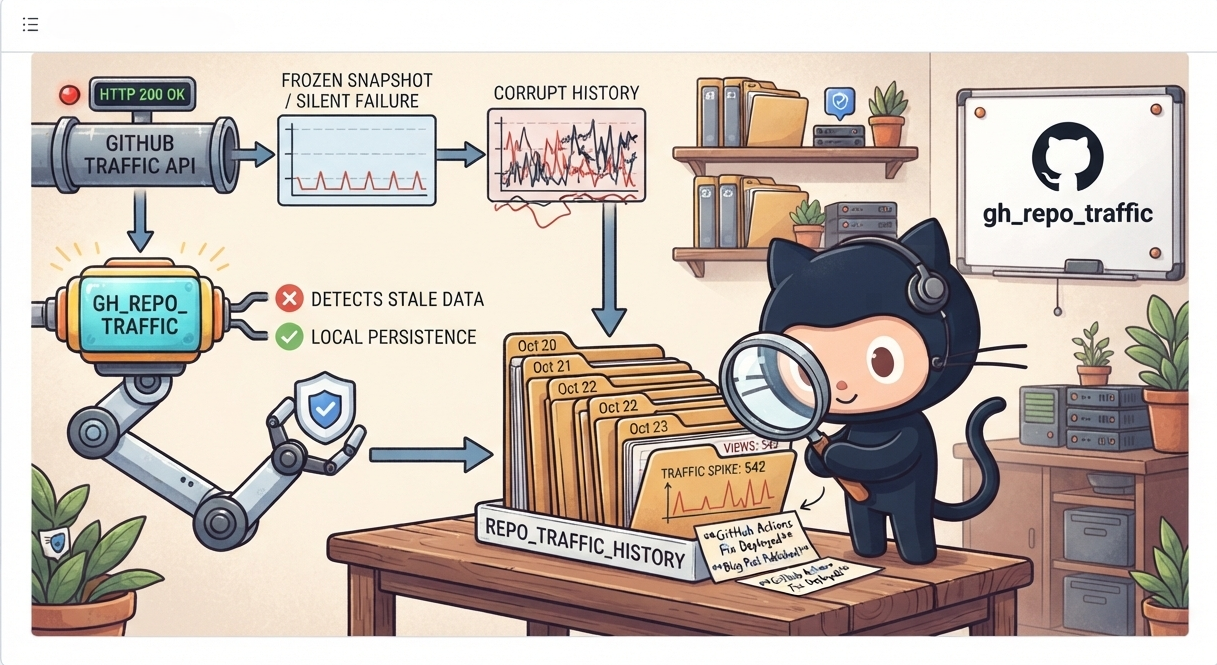





GitHub-Traffic-Analytics is a local-first Python automation tool, FastAPI web dashboard, and Model Context Protocol (MCP) server engineered to bypass GitHub's strict 14-day history limit. It automatically backs up and analyzes your repository's traffic metrics into a local SQLite database.
Visit the official GitHub Traffic Analytics Repository for full documentation and code.
Table of Contents
🚀 Key Features
- Bypass the 14-Day Limit: Permanently save historical repository metrics via automated data ingestion.
- Web UI & Visualization: Filter and analyze traffic trends with an interactive dashboard and external event logging.
- Built-in MCP Server: Allow AI agents to query your analytics database directly.
GitHub-Traffic-Analytics gives you:
- Persistent local history: daily views, clones, referrers, and paths stored in SQLite
- Event correlation: annotate your traffic timeline with the external events that moved it
- Staleness detection: skips writes when the GitHub API returns an identical frozen snapshot, so bad data never enters the historical record
- Two interfaces: a web dashboard for humans and an MCP server for IDE agents
Architecture
GitHub API
    │
    ▼
ingester.py  ──── staleness check ────► skip + warn (upstream_stale)
    │
    ▼
SQLite (app.db)
    │
    ├──► FastAPI (main.py) ──► Jinja2 templates ──► Web UI
    │         │
    │         └──► REST API (/api/metrics, /api/events, /api/sync)
    │
    └──► MCP Server (mcp_server.py) ──► IDE agents (Cursor, VS Code)
- ingester.py: Coordinates GitHub API requests and manages database persistence.
- main.py & templates/: Powers the local FastAPI server and web dashboard.
- mcp_server.py: Exposes structured analytic tools to connected LLMs.
Key files:
| File | Role |
|---|---|
main.py |
FastAPI app, REST endpoints, Pydantic models |
ingester.py |
GitHub CLI data fetch, staleness detection, sync logic |
database.py |
SQLite init, DB_PATH resolution, schema setup |
mcp_server.py |
MCP tools for LLM-driven traffic analysis |
templates/index.html |
Main dashboard: Alpine.js + Chart.js |
templates/source_detail.html |
Per-referrer/path historical chart |
Features
Traffic ingestion:
- Fetches views, clones, unique visitors, and unique cloners via the GitHub CLI
- Detects and skips upstream-stale snapshots (identical payload = no write)
UNIQUEconstraint on(repo_id, logged_date, source_type, source_or_path)prevents duplicate records- Background task execution: sync requests return immediately, ingestion runs async
Web dashboard:
- Multi-repo support: add and switch between repos from the UI
- Date range filtering on all charts
- Four traffic charts: views, unique visitors, clones, unique cloners
- Referrers and top paths with per-source historical drill-down
- Event annotations rendered as dashed vertical lines on the charts
- Tooltip footer shows matching event titles per date
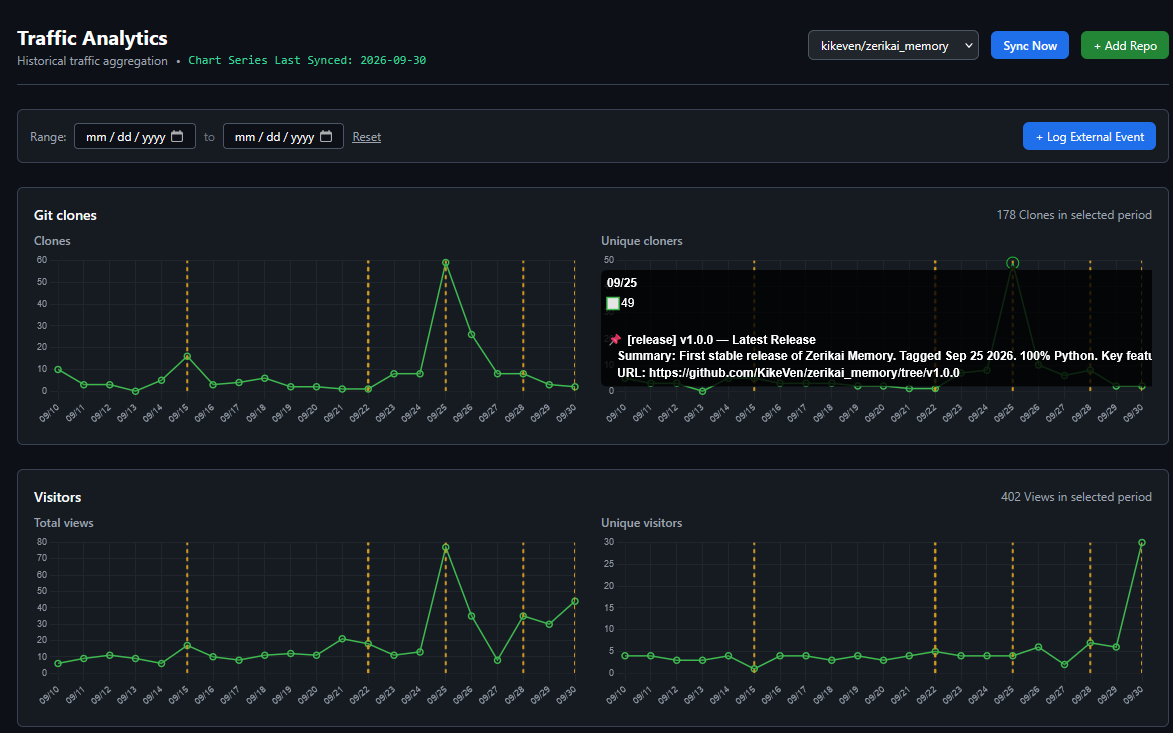
External event tracking:
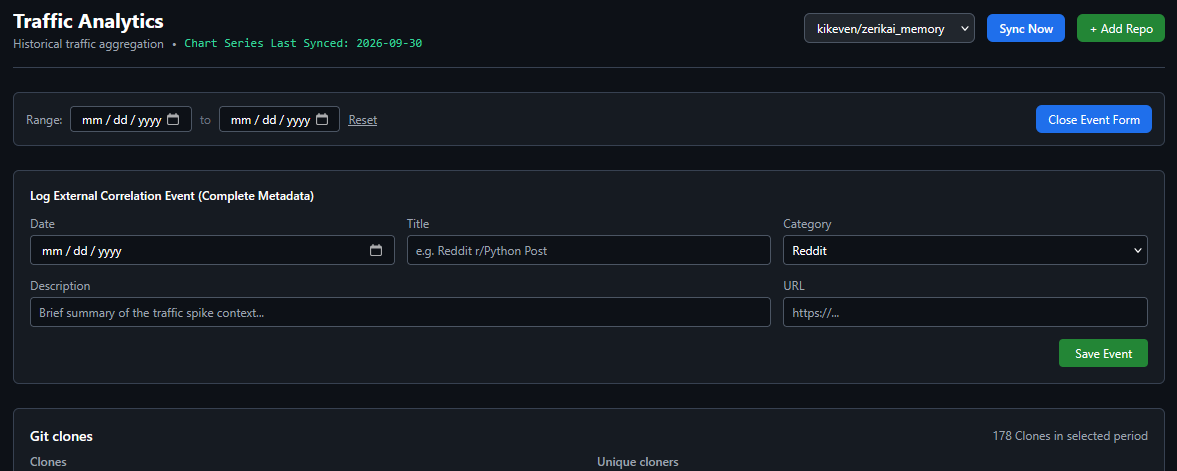
- Log Reddit posts, DEV.to articles, releases, and any external event with full CRUD
- Events are stored with
title,category,url,description, andevent_date - Correlate traffic spikes with the content or release that caused them
MCP server:
get_repo_metrics: daily traffic for a date rangelist_events: all logged external events with IDslog_external_event: create a new event (all fields required)update_external_event: edit an existing event by IDdelete_external_event: remove an event by IDquery_sql: rawSELECTaccess to the SQLite databasetrigger_ingester: on-demand sync from any MCP-connected IDE
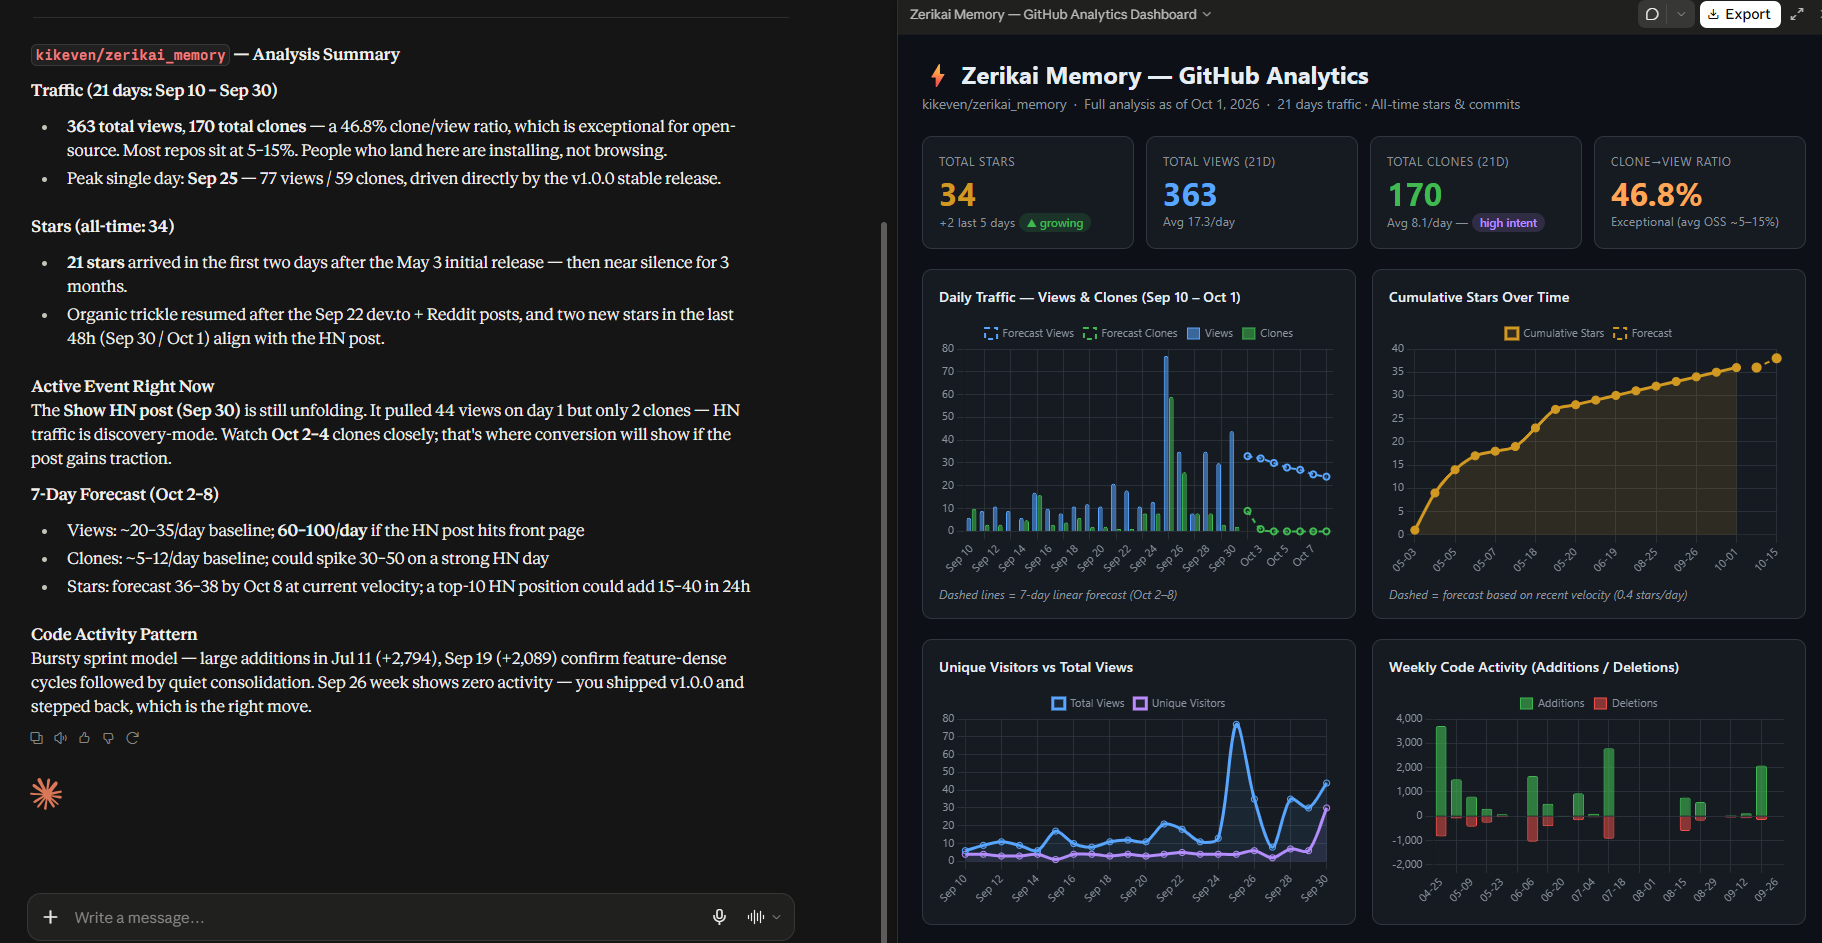 Claude Desktop: GitHub repository traffic analysis with the MCP server connected.
Analytics skill (gh-analytics-skill/SKILL.md):
An agent skill that turns the raw MCP tools into a guided analysis workflow. When exposed to an MCP-connected agent, it:
- Always calls
trigger_ingesterfirst, so answers come from fresh data — never cached - Separates organic clones from CI/bot loops (
clone_ratio ≥ 8.0) - Maps deep-funnel path conversion (issues, PRs, discussions, dependency pages) and normalized referrer buckets (Reddit, Hacker News, Google, GitHub)
- Correlates traffic and star spikes with logged external events, validating unknowns via Tavily
- Synthesizes KPIs, anomalies, star velocity, and code churn — optionally as a D3.js HTML dashboard
How to use it: register the github-analytics MCP server in your client, then make the skill file available to your agent (e.g., drop it into your skills directory). The skill triggers automatically on requests like "how's my repo traffic this month?" or "why did stars spike last week?". See gh-analytics-skill/SKILL.md for the full query templates, schema reference, and rules.
Prerequisites
1. Python 3.10+:
2. GitHub CLI: required for all data ingestion
# macOS
brew install gh

# Windows
winget install --id GitHub.cli

# Linux
# https://cli.github.com/
3. Authenticate the GitHub CLI:
gh auth login
Follow the prompts. Select HTTPS and authenticate via browser. Verify with:
gh auth status
Quick Install
# 1. Clone the repo
git clone https://github.com/KikeVen/GitHub-Traffic-Analytics.git
cd GitHub-Traffic-Analytics

# 2. Create and activate a virtual environment (Python 3.10+)
python -m venv .venv
source .venv/bin/activate      # Windows: .venv\Scripts\activate

# 3. Install dependencies
pip install -r requirements.txt

# 4. Configure your default repository
cp .env.example .env            # Windows: copy .env.example .env
# Edit .env and set GITHUB_REPO=owner/repo

# 5. Initialize the database and run the first sync
python ingester.py

# 6. Start the web server
# uvicorn main:app --reload
python main.py
Open http://localhost:8000 in your browser.
Configuration (.env):
Copy .env.example to .env and set your default repository:
GITHUB_REPO=owner/repo
GITHUB_REPO is only the default used when running python ingester.py directly. The web UI and the MCP trigger_ingester(repo="owner/repo") tool pass their own repo and override it, so you can track multiple repositories without editing .env. .env is gitignored — commit .env.example instead.
MCP server (for IDE agents):
python mcp_server.py
Add to your MCP client config (e.g., mcp.json in Claude Desktop):
{
  "mcpServers": {
    "github-analytics": {
      "command": "D:\\Users\\<username>\\<file_path>\\GitHub-Traffic-Analytics\\venv\\Scripts\\python.exe",
      "args": [
        "D:\\Users\\<username>\\<file_path>\\GitHub-Traffic-Analytics\\mcp_server.py"
      ]
    }
  }
}
Usage
Add a repository via the web UI:
Open the dashboard, enter owner/repo (e.g., <user>/<repo>) and click Add Repo. The ingester runs in the background and populates the charts.
Sync on demand:
Click Sync in the dashboard, or trigger via MCP:
trigger_ingester(repo="<user>/<repo>")
Log an external event:
Use the dashboard form or the MCP tool:
log_external_event(
    repo="<user>/<repo>",
    date="2026-09-22",
    title="Reddit post: RAG can rank but it can't judge",
    category="reddit",
    url="https://reddit.com/r/Rag/...",
    description="Posted to r/Rag, 14 upvotes, 13 comments."
)
The event appears as an annotated vertical line on all traffic charts.
Query via MCP (IDE agent):
get_repo_metrics(repo="<user>/<repo>", start_date="2026-09-10", end_date="2026-09-27")
query_sql(query="SELECT date, views_count, clones_count FROM daily_traffic WHERE repo_id = 1 ORDER BY date DESC LIMIT 14")
Roadmap
- Chart images returned directly from MCP tools (
ImageContent/ base64 PNG) for inline rendering in Cursor and VS Code -
get_traffic_sourcesMCP tool: referrers and paths without raw SQL - Automatic release ingestion from GitHub Releases API into
releases_history - PostgreSQL backend option for multi-user or higher-volume setups
- Stars history chart on the dashboard
License
MIT: see LICENSE for details.
Maintainer: @KikeVen
GitHub Traffic Analytics MCP 질문
How does this tool handle GitHub's 14-day history limit?
It uses an automated ingester to permanently save historical repository metrics into a local SQLite database, bypassing the standard limit.
What metrics can I track?
You can track daily views, clones, unique visitors, and unique cloners for your repositories.
Can I correlate traffic spikes with external events?
Yes, you can log external events like Reddit posts or releases to annotate your traffic timeline and see how they affect metrics.