
PerformanceMonitor MCP server
2026년 11월 15일 커밋AI 클라이언트가 수집된 SQL Server 및 PostgreSQL 성능 데이터, 알림, 실행 계획을 쿼리하여 분석할 수 있도록 지원합니다.
다른 이름 erikdarlingdata/PerformanceMonitor
- 스타
- 536
- Tools
- —
- 다운로드, 30일
- —
- 최신 버전
- —
- 마지막 커밋
- 2026년 11월 15일
- 라이선스
- MIT
PerformanceMonitor MCP란?
PerformanceMonitor은(는) MCP server입니다. AI 클라이언트가 수집된 SQL Server 및 PostgreSQL 성능 데이터, 알림, 실행 계획을 쿼리하여 분석할 수 있도록 지원합니다.
프로젝트 README에서 생성된 요약
PerformanceMonitor MCP server 정보
PerformanceMonitor는 데이터베이스 관리자와 개발자가 AI 클라이언트 내부에서 SQL Server 및 PostgreSQL 성능 데이터를 분석할 수 있게 해줍니다. AI 에이전트를 내장된 MCP server에 연결하면 사용자는 수집된 성능 메트릭, 실시간 알림, 실행 계획을 쿼리하여 데이터베이스 문제를 진단할 수 있습니다. 이 시스템은 두 가지 운영 방식을 제공합니다. Lite는 로컬 DuckDB 및 Parquet 파일을 사용하여 원격으로 온디맨드 모니터링을 수행하는 단일 데스크톱 애플리케이션이며, Darling은 중앙 PostgreSQL 저장소에 24/7로 지속적인 수집을 수행하는 서비스입니다.
사용하는 에디션에 따라 AI 에이전트는 단순한 보고서 읽기 이상의 작업을 수행할 수 있습니다. Lite가 조사에 집중하는 반면, Darling 에디션에서는 에이전트가 알림 설정을 변경하거나, Query Store 계획을 강제 또는 해제하거나, 모듈을 재컴파일하거나, 세션을 종료하는 등의 조치를 취할 수 있습니다. 모든 작업은 제어권을 보장하기 위해 사용자가 활성화한 스위치에 따라 수행됩니다. 이 설정은 온프레미스 서버, Azure SQL Managed Instance, AWS RDS 및 다양한 PostgreSQL 버전을 포함한 여러 환경에서 작동합니다.
활용 사례
- 1데이터베이스 문제 자동 해결개발자는 AI에게 실행 계획 관리 또는 문제 세션 종료 작업을 맡길 수 있습니다.
- 2데이터베이스 알림 구성 관리사용자는 AI 클라이언트를 사용하여 모니터링 시스템의 문제 알림 방식을 조정할 수 있습니다.
프로젝트의 README를 바탕으로 작성되었습니다. 모든 활용 사례는 해당 내용의 인용문과 대조하여 확인합니다.
자동 검사
2026년 11월 14일에 실행됨전체 보고서 →아직 인증되지 않았습니다. 서버는 80점 이상의 점수, 심각한 결함 없음, 그리고 검사에 충분한 데이터를 갖추어야 합니다. 검사 방식 · 점수를 높이기 위해 수정할 항목

- 소스 저장소 연결 및 접근 가능erikdarlingdata/performancemonitor is public and reachablegithub.com/erikdarlingdata/performancemonitor ↗통과
- 패키지가 이 저장소를 소스로 명시검사되지 않음
- 빌드 출처(Sigstore 증명)검사되지 않음
- 오픈 소스 라이선스 (OSI)MITspdx.org/licenses/MIT.html ↗통과
- 최근 1년 내 커밋 또는 릴리스Last commit or release 2026-11-13github.com/erikdarlingdata/performancemonitor ↗통과
- OpenSSF Scorecard검사되지 않음
- 패키지 이름이 인기 패키지와 유사하지 않음검사되지 않음
- 패키지 및 해당 종속성에 중요한 보안 권고 없음검사되지 않음
- 모델에 대한 숨겨진 지침 없음0 tool descriptions and the README read; no override phrases, credential paths or hidden characters통과
- 파괴적인 도구에 라벨 표시됨검사되지 않음
- 원격 엔드포인트가 MCP 핸드셰이크에 응답검사되지 않음
README
GitHub에서 보기SQL Server Performance Monitor
Free, open-source monitoring that replaces the tools charging you thousands per server per year. It includes specialized collectors, real-time alerts, and a built-in MCP server for AI analysis. Nothing phones home. Your data stays on your server and your machine.
If you pay for a monitoring tool now, read the comparison for yours.
Redgate SQL Monitor · SQL Sentry · SolarWinds DPA · Idera SQL Diagnostic Manager · Quest Spotlight · Datadog Database Monitoring · Database Health Monitor
It supports SQL Server 2016 SP2 to 2025. SQL Server 2017 needs CU3 or later. It also supports Azure SQL Managed Instance, AWS RDS for SQL Server, and Azure SQL Database (Lite and Darling). Darling also monitors PostgreSQL. It supports PostgreSQL 14 to 18, plus Amazon RDS, Aurora and Azure Database for PostgreSQL, and makes a best effort on PostgreSQL 10 to 13. See Supported PostgreSQL versions.
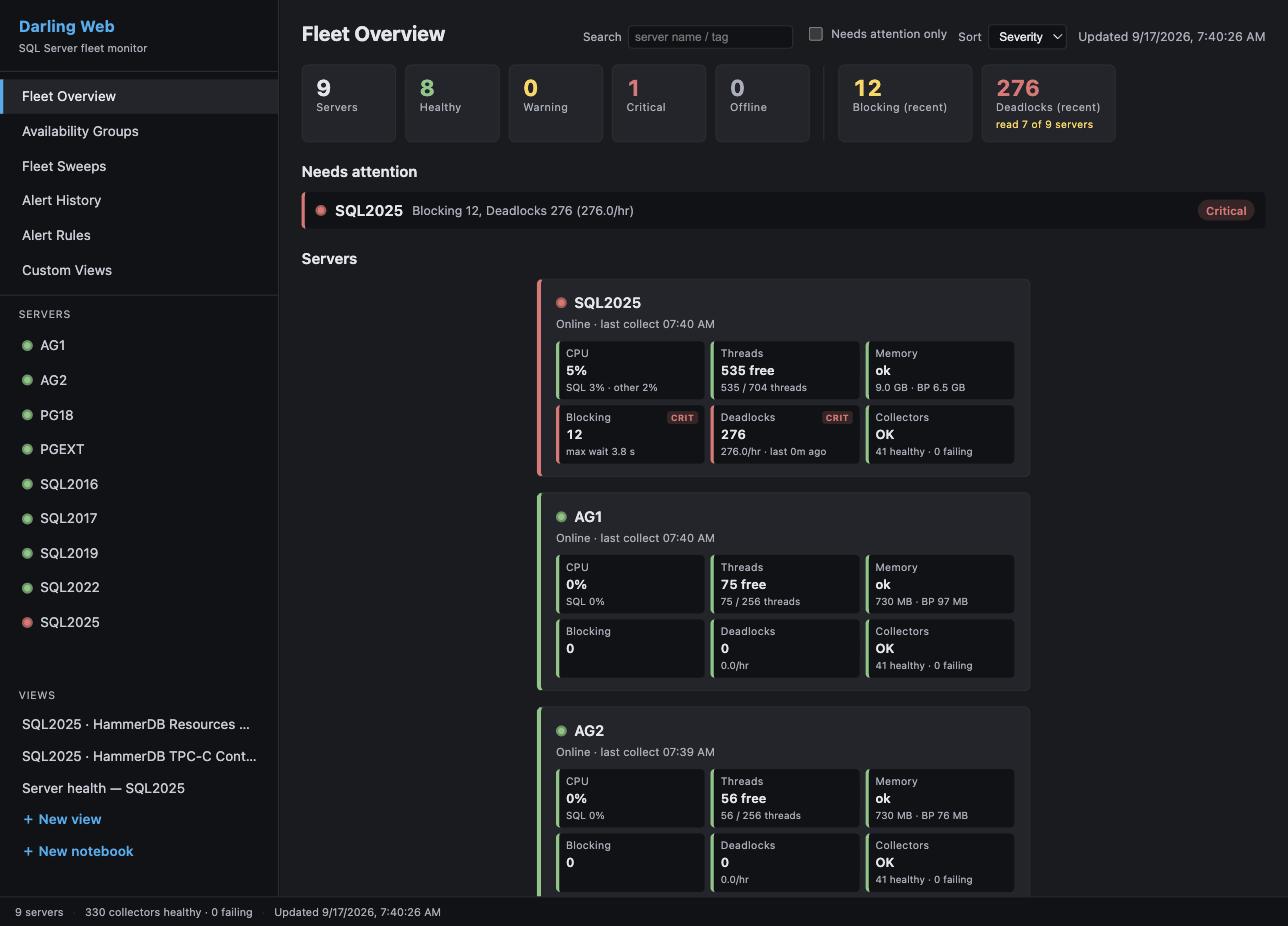
Editions
- Lite is a single desktop app that monitors your servers remotely, on demand. Nothing is installed on your server. It stores data in local DuckDB and Parquet files.
- Darling is a service on Windows or Linux that collects 24/7 into a central PostgreSQL store. The Windows viewer and the web dashboard read that store from any seat.
Both editions can hand an alert to an AI agent that you run, and Lite lets the agent read and report. Darling can also let it change alert settings (mutes, custom alert rules and thresholds). On a server, it can force or unforce a Query Store plan or evict a cached plan. It can recompile a module, create or drop a plan guide, or kill a session. Each of these has its own switch per server, and all are off until you turn them on. Darling records every change. A person can undo alert-setting changes, plan forces and plan guide changes. A plan eviction, a recompile or a session kill cannot be undone. Agent dispatch explains the levels.
The Dashboard edition is deprecated. Existing installs keep working, but we recommend Lite or Darling for new deployments. Choosing an edition compares all three.
Each release ships these downloads. For Lite, a Setup.exe and a portable ZIP. For Darling, the service ZIP (with the viewer inside), a Viewer Setup.exe for a remote seat, and the Linux and Compose tarballs. The Full Dashboard and its CLI installer ship nothing. Their last builds are in the v3.2.0 release.
Not sure which one? Start with Lite. It is one download, nothing is installed on your server, and data starts to flow in under 5 minutes.
Quick start: Lite
- Download
PerformanceMonitorLite-lite-Setup.exe. It is a self-contained build, so you do not install a .NET runtime first. - Run the installer. It adds Start Menu and Desktop shortcuts.
- Start Lite from the Start Menu or the Desktop shortcut.
- Click + Add Server, enter the connection details, test, and save.
- Double-click the server in the sidebar to connect.
Data starts to flow within 1 to 5 minutes. The monitoring login needs VIEW SERVER STATE (Permissions).
Before you upgrade an older install with Setup.exe, read the warning in the Lite guide. On versions older than 3.4.0, Setup.exe deletes the data in the install directory (see Upgrading an install older than 3.4.0). The Lite guide also covers the portable ZIP, collectors, storage, and configuration.
Quick start: Darling
- Download
PerformanceMonitorDarling-<version>.zipandSHA256SUMS.txtfrom the latest release. Check the zip hash againstSHA256SUMS.txt. The zip carries its own .NET runtime, so there is nothing to install first. - Extract the zip to
C:\Program Files\PerformanceMonitorDarling. Do not use your Desktop, Downloads, or any folder underC:\Users\. The service runs as a virtual account that cannot read a user profile (why). - Double-click
Install-Darling.cmdin the install folder. It asks Windows for administrator rights and runsinstall-darling.ps1. You can also run.\install-darling.ps1from an elevated PowerShell. It installs the Windows service and creates a Darling Viewer shortcut. With nodarling.jsonit writes a minimal one, and the service starts with no monitored servers. - Wait about two minutes for the first start, then open Darling Viewer. It opens on the fleet.
- Add your first server in the viewer.
darling.jsonis only a seed. The service reads it on its first start, so a server added to the file later is ignored (why). - The service log is in
%ProgramData%\PerformanceMonitorDarling\logs.
Install Darling gives each step with the log line or screen that proves it worked. To upgrade, run upgrade-darling.ps1. To remove the service, run uninstall-darling.ps1. Both are in the install folder. For Linux and the web dashboard, read the Darling quick start. The Darling operator guide is the configuration reference.
Documentation
| Page | What it covers |
|---|---|
| Choosing an edition | Lite, Darling, and Dashboard side by side |
| Features and screenshots | What you get, with screenshots |
| Lite guide | Install, upgrade, where Lite keeps its files, configuration, appearance, collectors |
| Lite Extended Events sessions | The sessions Lite creates on a monitored server, and how to remove them |
| Darling quick start | Install on Windows, Linux notes, web dashboard |
| Darling operator guide | Darling configuration, permissions, operations |
| Darling store sizing | Disk, RAM and vCPU for a store host, by number of servers |
| Back up, restore and move the store | Back up a Darling store, restore it, or move it to another machine |
| Darling guides | Install, viewer, web dashboard, MCP, day-to-day admin and command line reference |
| PostgreSQL target runbook | Point Darling at a PostgreSQL target, with a proof point at each step |
| Retention Held runbook | Clear a Retention Held alert |
| How collection works | A tour of the collection pipeline, for people who read the code |
| Documentation index | Every page in docs/, grouped by audience |
| Tabs | What each tab shows |
| Alerts and notifications | Alert types, channels, routes, email |
| Agent dispatch | Hand an alert to your own AI agent: levels, the brief and report, undo, the remediation login |
| Signed webhooks | Verify that a generic webhook post came from Darling |
| Agent job monitoring | Running SQL Agent jobs and jobs that run longer than expected |
| MCP server | Setup, the tool list and the Lite investigation tools for AI analysis |
| Authentication | Authentication types and credential profiles |
| Permissions | Grants for on-premises, Azure, and AWS RDS. The optional agent remediation login is in Agent dispatch |
| Platform notes | AWS RDS and Aurora configuration |
| Performance impact | Load on monitored servers, and local resources for Lite |
| Troubleshooting | Common problems for Lite and Darling |
| Building from source | Folder structure and build commands |
| Support and sponsorship | Commercial support tiers and sponsorship |
| Third-party components | Third-party components and their licenses |
| Changelog | Changes in each release |
Support
Performance Monitor is free and open source under the MIT License, with no features withheld. The tools that it replaces charge thousands of dollars per server per year. A support subscription covers all of your SQL Server instances.
| Tier | Cost per year | Email response | Includes |
|---|---|---|---|
| Supported | $500 | Within 2 business days | Guaranteed compatibility updates for new SQL Server versions, priority feature requests, a support agreement and invoices, unlimited instances |
| Priority | $2,500 | By the next business day | Everything in Supported, plus a quarterly live Q&A session, early access to new features, and direct input on the roadmap |
Support and sponsorship says what support gets you and has the link to buy. You can also sponsor on GitHub.
Sponsors
License
Copyright (c) 2026 Darling Data, LLC. Licensed under the MIT License. See LICENSE for details.
Author
Erik Darling: erikdarling.com and Darling Data, LLC
PerformanceMonitor MCP 질문
PerformanceMonitor는 어떤 데이터베이스를 모니터링할 수 있나요?
SQL Server 2016 SP2부터 2025까지, Azure SQL Managed Instance, AWS RDS for SQL Server, 그리고 RDS, Aurora, Azure Database for PostgreSQL를 포함한 PostgreSQL 14부터 18까지 지원합니다.
AI 에이전트가 알림 설정을 변경하려면 특별한 권한이 필요한가요?
서버별로 해당 기능을 활성화한 경우에만 권한을 가집니다. 모든 스위치는 기본적으로 꺼져 있으며 모든 변경 사항은 기록됩니다.
PerformanceMonitor는 어떤 에디션을 제공하나요?
두 가지 주요 에디션이 있습니다. 데이터를 로컬에 저장하는 단일 데스크톱 앱인 Lite와, 중앙 PostgreSQL 저장소에 24/7로 데이터를 수집하는 서비스인 Darling입니다.
PerformanceMonitor는 무료인가요?
네, MIT License에 따른 무료 오픈 소스이며 기능 제한은 없습니다. 유료 지원 구독은 선택 사항입니다.
PerformanceMonitor를 어떻게 시작하나요?
Lite로 시작하세요. 다운로드 한 번이면 서버에 별도의 설치 없이 몇 분 안에 데이터 수집을 시작할 수 있습니다.