
정적 분석을 통해 모든 코드베이스로부터 시각적인 아키텍처 다이어그램과 동시성 병목 현상 추정치를 생성합니다.
다른 이름 askuma/workflow-generator, workflow-generator, workflow-generator-mcp
- 스타
- 0
- Tools
- —
- 다운로드, 30일
- 365
- 최신 버전
- 0.5.0
- 마지막 커밋
- 2026년 10월 26일
- 라이선스
- MIT
Workflow Generator MCP란?
정적 분석을 통해 모든 코드베이스로부터 시각적인 아키텍처 다이어그램과 동시성 병목 현상 추정치를 생성합니다.
프로젝트 README에서 생성된 요약
Workflow Generator MCP server 정보
Workflow Generator는 개발자가 코드베이스로부터 시스템 아키텍처를 시각화하고 성능 병목 현상을 식별할 수 있도록 지원합니다. Python, Node.js, Go, Java, Rust 또는 Ruby로 작성된 프로젝트에 대해 정적 분석을 수행하여 종합적인 WORKFLOW.html 보고서를 생성합니다. 이 보고서에는 다크 모드 시각적 다이어그램, 의존성 그래프, 동시성 한계 및 실질적 처리량 추정치가 포함됩니다.
사용자는 이를 독립형 CLI 도구로 실행하거나 Claude Desktop, Cursor, VS Code 또는 Zed와 같은 MCP 호환 클라이언트에 연결할 수 있습니다. 이 서버는 전체 HTML 보고서를 생성하는 generate_workflow와 구조화된 JSON 요약을 가져오는 analyze_workflow라는 두 가지 주요 도구를 제공합니다. 정확성을 보장하기 위해 node_modules 또는 venv와 같은 포함된 디렉토리는 자동으로 무시합니다. 더 깊은 통찰력을 얻으려면 액세스 로그를 제공하여 의존성 그래프에 실제 요청 수를 오버레이할 수 있으며, 도구는 정적 분석 추정치를 실제 측정값과 비교 검증할 수 있는 k6 부하 테스트 스크립트까지 생성합니다.
활용 사례
- 1시각적 시스템 다이어그램 생성AI에게 프로젝트의 모든 구성 요소가 어떻게 상호작용하는지 시각적 표현을 생성하도록 요청합니다.
- 2동시성 제한 추정현재 아키텍처가 처리할 수 있는 최대 동시 요청 수를 결정합니다.
- 3성능 병목 현상 식별시스템 처리량을 제한하는 스택 내의 특정 레이어를 찾습니다.
- 4코드베이스 의존성 매핑소스 파일과 데이터베이스 또는 LLM 제공업체와 같은 외부 서비스 간의 관계를 시각화합니다.
프로젝트의 README를 바탕으로 작성되었습니다. 모든 활용 사례는 해당 내용의 인용문과 대조하여 확인합니다.
Workflow Generator MCP 설치 방법
형식 확인: 2026년 11월 10일Cursor에 추가Goose에 추가Claude Code에 Workflow Generator MCP 설치
$ claude mcp add workflow-generator -- uvx workflow-generator-mcpCursor에 Workflow Generator MCP 설치
~/.cursor/mcp.json
{
  "mcpServers": {
    "workflow-generator": {
      "command": "uvx",
      "args": [
        "workflow-generator-mcp"
      ]
    }
  }
}VS Code에 Workflow Generator MCP 설치
.vscode/mcp.json
{
  "servers": {
    "workflow-generator": {
      "type": "stdio",
      "command": "uvx",
      "args": [
        "workflow-generator-mcp"
      ]
    }
  }
}VS Code CLI에 Workflow Generator MCP 설치
$ code --add-mcp '{"name":"workflow-generator","type":"stdio","command":"uvx","args":["workflow-generator-mcp"]}'Claude Desktop에 Workflow Generator MCP 설치
claude_desktop_config.json
{
  "mcpServers": {
    "workflow-generator": {
      "command": "uvx",
      "args": [
        "workflow-generator-mcp"
      ]
    }
  }
}Codex에 Workflow Generator MCP 설치
$ codex mcp add workflow-generator -- uvx workflow-generator-mcpCodex config.toml에 Workflow Generator MCP 설치
~/.codex/config.toml
[mcp_servers.workflow-generator]
command = "uvx"
args = ["workflow-generator-mcp"]
Gemini CLI에 Workflow Generator MCP 설치
$ gemini mcp add -s user workflow-generator uvx -- workflow-generator-mcpGemini settings.json에 Workflow Generator MCP 설치
~/.gemini/settings.json
{
  "mcpServers": {
    "workflow-generator": {
      "command": "uvx",
      "args": [
        "workflow-generator-mcp"
      ]
    }
  }
}자동 검사
2026년 11월 14일에 실행됨전체 보고서 →자동 검사를 통과했습니다. 이는 보안 감사가 아닙니다. 코드를 직접 읽고 서버에 필요한 최소한의 권한만 부여하십시오. 검사 방식

- 소스 저장소 연결 및 접근 가능askuma/workflow-generator is public and reachablegithub.com/askuma/workflow-generator ↗통과
- 패키지가 이 저장소를 소스로 명시workflow-generator-mcp names askuma/workflow-generator as sourcepypi.org/project/workflow-generator-mcp/ ↗통과
- 빌드 출처(Sigstore 증명)Sigstore attestation for workflow-generator-mcppypi.org/project/workflow-generator-mcp/ ↗통과
- 오픈 소스 라이선스 (OSI)MITspdx.org/licenses/MIT.html ↗통과
- 최근 1년 내 커밋 또는 릴리스Last commit or release 2026-10-26github.com/askuma/workflow-generator ↗통과
- OpenSSF Scorecard검사되지 않음
- 패키지 이름이 인기 패키지와 유사하지 않음No popular package one edit away from workflow-generator-mcp통과
- 패키지 및 해당 종속성에 중요한 보안 권고 없음29 resolved dependencies checked; no critical advisoryosv.dev ↗통과
- 모델에 대한 숨겨진 지침 없음0 tool descriptions and the README read; no override phrases, credential paths or hidden characters통과
- 파괴적인 도구에 라벨 표시됨검사되지 않음
- 원격 엔드포인트가 MCP 핸드셰이크에 응답검사되지 않음
README
GitHub에서 보기workflow-generator
Scan any project and generate WORKFLOW.html — a dark-mode visual system diagram showing every component, how they talk to each other, and where your throughput ceiling actually is.
Works with Python, Node.js, Go, Java, Rust, Ruby, and mixed projects. No external dependencies for the core scanner.
Vendored and generated directories (node_modules, venv, site-packages, dist, …) are never scanned,
and capacity figures are clearly labeled as static-analysis estimates.
Live demo → — generated from fastapi/full-stack-fastapi-template, unmodified.
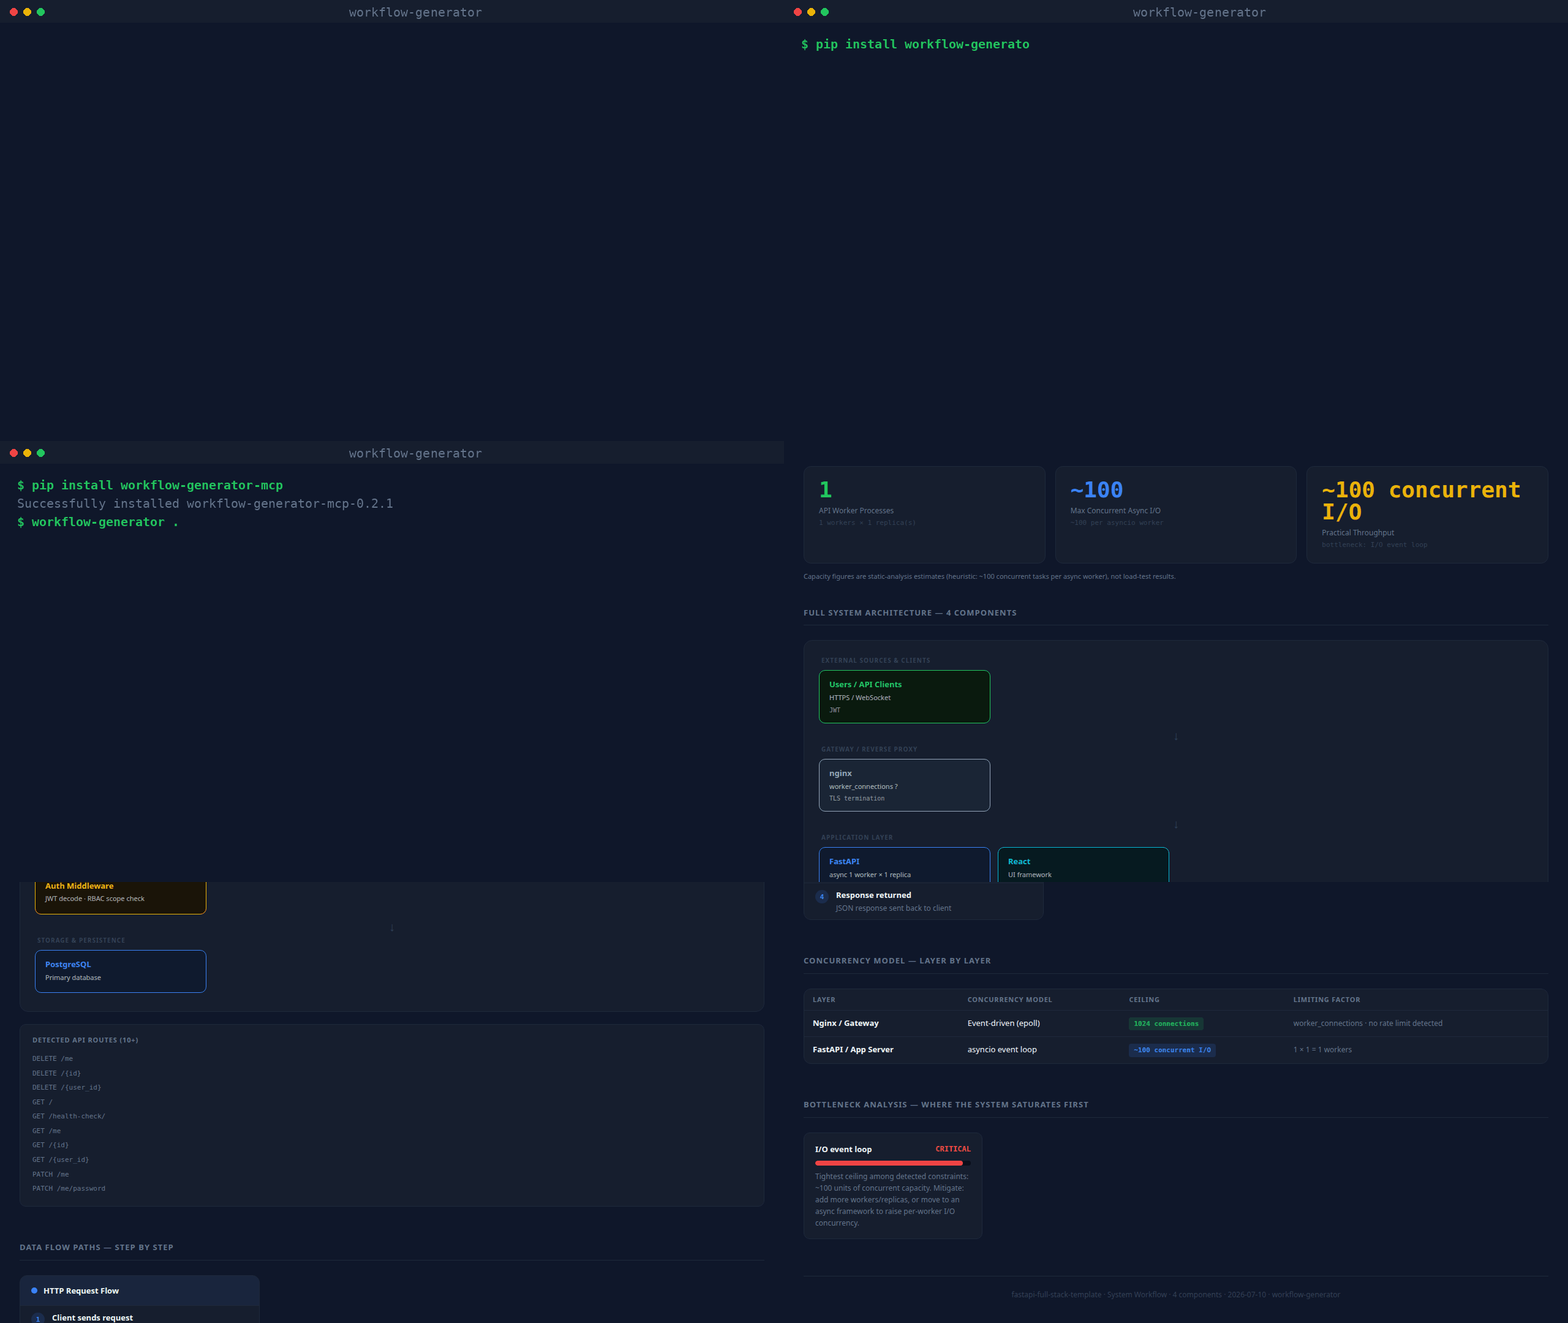
(real CLI output, unscripted — static screenshot if you'd rather not autoplay)
What it produces
Every generated page contains:
| Section | What you get |
|---|---|
| Stat row | Workers · Concurrent I/O ceiling · Semaphore limit · Rate limit · Practical throughput |
| Architecture diagram | Layered flow: external sources → gateway → API → queues → AI → storage |
| Data flow cards | Write path, read/query path, background jobs — inferred from what's detected |
| Concurrency table | Every layer: model · ceiling · limiting factor |
| Bottleneck analysis | Ranked CRITICAL → LOW with mitigation notes |
| Codebase dependency graph | Force-directed module/import graph — click a node to isolate its neighbors, hover for file details. Import-direction edges are clearly distinguished from real observed traffic (see below) |
| Guided tour | Spotlight walkthrough of every section, shown automatically the first time a report is opened; replay anytime with the ? button |
Codebase dependency graph
Every source file (Python, JS/TS, Go, Java, Rust, Ruby) becomes a node; every real import becomes
an edge — resolved with a language-appropriate parser (Python's ast module, regex for JS/TS/Go/
Java/Rust/Ruby), not guessed. Files that match an already-detected component (an LLM call, a
database client, a queue) get an edge to that component too, so you can see exactly which files
talk to Redis, OpenAI, etc. Large repos (350+ files) are automatically aggregated into
directory-level nodes so the graph stays readable; override with --graph-detail files or
--graph-detail dirs.
Test files (tests/, test_*.py, conftest.py, *.spec.ts, *_test.go, …) get their own
Test Graph section below the main one, showing which modules and services each test reaches.
Fixtures and test doubles name every service they exercise, so keeping them in the main graph
buries the real dependency structure under service edges.
Both sections have a Flow | Graph toggle over the same nodes and edges. Flow (the default up to 80 nodes) is a left-to-right layered diagram: columns are dependency depth from the sources (HTTP entry and files nothing imports), every detected service is its own node in the last column, and import cycles are drawn dashed. Graph is the force-directed view. Moving dots show data going both ways: a filled dot is the call/request, a hollow dot the return/response. On graphs with more than 60 edges, only the paths of the clicked or hovered node animate. Search, "hide isolated" and the selected node are shared between the two views.
The older layered Full System Architecture diagram is collapsed by default, since the Architecture Map covers the same ground.
By default the graph only shows what the code says (import direction, static "this file calls
Redis"), which is honest but not the same as real traffic. Pass --access-log /path/to/access.log
(any combined/common log format) to overlay real observed request counts onto the HTTP-entry
edges — and the generated report includes a ready-to-run k6 load-test script
covering up to 5 detected routes, so the "Practical throughput" number can be checked against a
real measurement instead of only a static-analysis estimate.
What it detects
| Category | Examples |
|---|---|
| API frameworks | FastAPI, Flask, Django, Express, Nest.js, Gin |
| Gateways | nginx, Caddy, Traefik (with rate limits + worker_connections) |
| LLM providers | OpenAI, Anthropic Claude, Cohere, AWS Bedrock |
| Vector stores | Qdrant, Pinecone, Weaviate, ChromaDB, pgvector, FAISS, Milvus |
| Databases | PostgreSQL, MySQL, MongoDB, SQLite, Redis |
| Queues | Celery, BullMQ, Kafka, RabbitMQ, RQ, AWS SQS |
| Async primitives | asyncio.Semaphore, run_in_executor, asyncio.gather, asyncio.Lock |
| Workers | --workers N (uvicorn/gunicorn), replicas: (docker-compose), PM2 instances |
| External sources | Jira, Azure DevOps, Slack, GitHub, Stripe, Salesforce, Twilio |
| Evaluation | TruLens, RAGAS, LangSmith |
Install
pip (CLI + MCP server)
pip install workflow-generator-mcp

workflow-generator . WORKFLOW.html       # CLI: scan and write the report
workflow-generator-mcp                    # stdio MCP server
With pip installed, any MCP host config reduces to:
{
  "mcpServers": {
    "workflow-generator": { "command": "workflow-generator-mcp" }
  }
}
Claude Code (skill)
mkdir -p ~/.claude/skills
git clone https://github.com/askuma/workflow-generator.git ~/.claude/skills/workflow-generator
Then in any Claude Code session:
/workflow-generator
/workflow-generator /path/to/project
MCP server (Claude Desktop, VS Code, Cursor, Zed, Windsurf, Continue)
1. Install the dependency:
pip install mcp
2. Add to your MCP host config (replace ~ with your actual home path):
~/Library/Application Support/Claude/claude_desktop_config.json (Mac)
%APPDATA%\Claude\claude_desktop_config.json (Windows)
{
  "mcpServers": {
    "workflow-generator": {
      "command": "python3",
      "args": ["~/.claude/skills/workflow-generator/mcp/server.py"]
    }
  }
}
.vscode/mcp.json
{
  "servers": {
    "workflow-generator": {
      "type": "stdio",
      "command": "python3",
      "args": ["~/.claude/skills/workflow-generator/mcp/server.py"]
    }
  }
}
~/.cursor/mcp.json
{
  "mcpServers": {
    "workflow-generator": {
      "command": "python3",
      "args": ["~/.claude/skills/workflow-generator/mcp/server.py"]
    }
  }
}
.zed/settings.json
{
  "context_servers": {
    "workflow-generator": {
      "command": {
        "path": "python3",
        "args": ["~/.claude/skills/workflow-generator/mcp/server.py"]
      }
    }
  }
}
~/.windsurf/mcp_config.json
{
  "mcpServers": {
    "workflow-generator": {
      "command": "python3",
      "args": ["~/.claude/skills/workflow-generator/mcp/server.py"]
    }
  }
}
3. Restart your tool, then ask:
generate a workflow diagram for this project
how many concurrent requests can this handle?
show me the system architecture
MCP tools exposed:
generate_workflow— scans project, writesWORKFLOW.html, optionally opens in browseranalyze_workflow— returns structured JSON summary (no file written)
Command line (standalone)
No install needed beyond Python 3.8+:
python3 ~/.claude/skills/workflow-generator/scripts/analyze.py . ~/WORKFLOW.html
# then open ~/WORKFLOW.html
Optional flags:
--access-log /path/to/access.log   # overlay real request counts onto the dependency graph
--graph-detail auto|files|dirs     # force file-level or directory-level graph nodes (default: auto)
Example output (terminal)
Written: /your/project/WORKFLOW.html
Framework: FastAPI · Workers: 8 · Concurrent I/O: ~800
Practical throughput: ~50–200 req/min
Bottleneck: OpenAI (LLM latency 3–30s per call)
Gateway: nginx · 2 rate limit zone(s)
LLM: OpenAI · eval: TruLens RAG Triad
Storage: Qdrant, Redis
External sources: Jira, Azure DevOps, Slack
Repo layout
workflow-generator/
├── SKILL.md                        ← Claude Code skill definition
├── INSTALL.md                      ← detailed per-platform install guide
├── workflow_generator_mcp/
│   ├── analyze.py                  ← core scanner + HTML renderer (stdlib only)
│   └── server.py                   ← MCP stdio server (package form)
├── scripts/
│   └── analyze.py                  ← thin compatibility shim -> workflow_generator_mcp/analyze.py
├── tests/                          ← pytest suite for the scanner
├── mcp/
│   ├── server.py                   ← MCP stdio server
│   └── requirements.txt            ← pip install mcp
└── copilot/
    ├── index.js                    ← GitHub Copilot Extension (Express)
    ├── package.json
    └── openai_function.json
License
MIT
Workflow Generator MCP 질문
Workflow Generator MCP를 Claude Code에 추가하려면 어떻게 하나요?
터미널에서 claude mcp add workflow-generator -- uvx workflow-generator-mcp를 실행합니다. 모든 프로젝트에서 사용할 수 있게 하려면 --scope user를 추가합니다.
Workflow Generator MCP를 Cursor에 추가하려면 어떻게 하나요?
~/.cursor/mcp.json를 열고 mcpServers 아래에 서버를 추가합니다. 위 설치 섹션에 표시된 Cursor 구성을 사용합니다.
지원되는 프로그래밍 언어는 무엇인가요?
스캐너는 Python, Node.js, Go, Java, Rust, Ruby 및 혼합 프로젝트를 지원합니다.
node_modules나 가상 환경을 스캔하나요?
아니요, node_modules, venv, site-packages와 같이 포함된(vendored) 디렉토리나 생성된 디렉토리는 스캔에서 제외됩니다.
용량 수치는 얼마나 정확한가요?
용량 수치는 정적 분석을 기반으로 한 추정치로 제공됩니다.
그래프에 실제 트래픽 데이터를 오버레이할 수 있나요?
네, 액세스 로그 경로를 전달하면 HTTP 엔트리 엣지에 실제 관찰된 요청 수를 오버레이할 수 있습니다.