
debugium MCP server
✓ 인증됨실시간 웹 UI와 64개의 MCP 도구를 통해 LLM 통합 디버깅 세션을 지원하는 AI 기반 다국어 디버거입니다.
다른 이름 Algiras/debugium, @algiras/debugium
- 스타
- 4
- Tools
- —
- 다운로드, 30일
- 278
- 최신 버전
- 1.0.0
- 마지막 커밋
- 2026년 3월 16일
- 라이선스
- —
debugium MCP란?
debugium은(는) MCP server입니다. 실시간 웹 UI와 64개의 MCP 도구를 통해 LLM 통합 디버깅 세션을 지원하는 AI 기반 다국어 디버거입니다.
프로젝트 README에서 생성된 요약
debugium MCP server 정보
Debugium은 AI 기반 워크플로우에 심층적인 코드 검사를 통합하려는 개발자를 위해 설계된 다국어 디버깅 환경을 제공합니다. 다양한 Debug Adapter Protocol 어댑터의 프록시 역할을 수행하여 Python, JavaScript, TypeScript, C, C++, Rust, Java, Scala, WebAssembly 등 폭넓은 언어를 지원합니다. 사용자는 소스 뷰어, 변수 확장, 콜 스택을 갖춘 실시간 웹 UI를 통해 디버깅 세션과 상호작용하거나, 13개의 서브 명령어를 가진 CLI를 사용할 수 있습니다.
이 서버는 Model Context Protocol을 통해 LLM 통합이 가능하도록 구축되었으며, Claude와 같은 클라이언트에 64개의 특화된 도구를 노출합니다. 이러한 도구를 통해 AI는 변수 값이 바뀔 때까지 단계별 실행을 수행하거나, 예외 상황을 설명하거나, 프로그램 상태의 스냅샷을 비교하는 등의 복잡한 작업을 수행할 수 있습니다. 개발자는 세션을 로컬에서 실행하거나 컨테이너 또는 다른 머신에서 실행 중인 원격 프로세스에 연결할 수 있습니다. 또한 시스템은 멀티 세션 관리와 세션 내보내기/가져오기를 지원하여 서로 다른 작업 세션 간에 디버깅 지식을 보존할 수 있습니다.
활용 사례
- 1상태 변화 모니터링개발자가 AI에게 특정 변수 값이 수정될 때까지 코드를 실행하도록 지시할 수 있습니다.
- 2원격 프로세스 검사다른 머신이나 컨테이너에서 이미 실행 중인 프로세스에 디버거를 연결할 수 있습니다.
- 3문맥 기반 디버깅 스냅샷LLM이 소스 코드와 지역 변수를 포함한 프로그램의 현재 전체 상태를 단일 요청으로 가져올 수 있습니다.
프로젝트의 README를 바탕으로 작성되었습니다. 모든 활용 사례는 해당 내용의 인용문과 대조하여 확인합니다.
debugium MCP 설치 방법
형식 확인: 2026년 11월 10일Cursor에 추가Goose에 추가Claude Code에 debugium MCP 설치
$ claude mcp add debugium -- npx -y @algiras/debugiumCursor에 debugium MCP 설치
~/.cursor/mcp.json
{
  "mcpServers": {
    "debugium": {
      "command": "npx",
      "args": [
        "-y",
        "@algiras/debugium"
      ]
    }
  }
}VS Code에 debugium MCP 설치
.vscode/mcp.json
{
  "servers": {
    "debugium": {
      "type": "stdio",
      "command": "npx",
      "args": [
        "-y",
        "@algiras/debugium"
      ]
    }
  }
}VS Code CLI에 debugium MCP 설치
$ code --add-mcp '{"name":"debugium","type":"stdio","command":"npx","args":["-y","@algiras/debugium"]}'Claude Desktop에 debugium MCP 설치
claude_desktop_config.json
{
  "mcpServers": {
    "debugium": {
      "command": "npx",
      "args": [
        "-y",
        "@algiras/debugium"
      ]
    }
  }
}Codex에 debugium MCP 설치
$ codex mcp add debugium -- npx -y @algiras/debugiumCodex config.toml에 debugium MCP 설치
~/.codex/config.toml
[mcp_servers.debugium]
command = "npx"
args = ["-y", "@algiras/debugium"]
Gemini CLI에 debugium MCP 설치
$ gemini mcp add -s user debugium npx -- -y @algiras/debugiumGemini settings.json에 debugium MCP 설치
~/.gemini/settings.json
{
  "mcpServers": {
    "debugium": {
      "command": "npx",
      "args": [
        "-y",
        "@algiras/debugium"
      ]
    }
  }
}자동 검사
2026년 11월 15일에 실행됨전체 보고서 →자동 검사를 통과했습니다. 이는 보안 감사가 아닙니다. 코드를 직접 읽고 서버에 필요한 최소한의 권한만 부여하십시오. 검사 방식 · 점수를 높이기 위해 수정할 항목

- 소스 저장소 연결 및 접근 가능algiras/debugium is public and reachablegithub.com/algiras/debugium ↗통과
- 패키지가 이 저장소를 소스로 명시@algiras/debugium names algiras/debugium as sourcenpmjs.com/package/@algiras/debugium ↗통과
- 빌드 출처(Sigstore 증명)No build attestation published for this release검사되지 않음
- 오픈 소스 라이선스 (OSI)No license결함 발견
- 최근 1년 내 커밋 또는 릴리스Last commit or release 2026-03-16github.com/algiras/debugium ↗통과
- OpenSSF Scorecard검사되지 않음
- 패키지 이름이 인기 패키지와 유사하지 않음No popular package one edit away from @algiras/debugium통과
- 패키지 및 해당 종속성에 중요한 보안 권고 없음1 resolved dependencies checked; no critical advisoryosv.dev ↗통과
- 모델에 대한 숨겨진 지침 없음0 tool descriptions and the README read; no override phrases, credential paths or hidden characters통과
- 파괴적인 도구에 라벨 표시됨검사되지 않음
- 원격 엔드포인트가 MCP 핸드셰이크에 응답검사되지 않음
README
GitHub에서 보기Debugium
A multi-language debugger with a real-time web UI and LLM integration via MCP.
Debug Python, JavaScript, TypeScript, C, C++, Rust, Java, Scala, and WebAssembly programs from your browser — with AI-driven analysis through the Model Context Protocol.


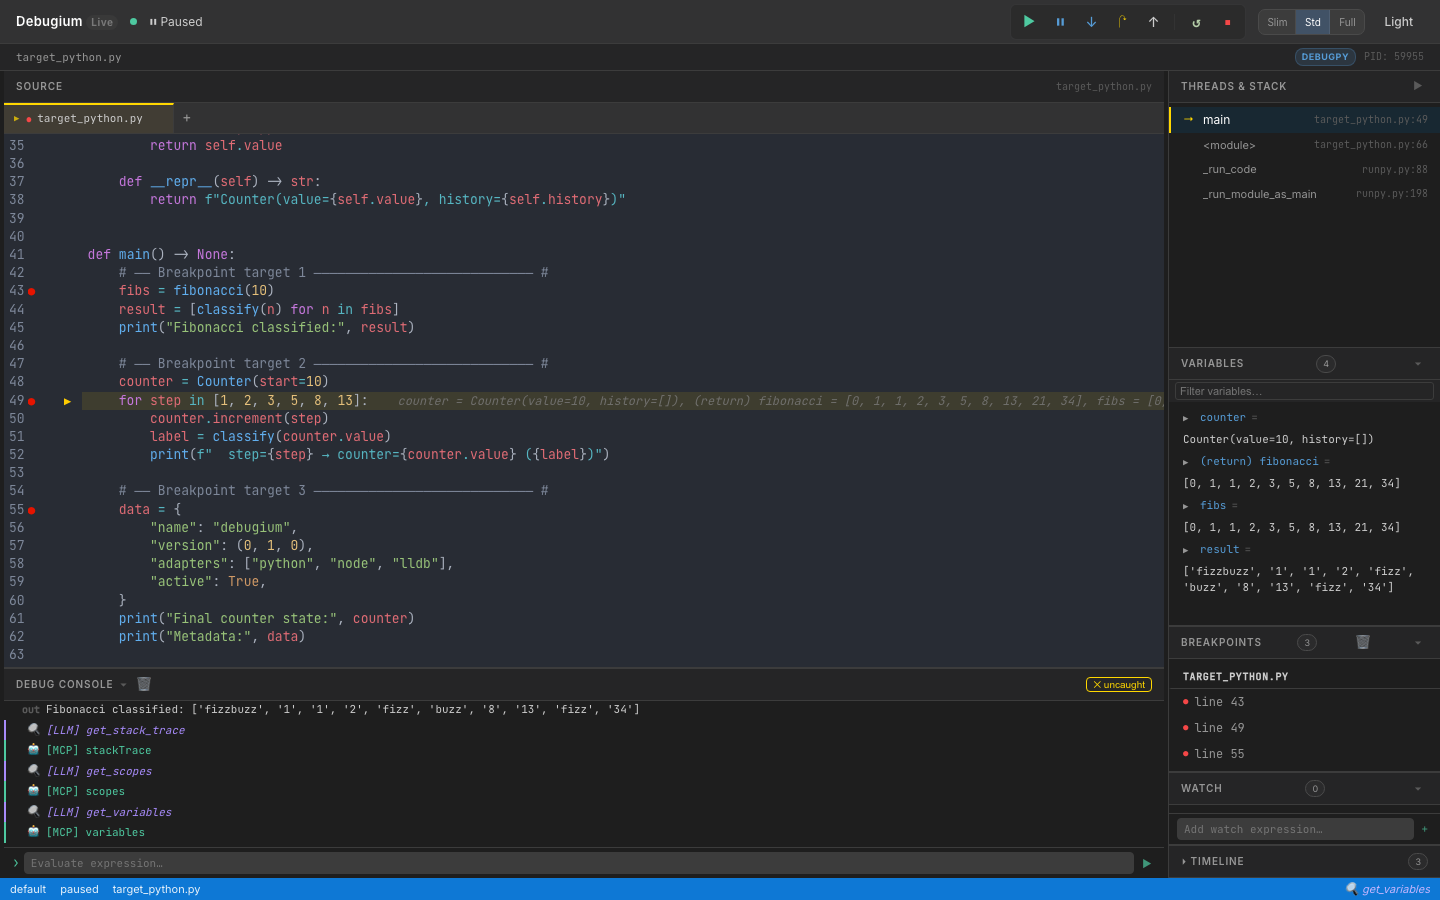
Features
Web UI
- Real-time web UI — source viewer, breakpoints, variables (recursive expansion), call stack, console, timeline, watch expressions, findings — all updated live via WebSocket
- Multi-tab source viewer — open multiple files, click stack frames to navigate
- Variable search — filter variables by name with recursive expansion
- Changed-variable highlighting — variables that changed since last stop shown in orange
- Thread selector — switch between threads in multi-threaded programs
- Panel collapse & resize — drag to resize, toggle to collapse; Slim / Standard / Full layout presets
- Dark / light mode toggle
- Auto-reconnect — UI reconnects after a dropped WebSocket, with visual status indicator
- Keyboard shortcuts — F5 continue, F10 step over, F11 step in, Shift+F11 step out, Ctrl/Cmd+D dark mode
- Button animations — in-flight spinner and completion flash for debug commands
Debugging
- Multi-language — Python (debugpy), Node.js/TypeScript (js-debug), C/C++/Rust (lldb-dap), Java (java-debug), Scala (Metals), WebAssembly (lldb-dap), or any DAP adapter via
dap.json - Comprehensive DAP coverage — 35+ DAP requests: breakpoints, stepping, goto, memory read/write, disassembly, and more
- Breakpoints — conditional, logpoints, hit-count, function, data (watchpoints), exception, run-to-cursor (
continue_until) - Multi-session — debug multiple programs simultaneously, with child session routing (js-debug)
- Remote debugging — attach to debugpy, JDWP, or Node inspector running on another machine or container
LLM / MCP Integration
- 64 MCP tools — the full debug session exposed to Claude or any LLM
- Capability-gated tools — tools automatically shown/hidden based on adapter capabilities
- Compound tools —
get_debug_context(orient in one call),step_until,step_until_change,run_until_exception,explain_exception,get_call_tree,compare_snapshots,find_first_change - Execution timeline — every stop recorded with changed variables and stack summary
- Watch expressions — evaluated automatically at every breakpoint, manageable by LLM or UI
- Annotations & findings — pin notes to source lines, record conclusions visible in the UI
- Session export/import — save and restore debugging knowledge across sessions
CLI Control
- Full CLI — 13 subcommands to drive sessions from a second terminal without the web UI
- Auto-discovery — port file at
~/.debugium/port, session logs in~/.debugium/sessions/
Install
Claude Code Plugin (recommended)
/plugin marketplace add Algiras/debugium
/plugin install debugium@debugium
Then add to your project's .mcp.json (see MCP Tools below).
macOS / Linux binary
curl -fsSL https://raw.githubusercontent.com/Algiras/debugium/main/install.sh | bash
From source
# Prerequisites: Rust stable + wasm-pack
cargo install wasm-pack

# Build UI
wasm-pack build crates/debugium-ui --target web --out-dir pkg
cp crates/debugium-ui/pkg/cm_init.js         crates/debugium-ui/dist/pkg/
cp crates/debugium-ui/pkg/debugium_ui.js      crates/debugium-ui/dist/pkg/
cp crates/debugium-ui/pkg/debugium_ui_bg.wasm crates/debugium-ui/dist/pkg/

# Build & install server
cargo install --path crates/debugium-server
Usage
Debug a Python file
debugium launch my_script.py --adapter python
Debug a Node.js / TypeScript file
debugium launch app.js --adapter node
debugium launch app.ts --adapter typescript
Debug C / C++ / Rust
# C or C++ (compile with -g for debug info)
cc -g -O0 main.c -o main && debugium launch ./main --adapter lldb
c++ -g -O0 main.cpp -o main && debugium launch ./main --adapter lldb

# Rust
cargo build && debugium launch target/debug/my_binary --adapter lldb
Debug Java / Scala
# Java (requires microsoft/java-debug adapter)
debugium launch MainClass --adapter java

# Scala (connect to a running Metals DAP server)
debugium launch build-target --adapter metals
debugium launch build-target --adapter metals:5005  # custom port
Attach to a running process (remote debugging)
# Python (debugpy listening on port 5678)
debugium attach --port 5678 --adapter python

# Java (JDWP on port 5005)
debugium attach --port 5005 --adapter java

# Node.js (inspector on port 9229)
debugium attach --port 9229 --adapter node
Or via MCP: attach_session(port=5678, adapter="python", breakpoints=["/path/app.py:42"])
Use a custom adapter via dap.json
# Create a dap.json (see dap.json.example) then:
debugium launch my_program --config ./dap.json

# Or place dap.json in cwd / .debugium/ for auto-discovery:
debugium launch my_program   # finds ./dap.json automatically
Set initial breakpoints
debugium launch my_script.py --adapter python \
  --breakpoint /abs/path/my_script.py:42 \
  --breakpoint /abs/path/helpers.py:15
Enable LLM / MCP integration
Add a .mcp.json to your project root (Claude Code picks this up automatically):
{
  "mcpServers": {
    "debugium": {
      "command": "debugium",
      "args": ["mcp"]
    }
  }
}
Then launch the session normally — the MCP server connects to whichever port is active:
debugium launch my_script.py --adapter python --breakpoint /abs/path/my_script.py:42
Claude Code will now have access to all Debugium MCP tools. See CLAUDE.md for the recommended workflow and SKILL.md for the full tool reference.
CLI Control Commands
Once a session is running (debugium launch …), you can drive it from a second terminal — or from an LLM agent — without touching the web UI.
Port is auto-discovered from ~/.debugium/port; override with --port.
Global flags (all subcommands)
| Flag | Default | Description |
|---|---|---|
--port PORT |
~/.debugium/port |
Server port to connect to |
--session ID |
default |
Session to target |
--json |
off | Print raw JSON instead of human-readable output |
Inspection
debugium sessions                  # list active sessions
debugium threads                   # list threads
debugium stack                     # show call stack
debugium vars                      # show local variables (auto-resolves top frame)
debugium vars --frame-id 2         # show variables for a specific frame
debugium eval "len(fibs)"          # evaluate expression in top frame
debugium eval "x + 1" --frame-id 2
debugium source path/to/file.py    # print full source file
debugium source path/to/file.py --line 43  # windowed ±10 lines with → marker
debugium context                   # full snapshot: paused-at, stack, locals, source, breakpoints
debugium context --compact         # same but truncated (3 frames, 10 vars)
Breakpoints
debugium bp set FILE:LINE [FILE:LINE …]   # set breakpoints (replaces existing in that file)
debugium bp list                          # list all breakpoints
debugium bp clear                         # clear all breakpoints
Execution control
debugium continue                  # resume execution
debugium step over                 # step over (next line)
debugium step in                   # step into a function call
debugium step out                  # step out of current function
UI annotations (visible in the web UI)
debugium annotate FILE:LINE "message" [--color info|warning|error]
debugium finding "message"         [--level  info|warning|error]
Example workflow
# Terminal A — start the session
debugium launch tests/target_python.py --adapter python \
  --breakpoint "$(pwd)/tests/target_python.py:43"

# Terminal B (or LLM agent) — inspect and drive it
debugium sessions
debugium stack
debugium vars
debugium eval "len(fibs)"
debugium bp set tests/target_python.py:49
debugium continue                  # runs to line 49
debugium vars
debugium step over
debugium context --json            # machine-readable snapshot
debugium annotate tests/target_python.py:43 "called here" --color info
debugium finding "fibs has 10 elements" --level info
debugium bp clear
MCP Tools
When connected via MCP, 64 tools are available. Key ones:
| Category | Tools |
|---|---|
| Orient | get_debug_context ★ (paused location + locals + stack + source in one call) |
| Breakpoints | set_breakpoint, set_breakpoints, set_logpoint, list_breakpoints, clear_breakpoints, set_function_breakpoints, set_exception_breakpoints, set_data_breakpoint, list_data_breakpoints, clear_data_breakpoints, breakpoint_locations |
| Execution | continue_execution, step_over, step_in, step_out, pause, goto, disconnect, terminate, restart |
| Inspection | get_stack_trace, get_scopes, get_variables, evaluate, get_threads, get_source, get_capabilities, loaded_sources, source_by_reference, step_in_targets |
| Mutation | set_variable, set_expression |
| Output | get_console_output, wait_for_output (with from_line to avoid stale matches) |
| Memory | read_memory, write_memory, disassemble (native debugging) |
| History | get_timeline, get_variable_history, compare_snapshots, find_first_change |
| Annotations | annotate, get_annotations, add_finding, get_findings |
| Watches | add_watch, remove_watch, get_watches |
| Compound | step_until, step_until_change, continue_until, run_until_exception, explain_exception, get_call_tree, restart_frame |
| Session | get_sessions, list_sessions, launch_session, attach_session, stop_session, export_session, import_session |
| Control | goto_targets, cancel_request |
Note:
step_over,step_in, andstep_outare blocking — they wait for the adapter to pause before returning. Safe to chain back-to-back without sleeps.continue_executionreturnsconsole_line_countfor use withwait_for_output. Tools likeread_memory,goto, andrestart_frameonly appear when the adapter supports them.
See SKILL.md for the full reference with input schemas.
Keyboard Shortcuts
| Key | Action |
|---|---|
F5 |
Continue |
F10 |
Step Over |
F11 |
Step Into |
Shift+F11 |
Step Out |
Ctrl/⌘+D |
Toggle dark/light mode |
Architecture
debugium-server (Rust + Axum)
├── DAP proxy     — spawns / attaches to debug adapters (debugpy, js-debug, lldb-dap, java-debug, Metals, custom)
├── HTTP API      — /state, /sessions, /annotations, /findings, /watches, /timeline
├── WebSocket     — broadcasts DAP events + enriched stop data (changed vars, timeline) to UI
├── MCP stdio     — JSON-RPC 2.0 server exposing 64 tools for LLM integration
├── CLI control   — 13 subcommands to drive sessions from a second terminal
└── ~/.debugium/  — port file, session logs (events.ndjson), debug log

debugium-ui (Leptos + WASM)
├── CodeMirror 6  — source viewer with breakpoint gutters, exec arrow, LLM annotations, multi-tab
├── Reactive panels — Variables, Stack, Breakpoints, Findings, Watch, Timeline, Console (18 components)
└── WebSocket     — receives events, sends DAP commands, auto-reconnects with status indicator
Supported Languages & Adapters
| Language | --adapter flag |
Prerequisite | Verified |
|---|---|---|---|
| Python | python / debugpy |
pip install debugpy |
✅ |
| Node.js | node / js |
js-debug (bundled or build from vscode-js-debug) | ✅ |
| TypeScript | typescript / ts / tsx |
js-debug + tsx or ts-node in PATH |
✅ |
| C / C++ | lldb / codelldb |
lldb-dap (Xcode on macOS; apt install lldb on Linux) |
✅ |
| Rust | lldb / rust |
lldb-dap + cargo build |
✅ |
| Java | java / jvm |
microsoft/java-debug adapter JAR | ✅ |
| Scala | metals / scala |
Running Metals DAP server | ⚠️ (requires running Metals) |
| WebAssembly | wasm |
lldb-dap (LLVM ≥16) |
⚠️ (requires WASM-aware LLVM) |
| Any DAP adapter | --config dap.json |
See dap.json.example |
✅ |
Remote debugging
Connect to a DAP server running on another machine (or in a container):
{
  "adapterId": "debugpy",
  "request": "attach",
  "host": "192.168.1.100",
  "port": 5678,
  "pathMappings": [{ "localRoot": ".", "remoteRoot": "/app" }]
}
debugium launch app.py --config remote.json
License
MIT
debugium MCP 질문
debugium MCP를 Claude Code에 추가하려면 어떻게 하나요?
터미널에서 claude mcp add debugium -- npx -y @algiras/debugium를 실행합니다. 모든 프로젝트에서 사용할 수 있게 하려면 --scope user를 추가합니다.
debugium MCP를 Cursor에 추가하려면 어떻게 하나요?
~/.cursor/mcp.json를 열고 mcpServers 아래에 서버를 추가합니다. 위 설치 섹션에 표시된 Cursor 구성을 사용합니다.
Debugium이 지원하는 프로그래밍 언어는 무엇인가요?
Python, JavaScript, TypeScript, C, C++, Rust, Java, Scala, WebAssembly를 지원합니다.
사용 가능한 MCP 도구는 몇 개인가요?
중단점, 실행 제어, 검사, 변이(mutation) 도구를 포함하여 총 64개의 MCP 도구를 사용할 수 있습니다.
다른 머신에서 실행 중인 프로세스를 디버깅할 수 있나요?
네, 원격 디버깅을 통해 다른 머신이나 컨테이너에서 실행 중인 debugpy, JDWP 또는 Node inspector에 연결할 수 있습니다.
LLM 통합을 활성화하려면 어떻게 해야 하나요?
프로젝트 루트에 mcp 인자와 함께 debugium 명령어를 지정한 .mcp.json 파일을 추가하면 활성화할 수 있습니다.