
Serveur MCP PerformanceMonitor
Commit 15 nov. 2026Permet à un client IA d'interroger les données de performance, les alertes et les plans d'exécution collectés pour SQL Server et PostgreSQL afin de les analyser.
Aussi connu sous erikdarlingdata/PerformanceMonitor
- Étoiles
- 536
- Outils
- —
- Téléchargements, 30 jours
- —
- Dernière version
- —
- Dernier commit
- 15 nov. 2026
- Licence
- MIT
Qu'est-ce que PerformanceMonitor MCP ?
PerformanceMonitor est un serveur MCP. Permet à un client IA d'interroger les données de performance, les alertes et les plans d'exécution collectés pour SQL Server et PostgreSQL afin de les analyser.
Résumé généré à partir du README du projet
À propos du MCP server PerformanceMonitor
PerformanceMonitor permet aux administrateurs de bases de données et aux développeurs d'analyser les données de performance SQL Server et PostgreSQL directement depuis un client IA. En connectant un agent IA au MCP server intégré, les utilisateurs peuvent interroger les métriques de performance collectées, les alertes en temps réel et les plans d'exécution pour diagnostiquer les problèmes de base de données. Le système propose deux modes de fonctionnement distincts : Lite, qui est une application de bureau unique pour une surveillance à la demande à distance utilisant des fichiers locaux DuckDB et Parquet, et Darling, un service de collecte continue 24/7 dans un magasin PostgreSQL centralisé.
Selon l'édition utilisée, l'agent IA peut faire plus que la simple lecture de rapports. Alors que Lite se concentre sur l'investigation, l'édition Darling permet à un agent d'agir en modifiant les paramètres d'alerte, en forçant ou en annulant les plans Query Store, en recompilant des modules ou même en tuant des sessions. Toutes les actions sont soumises à des commutateurs activés par l'utilisateur pour garantir le contrôle. Cette configuration fonctionne dans divers environnements, notamment les serveurs on-premises, Azure SQL Managed Instance, AWS RDS et diverses versions de PostgreSQL.
Ce que vous pouvez faire avec
- 1Remédier automatiquement aux problèmes de base de donnéesUn développeur peut confier à une IA la gestion des plans d'exécution ou la terminaison de sessions problématiques.
- 2Gérer les configurations d'alerte de la base de donnéesLes utilisateurs peuvent utiliser un client IA pour ajuster la manière dont le système de surveillance les informe des problèmes.
Extrait du README du projet. Chaque cas d'utilisation est vérifié par rapport à une citation du document.
Vérifications automatisées
Exécuté le 14 nov. 2026Rapport complet →Pas encore vérifié. Un serveur nécessite un score de 80, aucune faille sérieuse et suffisamment de données pour que nous puissions effectuer les vérifications. Fonctionnement des vérifications · Ce qu'il faut corriger pour gagner des points

- Dépôt source lié et accessibleerikdarlingdata/performancemonitor is public and reachablegithub.com/erikdarlingdata/performancemonitor ↗Réussi
- Le nom du package correspond au dépôt sourceNon vérifié
- Provenance du build (attestation Sigstore)Non vérifié
- Licence open source (OSI)MITspdx.org/licenses/MIT.html ↗Réussi
- Commit ou version publiée au cours de l'année écouléeLast commit or release 2026-11-13github.com/erikdarlingdata/performancemonitor ↗Réussi
- OpenSSF ScorecardNon vérifié
- Nom du package non proche d'un package populaireNon vérifié
- Aucun avis critique dans le package ou ses dépendancesNon vérifié
- Aucune instruction cachée destinée au modèle0 tool descriptions and the README read; no override phrases, credential paths or hidden charactersRéussi
- Les outils destructifs sont étiquetésNon vérifié
- Le point de terminaison distant répond à la poignée de main MCPNon vérifié
README
Voir sur GitHubSQL Server Performance Monitor
Free, open-source monitoring that replaces the tools charging you thousands per server per year. It includes specialized collectors, real-time alerts, and a built-in MCP server for AI analysis. Nothing phones home. Your data stays on your server and your machine.
If you pay for a monitoring tool now, read the comparison for yours.
Redgate SQL Monitor · SQL Sentry · SolarWinds DPA · Idera SQL Diagnostic Manager · Quest Spotlight · Datadog Database Monitoring · Database Health Monitor
It supports SQL Server 2016 SP2 to 2025. SQL Server 2017 needs CU3 or later. It also supports Azure SQL Managed Instance, AWS RDS for SQL Server, and Azure SQL Database (Lite and Darling). Darling also monitors PostgreSQL. It supports PostgreSQL 14 to 18, plus Amazon RDS, Aurora and Azure Database for PostgreSQL, and makes a best effort on PostgreSQL 10 to 13. See Supported PostgreSQL versions.
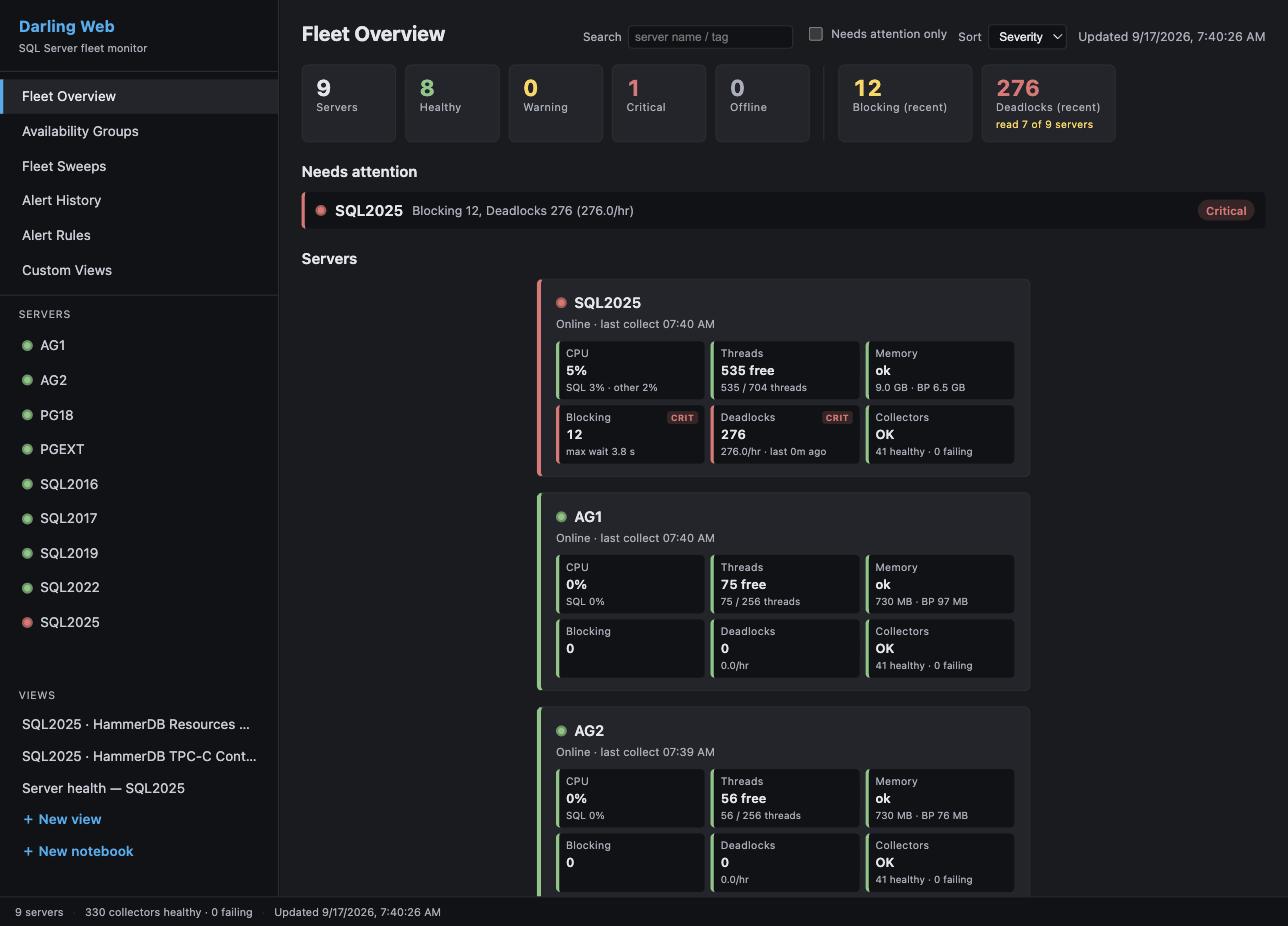
Editions
- Lite is a single desktop app that monitors your servers remotely, on demand. Nothing is installed on your server. It stores data in local DuckDB and Parquet files.
- Darling is a service on Windows or Linux that collects 24/7 into a central PostgreSQL store. The Windows viewer and the web dashboard read that store from any seat.
Both editions can hand an alert to an AI agent that you run, and Lite lets the agent read and report. Darling can also let it change alert settings (mutes, custom alert rules and thresholds). On a server, it can force or unforce a Query Store plan or evict a cached plan. It can recompile a module, create or drop a plan guide, or kill a session. Each of these has its own switch per server, and all are off until you turn them on. Darling records every change. A person can undo alert-setting changes, plan forces and plan guide changes. A plan eviction, a recompile or a session kill cannot be undone. Agent dispatch explains the levels.
The Dashboard edition is deprecated. Existing installs keep working, but we recommend Lite or Darling for new deployments. Choosing an edition compares all three.
Each release ships these downloads. For Lite, a Setup.exe and a portable ZIP. For Darling, the service ZIP (with the viewer inside), a Viewer Setup.exe for a remote seat, and the Linux and Compose tarballs. The Full Dashboard and its CLI installer ship nothing. Their last builds are in the v3.2.0 release.
Not sure which one? Start with Lite. It is one download, nothing is installed on your server, and data starts to flow in under 5 minutes.
Quick start: Lite
- Download
PerformanceMonitorLite-lite-Setup.exe. It is a self-contained build, so you do not install a .NET runtime first. - Run the installer. It adds Start Menu and Desktop shortcuts.
- Start Lite from the Start Menu or the Desktop shortcut.
- Click + Add Server, enter the connection details, test, and save.
- Double-click the server in the sidebar to connect.
Data starts to flow within 1 to 5 minutes. The monitoring login needs VIEW SERVER STATE (Permissions).
Before you upgrade an older install with Setup.exe, read the warning in the Lite guide. On versions older than 3.4.0, Setup.exe deletes the data in the install directory (see Upgrading an install older than 3.4.0). The Lite guide also covers the portable ZIP, collectors, storage, and configuration.
Quick start: Darling
- Download
PerformanceMonitorDarling-<version>.zipandSHA256SUMS.txtfrom the latest release. Check the zip hash againstSHA256SUMS.txt. The zip carries its own .NET runtime, so there is nothing to install first. - Extract the zip to
C:\Program Files\PerformanceMonitorDarling. Do not use your Desktop, Downloads, or any folder underC:\Users\. The service runs as a virtual account that cannot read a user profile (why). - Double-click
Install-Darling.cmdin the install folder. It asks Windows for administrator rights and runsinstall-darling.ps1. You can also run.\install-darling.ps1from an elevated PowerShell. It installs the Windows service and creates a Darling Viewer shortcut. With nodarling.jsonit writes a minimal one, and the service starts with no monitored servers. - Wait about two minutes for the first start, then open Darling Viewer. It opens on the fleet.
- Add your first server in the viewer.
darling.jsonis only a seed. The service reads it on its first start, so a server added to the file later is ignored (why). - The service log is in
%ProgramData%\PerformanceMonitorDarling\logs.
Install Darling gives each step with the log line or screen that proves it worked. To upgrade, run upgrade-darling.ps1. To remove the service, run uninstall-darling.ps1. Both are in the install folder. For Linux and the web dashboard, read the Darling quick start. The Darling operator guide is the configuration reference.
Documentation
| Page | What it covers |
|---|---|
| Choosing an edition | Lite, Darling, and Dashboard side by side |
| Features and screenshots | What you get, with screenshots |
| Lite guide | Install, upgrade, where Lite keeps its files, configuration, appearance, collectors |
| Lite Extended Events sessions | The sessions Lite creates on a monitored server, and how to remove them |
| Darling quick start | Install on Windows, Linux notes, web dashboard |
| Darling operator guide | Darling configuration, permissions, operations |
| Darling store sizing | Disk, RAM and vCPU for a store host, by number of servers |
| Back up, restore and move the store | Back up a Darling store, restore it, or move it to another machine |
| Darling guides | Install, viewer, web dashboard, MCP, day-to-day admin and command line reference |
| PostgreSQL target runbook | Point Darling at a PostgreSQL target, with a proof point at each step |
| Retention Held runbook | Clear a Retention Held alert |
| How collection works | A tour of the collection pipeline, for people who read the code |
| Documentation index | Every page in docs/, grouped by audience |
| Tabs | What each tab shows |
| Alerts and notifications | Alert types, channels, routes, email |
| Agent dispatch | Hand an alert to your own AI agent: levels, the brief and report, undo, the remediation login |
| Signed webhooks | Verify that a generic webhook post came from Darling |
| Agent job monitoring | Running SQL Agent jobs and jobs that run longer than expected |
| MCP server | Setup, the tool list and the Lite investigation tools for AI analysis |
| Authentication | Authentication types and credential profiles |
| Permissions | Grants for on-premises, Azure, and AWS RDS. The optional agent remediation login is in Agent dispatch |
| Platform notes | AWS RDS and Aurora configuration |
| Performance impact | Load on monitored servers, and local resources for Lite |
| Troubleshooting | Common problems for Lite and Darling |
| Building from source | Folder structure and build commands |
| Support and sponsorship | Commercial support tiers and sponsorship |
| Third-party components | Third-party components and their licenses |
| Changelog | Changes in each release |
Support
Performance Monitor is free and open source under the MIT License, with no features withheld. The tools that it replaces charge thousands of dollars per server per year. A support subscription covers all of your SQL Server instances.
| Tier | Cost per year | Email response | Includes |
|---|---|---|---|
| Supported | $500 | Within 2 business days | Guaranteed compatibility updates for new SQL Server versions, priority feature requests, a support agreement and invoices, unlimited instances |
| Priority | $2,500 | By the next business day | Everything in Supported, plus a quarterly live Q&A session, early access to new features, and direct input on the roadmap |
Support and sponsorship says what support gets you and has the link to buy. You can also sponsor on GitHub.
Sponsors
License
Copyright (c) 2026 Darling Data, LLC. Licensed under the MIT License. See LICENSE for details.
Author
Erik Darling: erikdarling.com and Darling Data, LLC
Questions sur PerformanceMonitor MCP
Quelles bases de données PerformanceMonitor peut-il surveiller ?
Il surveille SQL Server 2016 SP2 jusqu'à 2025, Azure SQL Managed Instance, AWS RDS pour SQL Server, ainsi que PostgreSQL 14 à 18, incluant RDS, Aurora et Azure Database for PostgreSQL.
Les agents IA ont-ils besoin de permissions spéciales pour modifier les paramètres d'alerte ?
Ils n'en ont la capacité que si vous l'activez par serveur ; tous ces commutateurs sont désactivés par défaut et chaque modification est enregistrée.
Quelles éditions PerformanceMonitor propose-t-il ?
Deux éditions principales : Lite, une application de bureau unique stockant les données localement, et Darling, un service qui collecte les données 24/7 dans un magasin PostgreSQL centralisé.
PerformanceMonitor est-il gratuit ?
Oui, il est gratuit et open source sous licence MIT sans aucune fonctionnalité restreinte ; des abonnements de support payants sont optionnels.
Comment débuter avec PerformanceMonitor ?
Commencez par Lite : un seul téléchargement, rien à installer sur votre serveur, et les données commencent à circuler en quelques minutes.