
Serveur MCP debugium
✓ VérifiéPropose un débogueur multilingue piloté par l'IA avec une interface web en temps réel et 64 outils MCP pour des sessions de débogage intégrées aux LLM.
Aussi connu sous Algiras/debugium, @algiras/debugium
- Étoiles
- 4
- Outils
- —
- Téléchargements, 30 jours
- 278
- Dernière version
- 1.0.0
- Dernier commit
- 16 mars 2026
- Licence
- —
Qu'est-ce que debugium MCP ?
debugium est un serveur MCP. Propose un débogueur multilingue piloté par l'IA avec une interface web en temps réel et 64 outils MCP pour des sessions de débogage intégrées aux LLM.
Résumé généré à partir du README du projet
À propos du MCP server debugium
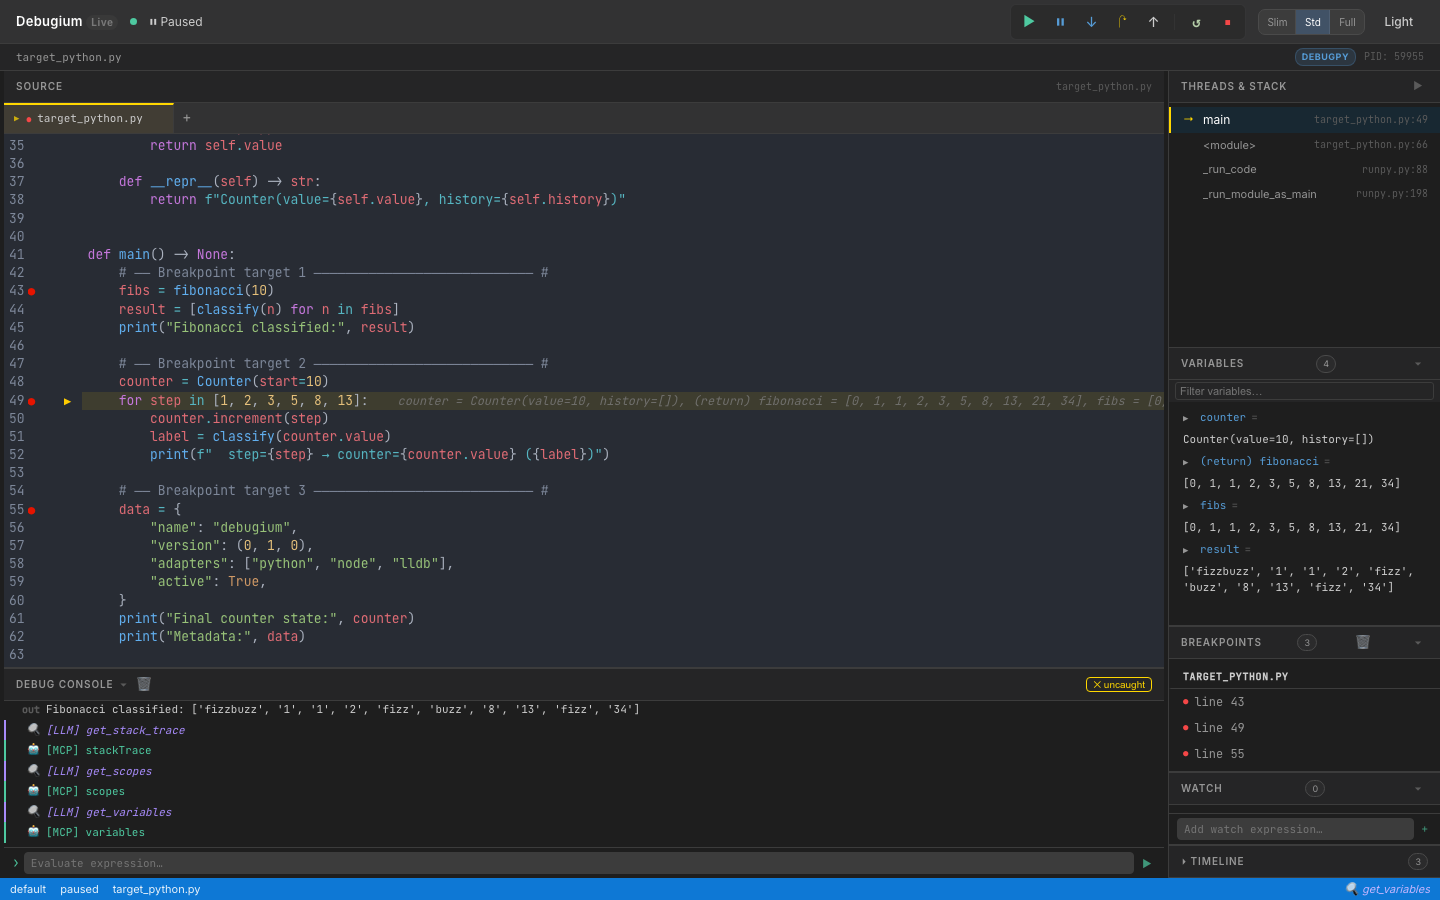
Debugium fournit un environnement de débogage multilingue conçu pour les développeurs souhaitant intégrer une inspection de code approfondie dans des workflows pilotés par l'IA. Il supporte un large éventail de langages, notamment Python, JavaScript, TypeScript, C, C++, Rust, Java, Scala et WebAssembly, en agissant comme un proxy pour divers adaptateurs Debug Adapter Protocol. Les utilisateurs peuvent interagir avec leurs sessions de débogage via une interface web en temps réel comprenant une visionneuse de code source, l'expansion de variables et une pile d'appels, ou via une interface en ligne de commande dotée de 13 sous-commandes.
Le serveur est conçu pour l'intégration aux LLM via le Model Context Protocol, exposant 64 outils spécialisés à des clients comme Claude. Ces outils permettent à une IA d'effectuer des tâches complexes telles que l'exécution pas à pas jusqu'à la modification d'une variable, l'explication d'exceptions ou la comparaison de snapshots de l'état du programme. Les développeurs peuvent lancer des sessions localement ou s'attacher à des processus distants s'exécutant dans des conteneurs ou sur d'autres machines. Le système prend également en charge la gestion multi-sessions ainsi que l'exportation et l'importation de sessions pour conserver les connaissances de débogage entre différentes sessions de travail.
Ce que vous pouvez faire avec
- 1Surveillance des changements d'étatUn développeur peut ordonner à une IA d'exécuter le code jusqu'à ce que la valeur d'une variable spécifique soit modifiée.
- 2Inspection de processus distantsVous pouvez connecter le débogueur à un processus déjà en cours d'exécution sur une machine différente ou au sein d'un conteneur.
- 3Snapshots de débogage contextuelsUn LLM peut récupérer l'état complet actuel du programme, incluant le code source et les variables locales, en une seule requête.
Extrait du README du projet. Chaque cas d'utilisation est vérifié par rapport à une citation du document.
Comment installer debugium MCP
Formats vérifiés le 10 nov. 2026Ajouter à CursorAjouter à GooseInstaller debugium MCP dans Claude Code
$ claude mcp add debugium -- npx -y @algiras/debugiumInstaller debugium MCP dans Cursor
~/.cursor/mcp.json
{
  "mcpServers": {
    "debugium": {
      "command": "npx",
      "args": [
        "-y",
        "@algiras/debugium"
      ]
    }
  }
}Installer debugium MCP dans VS Code
.vscode/mcp.json
{
  "servers": {
    "debugium": {
      "type": "stdio",
      "command": "npx",
      "args": [
        "-y",
        "@algiras/debugium"
      ]
    }
  }
}Installer debugium MCP dans VS Code CLI
$ code --add-mcp '{"name":"debugium","type":"stdio","command":"npx","args":["-y","@algiras/debugium"]}'Installer debugium MCP dans Claude Desktop
claude_desktop_config.json
{
  "mcpServers": {
    "debugium": {
      "command": "npx",
      "args": [
        "-y",
        "@algiras/debugium"
      ]
    }
  }
}Installer debugium MCP dans Codex
$ codex mcp add debugium -- npx -y @algiras/debugiumInstaller debugium MCP dans Codex config.toml
~/.codex/config.toml
[mcp_servers.debugium]
command = "npx"
args = ["-y", "@algiras/debugium"]
Installer debugium MCP dans Gemini CLI
$ gemini mcp add -s user debugium npx -- -y @algiras/debugiumInstaller debugium MCP dans Gemini settings.json
~/.gemini/settings.json
{
  "mcpServers": {
    "debugium": {
      "command": "npx",
      "args": [
        "-y",
        "@algiras/debugium"
      ]
    }
  }
}Vérifications automatisées
Exécuté le 15 nov. 2026Rapport complet →A passé nos vérifications automatisées. Il ne s'agit pas d'un audit de sécurité : lisez le code et donnez au serveur l'accès le plus restreint dont il a besoin. Fonctionnement des vérifications · Ce qu'il faut corriger pour gagner des points

- Dépôt source lié et accessiblealgiras/debugium is public and reachablegithub.com/algiras/debugium ↗Réussi
- Le nom du package correspond au dépôt source@algiras/debugium names algiras/debugium as sourcenpmjs.com/package/@algiras/debugium ↗Réussi
- Provenance du build (attestation Sigstore)No build attestation published for this releaseNon vérifié
- Licence open source (OSI)No licenseFaille
- Commit ou version publiée au cours de l'année écouléeLast commit or release 2026-03-16github.com/algiras/debugium ↗Réussi
- OpenSSF ScorecardNon vérifié
- Nom du package non proche d'un package populaireNo popular package one edit away from @algiras/debugiumRéussi
- Aucun avis critique dans le package ou ses dépendances1 resolved dependencies checked; no critical advisoryosv.dev ↗Réussi
- Aucune instruction cachée destinée au modèle0 tool descriptions and the README read; no override phrases, credential paths or hidden charactersRéussi
- Les outils destructifs sont étiquetésNon vérifié
- Le point de terminaison distant répond à la poignée de main MCPNon vérifié
README
Voir sur GitHubDebugium
A multi-language debugger with a real-time web UI and LLM integration via MCP.
Debug Python, JavaScript, TypeScript, C, C++, Rust, Java, Scala, and WebAssembly programs from your browser — with AI-driven analysis through the Model Context Protocol.


Features
Web UI
- Real-time web UI — source viewer, breakpoints, variables (recursive expansion), call stack, console, timeline, watch expressions, findings — all updated live via WebSocket
- Multi-tab source viewer — open multiple files, click stack frames to navigate
- Variable search — filter variables by name with recursive expansion
- Changed-variable highlighting — variables that changed since last stop shown in orange
- Thread selector — switch between threads in multi-threaded programs
- Panel collapse & resize — drag to resize, toggle to collapse; Slim / Standard / Full layout presets
- Dark / light mode toggle
- Auto-reconnect — UI reconnects after a dropped WebSocket, with visual status indicator
- Keyboard shortcuts — F5 continue, F10 step over, F11 step in, Shift+F11 step out, Ctrl/Cmd+D dark mode
- Button animations — in-flight spinner and completion flash for debug commands
Debugging
- Multi-language — Python (debugpy), Node.js/TypeScript (js-debug), C/C++/Rust (lldb-dap), Java (java-debug), Scala (Metals), WebAssembly (lldb-dap), or any DAP adapter via
dap.json - Comprehensive DAP coverage — 35+ DAP requests: breakpoints, stepping, goto, memory read/write, disassembly, and more
- Breakpoints — conditional, logpoints, hit-count, function, data (watchpoints), exception, run-to-cursor (
continue_until) - Multi-session — debug multiple programs simultaneously, with child session routing (js-debug)
- Remote debugging — attach to debugpy, JDWP, or Node inspector running on another machine or container
LLM / MCP Integration
- 64 MCP tools — the full debug session exposed to Claude or any LLM
- Capability-gated tools — tools automatically shown/hidden based on adapter capabilities
- Compound tools —
get_debug_context(orient in one call),step_until,step_until_change,run_until_exception,explain_exception,get_call_tree,compare_snapshots,find_first_change - Execution timeline — every stop recorded with changed variables and stack summary
- Watch expressions — evaluated automatically at every breakpoint, manageable by LLM or UI
- Annotations & findings — pin notes to source lines, record conclusions visible in the UI
- Session export/import — save and restore debugging knowledge across sessions
CLI Control
- Full CLI — 13 subcommands to drive sessions from a second terminal without the web UI
- Auto-discovery — port file at
~/.debugium/port, session logs in~/.debugium/sessions/
Install
Claude Code Plugin (recommended)
/plugin marketplace add Algiras/debugium
/plugin install debugium@debugium
Then add to your project's .mcp.json (see MCP Tools below).
macOS / Linux binary
curl -fsSL https://raw.githubusercontent.com/Algiras/debugium/main/install.sh | bash
From source
# Prerequisites: Rust stable + wasm-pack
cargo install wasm-pack

# Build UI
wasm-pack build crates/debugium-ui --target web --out-dir pkg
cp crates/debugium-ui/pkg/cm_init.js         crates/debugium-ui/dist/pkg/
cp crates/debugium-ui/pkg/debugium_ui.js      crates/debugium-ui/dist/pkg/
cp crates/debugium-ui/pkg/debugium_ui_bg.wasm crates/debugium-ui/dist/pkg/

# Build & install server
cargo install --path crates/debugium-server
Usage
Debug a Python file
debugium launch my_script.py --adapter python
Debug a Node.js / TypeScript file
debugium launch app.js --adapter node
debugium launch app.ts --adapter typescript
Debug C / C++ / Rust
# C or C++ (compile with -g for debug info)
cc -g -O0 main.c -o main && debugium launch ./main --adapter lldb
c++ -g -O0 main.cpp -o main && debugium launch ./main --adapter lldb

# Rust
cargo build && debugium launch target/debug/my_binary --adapter lldb
Debug Java / Scala
# Java (requires microsoft/java-debug adapter)
debugium launch MainClass --adapter java

# Scala (connect to a running Metals DAP server)
debugium launch build-target --adapter metals
debugium launch build-target --adapter metals:5005  # custom port
Attach to a running process (remote debugging)
# Python (debugpy listening on port 5678)
debugium attach --port 5678 --adapter python

# Java (JDWP on port 5005)
debugium attach --port 5005 --adapter java

# Node.js (inspector on port 9229)
debugium attach --port 9229 --adapter node
Or via MCP: attach_session(port=5678, adapter="python", breakpoints=["/path/app.py:42"])
Use a custom adapter via dap.json
# Create a dap.json (see dap.json.example) then:
debugium launch my_program --config ./dap.json

# Or place dap.json in cwd / .debugium/ for auto-discovery:
debugium launch my_program   # finds ./dap.json automatically
Set initial breakpoints
debugium launch my_script.py --adapter python \
  --breakpoint /abs/path/my_script.py:42 \
  --breakpoint /abs/path/helpers.py:15
Enable LLM / MCP integration
Add a .mcp.json to your project root (Claude Code picks this up automatically):
{
  "mcpServers": {
    "debugium": {
      "command": "debugium",
      "args": ["mcp"]
    }
  }
}
Then launch the session normally — the MCP server connects to whichever port is active:
debugium launch my_script.py --adapter python --breakpoint /abs/path/my_script.py:42
Claude Code will now have access to all Debugium MCP tools. See CLAUDE.md for the recommended workflow and SKILL.md for the full tool reference.
CLI Control Commands
Once a session is running (debugium launch …), you can drive it from a second terminal — or from an LLM agent — without touching the web UI.
Port is auto-discovered from ~/.debugium/port; override with --port.
Global flags (all subcommands)
| Flag | Default | Description |
|---|---|---|
--port PORT |
~/.debugium/port |
Server port to connect to |
--session ID |
default |
Session to target |
--json |
off | Print raw JSON instead of human-readable output |
Inspection
debugium sessions                  # list active sessions
debugium threads                   # list threads
debugium stack                     # show call stack
debugium vars                      # show local variables (auto-resolves top frame)
debugium vars --frame-id 2         # show variables for a specific frame
debugium eval "len(fibs)"          # evaluate expression in top frame
debugium eval "x + 1" --frame-id 2
debugium source path/to/file.py    # print full source file
debugium source path/to/file.py --line 43  # windowed ±10 lines with → marker
debugium context                   # full snapshot: paused-at, stack, locals, source, breakpoints
debugium context --compact         # same but truncated (3 frames, 10 vars)
Breakpoints
debugium bp set FILE:LINE [FILE:LINE …]   # set breakpoints (replaces existing in that file)
debugium bp list                          # list all breakpoints
debugium bp clear                         # clear all breakpoints
Execution control
debugium continue                  # resume execution
debugium step over                 # step over (next line)
debugium step in                   # step into a function call
debugium step out                  # step out of current function
UI annotations (visible in the web UI)
debugium annotate FILE:LINE "message" [--color info|warning|error]
debugium finding "message"         [--level  info|warning|error]
Example workflow
# Terminal A — start the session
debugium launch tests/target_python.py --adapter python \
  --breakpoint "$(pwd)/tests/target_python.py:43"

# Terminal B (or LLM agent) — inspect and drive it
debugium sessions
debugium stack
debugium vars
debugium eval "len(fibs)"
debugium bp set tests/target_python.py:49
debugium continue                  # runs to line 49
debugium vars
debugium step over
debugium context --json            # machine-readable snapshot
debugium annotate tests/target_python.py:43 "called here" --color info
debugium finding "fibs has 10 elements" --level info
debugium bp clear
MCP Tools
When connected via MCP, 64 tools are available. Key ones:
| Category | Tools |
|---|---|
| Orient | get_debug_context ★ (paused location + locals + stack + source in one call) |
| Breakpoints | set_breakpoint, set_breakpoints, set_logpoint, list_breakpoints, clear_breakpoints, set_function_breakpoints, set_exception_breakpoints, set_data_breakpoint, list_data_breakpoints, clear_data_breakpoints, breakpoint_locations |
| Execution | continue_execution, step_over, step_in, step_out, pause, goto, disconnect, terminate, restart |
| Inspection | get_stack_trace, get_scopes, get_variables, evaluate, get_threads, get_source, get_capabilities, loaded_sources, source_by_reference, step_in_targets |
| Mutation | set_variable, set_expression |
| Output | get_console_output, wait_for_output (with from_line to avoid stale matches) |
| Memory | read_memory, write_memory, disassemble (native debugging) |
| History | get_timeline, get_variable_history, compare_snapshots, find_first_change |
| Annotations | annotate, get_annotations, add_finding, get_findings |
| Watches | add_watch, remove_watch, get_watches |
| Compound | step_until, step_until_change, continue_until, run_until_exception, explain_exception, get_call_tree, restart_frame |
| Session | get_sessions, list_sessions, launch_session, attach_session, stop_session, export_session, import_session |
| Control | goto_targets, cancel_request |
Note:
step_over,step_in, andstep_outare blocking — they wait for the adapter to pause before returning. Safe to chain back-to-back without sleeps.continue_executionreturnsconsole_line_countfor use withwait_for_output. Tools likeread_memory,goto, andrestart_frameonly appear when the adapter supports them.
See SKILL.md for the full reference with input schemas.
Keyboard Shortcuts
| Key | Action |
|---|---|
F5 |
Continue |
F10 |
Step Over |
F11 |
Step Into |
Shift+F11 |
Step Out |
Ctrl/⌘+D |
Toggle dark/light mode |
Architecture
debugium-server (Rust + Axum)
├── DAP proxy     — spawns / attaches to debug adapters (debugpy, js-debug, lldb-dap, java-debug, Metals, custom)
├── HTTP API      — /state, /sessions, /annotations, /findings, /watches, /timeline
├── WebSocket     — broadcasts DAP events + enriched stop data (changed vars, timeline) to UI
├── MCP stdio     — JSON-RPC 2.0 server exposing 64 tools for LLM integration
├── CLI control   — 13 subcommands to drive sessions from a second terminal
└── ~/.debugium/  — port file, session logs (events.ndjson), debug log

debugium-ui (Leptos + WASM)
├── CodeMirror 6  — source viewer with breakpoint gutters, exec arrow, LLM annotations, multi-tab
├── Reactive panels — Variables, Stack, Breakpoints, Findings, Watch, Timeline, Console (18 components)
└── WebSocket     — receives events, sends DAP commands, auto-reconnects with status indicator
Supported Languages & Adapters
| Language | --adapter flag |
Prerequisite | Verified |
|---|---|---|---|
| Python | python / debugpy |
pip install debugpy |
✅ |
| Node.js | node / js |
js-debug (bundled or build from vscode-js-debug) | ✅ |
| TypeScript | typescript / ts / tsx |
js-debug + tsx or ts-node in PATH |
✅ |
| C / C++ | lldb / codelldb |
lldb-dap (Xcode on macOS; apt install lldb on Linux) |
✅ |
| Rust | lldb / rust |
lldb-dap + cargo build |
✅ |
| Java | java / jvm |
microsoft/java-debug adapter JAR | ✅ |
| Scala | metals / scala |
Running Metals DAP server | ⚠️ (requires running Metals) |
| WebAssembly | wasm |
lldb-dap (LLVM ≥16) |
⚠️ (requires WASM-aware LLVM) |
| Any DAP adapter | --config dap.json |
See dap.json.example |
✅ |
Remote debugging
Connect to a DAP server running on another machine (or in a container):
{
  "adapterId": "debugpy",
  "request": "attach",
  "host": "192.168.1.100",
  "port": 5678,
  "pathMappings": [{ "localRoot": ".", "remoteRoot": "/app" }]
}
debugium launch app.py --config remote.json
License
MIT
Questions sur debugium MCP
Comment ajouter debugium MCP à Claude Code ?
Exécutez claude mcp add debugium -- npx -y @algiras/debugium dans votre terminal. Ajoutez --scope user pour le rendre disponible dans tous les projets.
Comment ajouter debugium MCP à Cursor ?
Ouvrez ~/.cursor/mcp.json et ajoutez le serveur sous mcpServers, avec la configuration Cursor indiquée dans la section d'installation ci-dessus.
Quels langages de programmation sont supportés par Debugium ?
Il supporte Python, JavaScript, TypeScript, C, C++, Rust, Java, Scala et WebAssembly.
Combien d'outils MCP sont disponibles ?
Il y a 64 outils MCP disponibles, incluant des outils pour les points d'arrêt, le contrôle d'exécution, l'inspection et la mutation.
Puis-je déboguer un processus s'exécutant sur une autre machine ?
Oui, vous pouvez utiliser le débogage à distance pour vous attacher à debugpy, JDWP ou Node inspector s'exécutant sur une autre machine ou dans un conteneur.
Comment activer l'intégration avec les LLM ?
Vous pouvez l'activer en ajoutant un fichier .mcp.json à la racine de votre projet spécifiant la commande debugium avec l'argument mcp.