
Позволяет кодинг-агентам воспроизводить периодические сбои тестов, минимизировать входные данные для воспроизведения и подтверждать исправления кода эмпирическими данными.
Также известен как LBarimi/FailTrace
- Звёзды
- 0
- Инструменты
- —
- Загрузки, 30 дней
- —
- Последняя версия
- 1.5.0
- Последний коммит
- 7 сент. 2026 г.
- Лицензия
- MIT
Что такое FailTrace MCP?
Позволяет кодинг-агентам воспроизводить периодические сбои тестов, минимизировать входные данные для воспроизведения и подтверждать исправления кода эмпирическими данными.
Сводка сгенерирована из README проекта
О FailTrace MCP server
FailTrace предоставляет кодинг-агентам способ обработки периодических сбоев тестов путем создания эмпирических доказательств для отладки. Инструмент работает через локальный stdio MCP server или CLI, позволяя разработчикам фиксировать базовый сценарий сбоя, минимизировать входные данные для воспроизведения и проверять патчи кода. Инструмент запускается локально на вашей машине с использованием Node.js 22.12+ и npm, что означает отсутствие необходимости во внешних AI API, аккаунтах или телеметрии для работы.
Агенты могут использовать семь специализированных MCP инструментов для управления жизненным циклом исследования, включая поиск регрессий, минимизацию и верификацию. Система отслеживает сигнатуры сбоев и доказательства исследования на протяжении нескольких попыток. Она поддерживает существующие раннеры тестов и ассерты, включая специфическую поддержку NUnit и Unity EditMode тестов. Чтобы предотвратить разрастание данных, сервер ограничивает объем сохраняемых stdout и stderr до 16 MiB на попытку и 256 MiB на процесс запуска или минимизации.
Что вы можете с ним делать
- 1Минимизация входных данных для воспроизведенияАгент может сократить сложный набор входных данных до минимально возможного объема, необходимого для вызова конкретного сбоя теста.
- 2Верификация патчей кодаРазработчик может использовать инструмент, чтобы проверить, действительно ли предложенное исправление устраняет целевой сбой по сравнению с сохраненным базовым сценарием.
- 3Поиск источников регрессииСистема может помочь определить, какое именно изменение в Git привело к появлению падающего теста с помощью процесса бисекции.
- 4Фиксация периодических сбоевПользователи могут запустить команду для многократного повторения теста, чтобы зафиксировать стабильную сигнатуру сбоя.
Взято из README проекта. Каждый вариант использования проверен на соответствие цитате из него.
Как установить FailTrace MCP
Форматы проверены 10 ноя 2026Добавить в CursorДобавить в GooseУстановка FailTrace MCP в Claude Code
$ claude mcp add failtrace -- npx -y failtraceУстановка FailTrace MCP в Cursor
~/.cursor/mcp.json
{
  "mcpServers": {
    "failtrace": {
      "command": "npx",
      "args": [
        "-y",
        "failtrace"
      ]
    }
  }
}Установка FailTrace MCP в VS Code
.vscode/mcp.json
{
  "servers": {
    "failtrace": {
      "type": "stdio",
      "command": "npx",
      "args": [
        "-y",
        "failtrace"
      ]
    }
  }
}Установка FailTrace MCP в VS Code CLI
$ code --add-mcp '{"name":"failtrace","type":"stdio","command":"npx","args":["-y","failtrace"]}'Установка FailTrace MCP в Claude Desktop
claude_desktop_config.json
{
  "mcpServers": {
    "failtrace": {
      "command": "npx",
      "args": [
        "-y",
        "failtrace"
      ]
    }
  }
}Установка FailTrace MCP в Codex
$ codex mcp add failtrace -- npx -y failtraceУстановка FailTrace MCP в Codex config.toml
~/.codex/config.toml
[mcp_servers.failtrace]
command = "npx"
args = ["-y", "failtrace"]
Установка FailTrace MCP в Gemini CLI
$ gemini mcp add -s user failtrace npx -- -y failtraceУстановка FailTrace MCP в Gemini settings.json
~/.gemini/settings.json
{
  "mcpServers": {
    "failtrace": {
      "command": "npx",
      "args": [
        "-y",
        "failtrace"
      ]
    }
  }
}Автоматические проверки
Запущено 15 нояб. 2026 г.Полный отчёт →Прошло наши автоматизированные проверки. Это не аудит безопасности: изучите код и предоставьте серверу минимально необходимый доступ. Как работают проверки

- Связанный и доступный исходный репозиторийlbarimi/failtrace is public and reachablegithub.com/lbarimi/failtrace ↗Пройдено
- Пакет указывает этот репозиторий как источникfailtrace names lbarimi/failtrace as sourcenpmjs.com/package/failtrace ↗Пройдено
- Происхождение сборки (аттестация Sigstore)No build attestation published for this releaseНе проверялось
- Open source лицензия (OSI)MITspdx.org/licenses/MIT.html ↗Пройдено
- Коммит или релиз за последний годLast commit or release 2026-09-07github.com/lbarimi/failtrace ↗Пройдено
- OpenSSF ScorecardНе проверялось
- Имя пакета не похоже на популярный пакетNo popular package one edit away from failtraceПройдено
- Нет критических предупреждений в пакете или его зависимостях6 resolved dependencies checked; no critical advisoryosv.dev ↗Пройдено
- Нет скрытых инструкций для модели0 tool descriptions and the README read; no override phrases, credential paths or hidden charactersПройдено
- Деструктивные инструменты помеченыНе проверялось
- Удалённая конечная точка отвечает на рукопожатие MCPНе проверялось
README
Открыть на GitHubFailTrace
Reproduce the failure. Check the fix.
A test fails intermittently. Your coding agent changes the code. One passing retry leaves you guessing.
FailTrace repeats the same check, saves a failing baseline, and checks the proposed fix against it. Use the CLI or MCP tools to get trial results, a smaller reproducer, and evidence your agent can inspect before accepting a patch.


Local execution. No AI API, account, or telemetry required. Keep your existing test runner and assertions.
Quick start
With Node.js 22.12+ and npm, run this in any working directory:
npx --yes failtrace demo
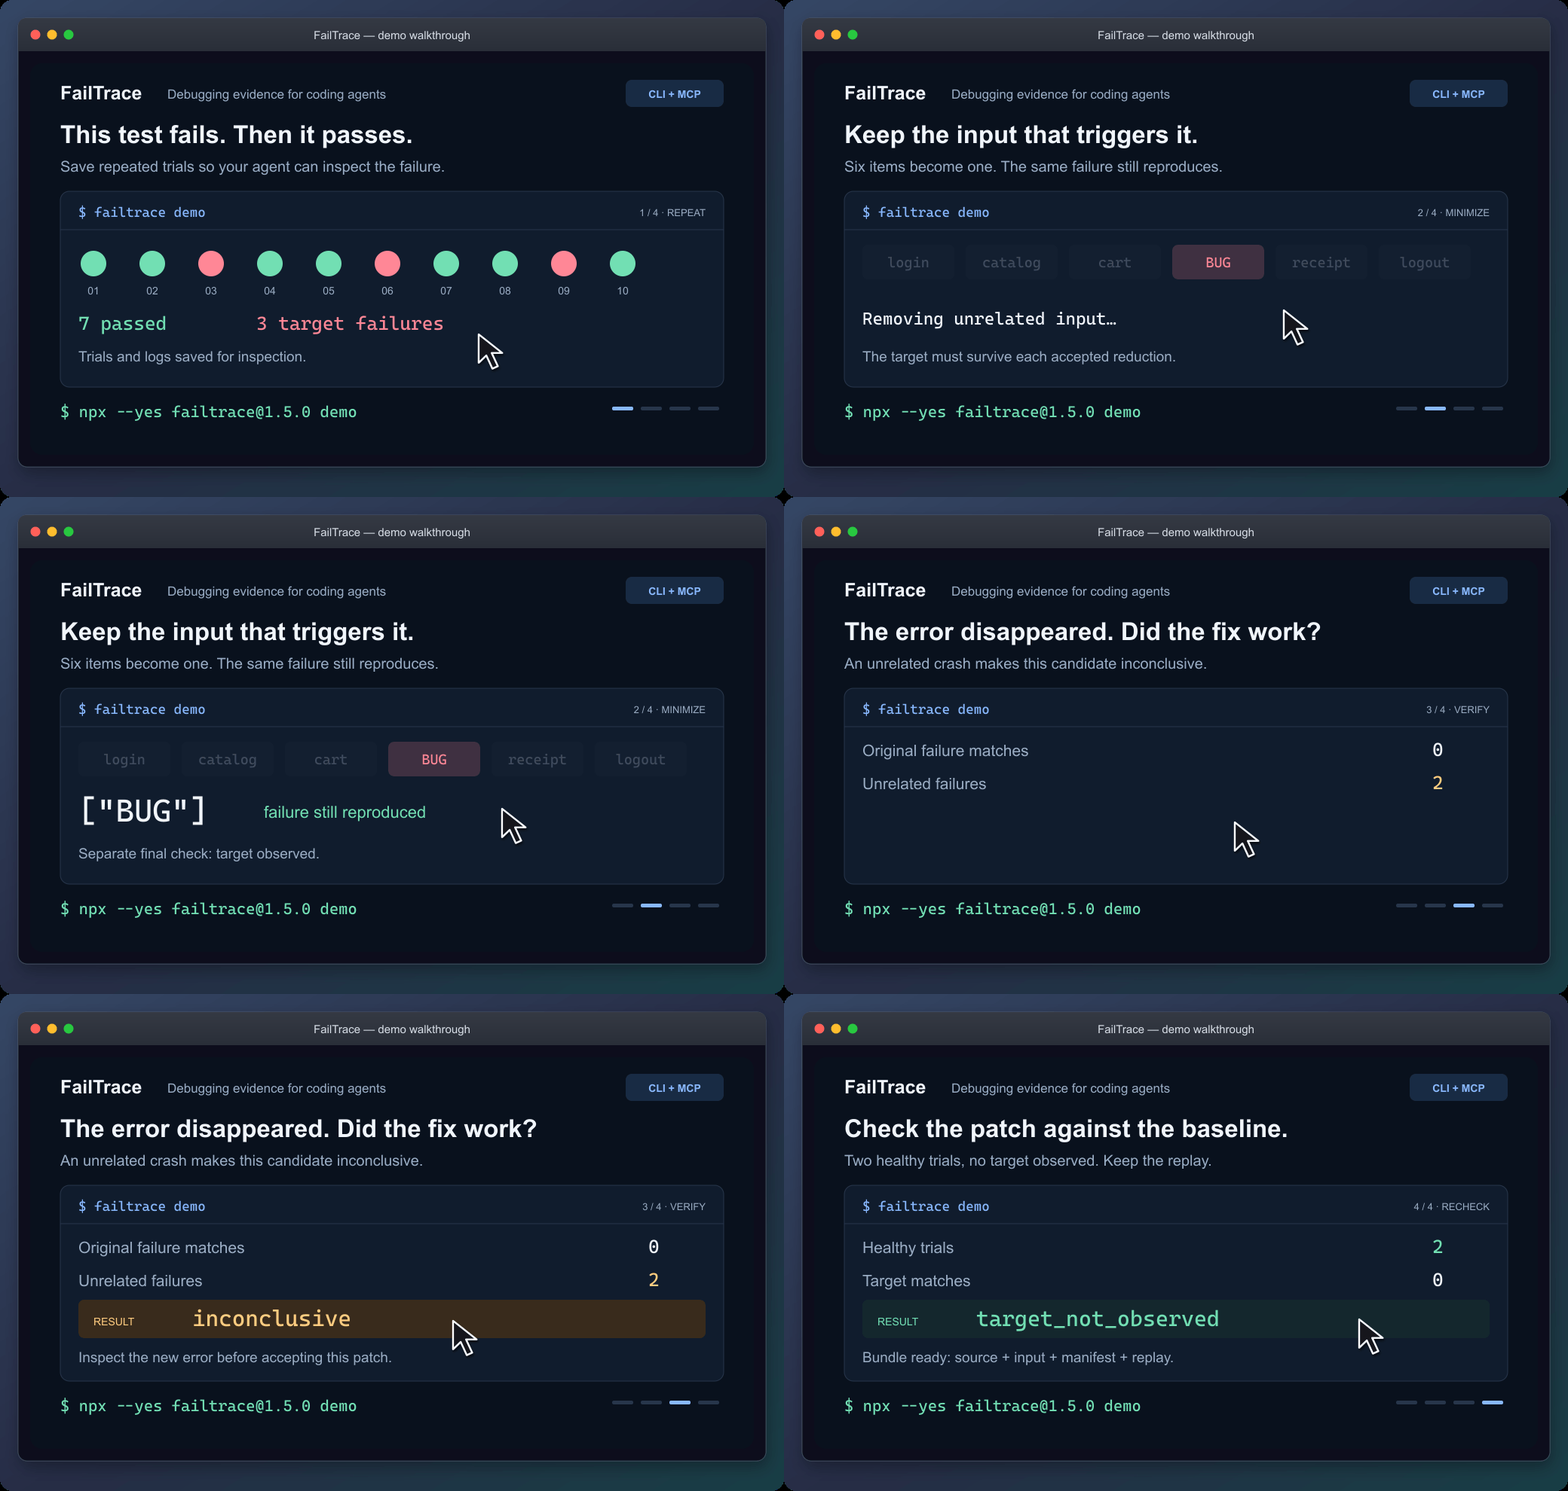
Static walkthrough · Static poster · Demo guide
The demo reduces six input items to ["BUG"], rejects a patch that crashes for another reason, and checks a working patch. It saves the evidence in .failtrace/ and prints a replay command.
For coding agents
Connect the local stdio MCP server through your client's configuration:
npx --yes failtrace@1.5.0 mcp --cwd "/absolute/path/to/your/project"
Copy the MCP configuration and check the connection →
Your client launches this command. Running it alone in a terminal waits for MCP requests. The guide includes Windows setup.
Then ask your agent:
Use FailTrace to capture this test failure before editing. Choose the exact test or failure message, save a bounded baseline, and inspect the matching trial. After the change, verify against that baseline and explain any unrelated errors or incomplete evidence.
The seven MCP tools share the CLI's Core engine. They retain the failure signature and investigation evidence across repetition, comparison, regression search, minimization, verification and replay. Agents can retrieve saved trial and log pages without rerunning the command. Shell-capable agents can also use the CLI with --json.
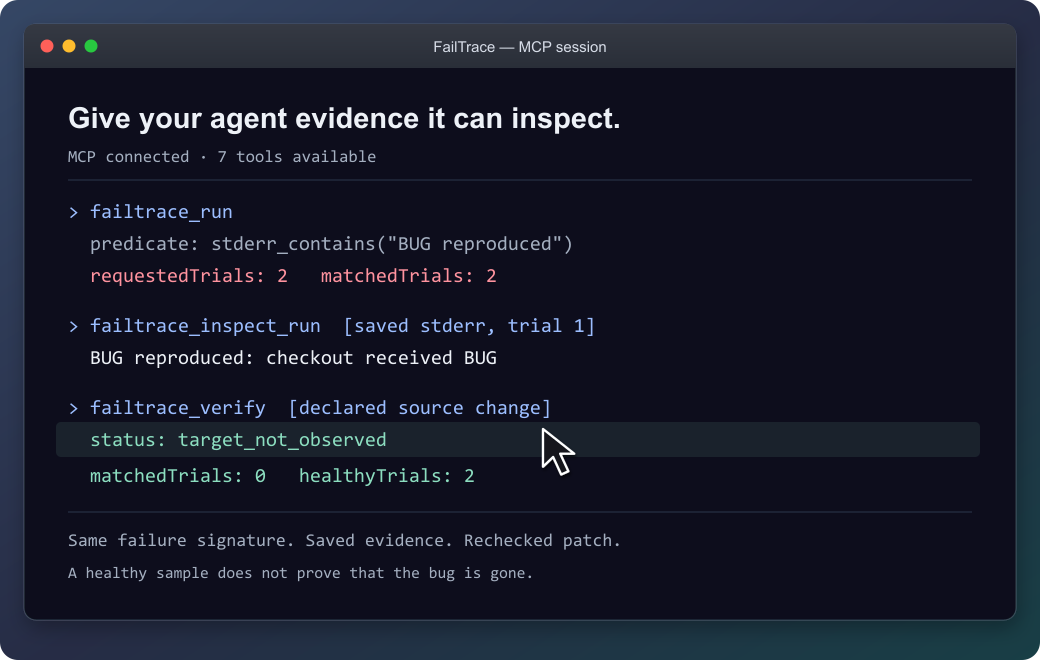
The agent can inspect the saved failure before checking the patch.
Recheck an existing unit test
Follow an exact NUnit or Unity test through a fix. Each attempt gets a fresh NUnit 3 report. Missing or skipped tests and unrelated failures stay inconclusive, so an agent cannot accept them as evidence that the selected test passed.
Connect your test or try the original EditMode example →
NUnit support is included in 1.3.0 through CLI and MCP. The documented Unity validation covers the Windows EditMode example.
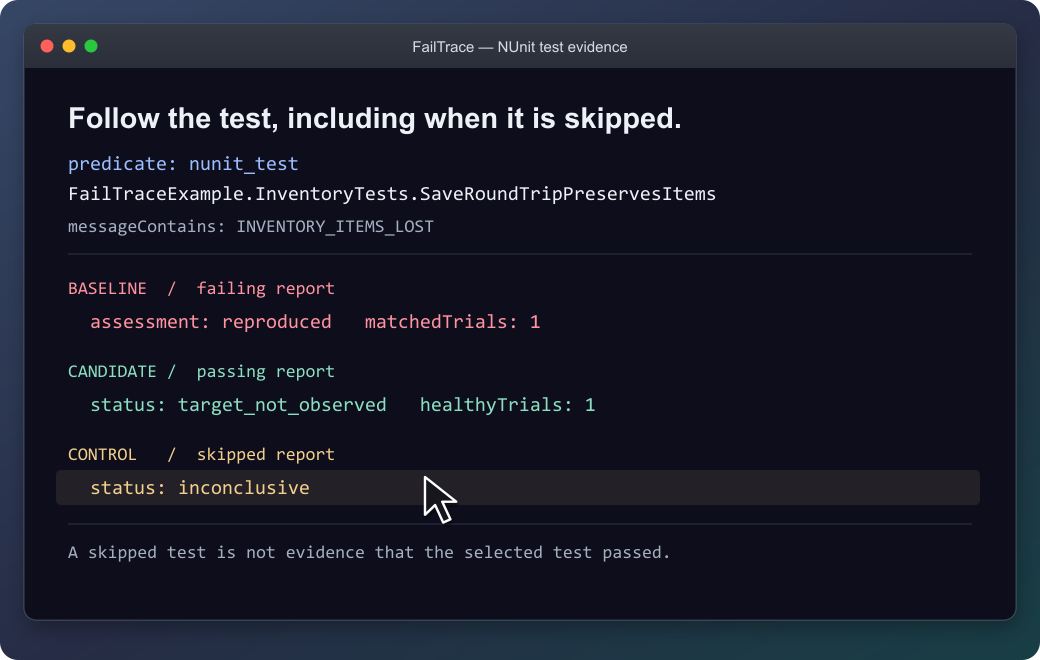
The selected test stays the same; a skipped report is not accepted as a passing test.
Use it on your own failure
From your project, replace the command and message with your own:
npx --yes failtrace@1.5.0 run "npm test -- checkout" --repeat 20 --stderr-contains "checkout failed" --capture-context
Run this before editing in a Git project. --capture-context records source identity for Verify; outside Git, select files with --context-source. Each trial saves its output, and exit 1 can mean the target was captured successfully. Then edit and verify the patch →
| Your next question | Command |
|---|---|
| How often does this failure appear? | run |
| What differs between a healthy and failing trial? | compare |
| Which Git change introduced it? | bisect |
| What input is enough to reproduce it? | minimize |
| What happened after the proposed fix? | verify |
| How can I replay this investigation? | bundle |
Command reference · Literal executable arguments · Reusable project scripts
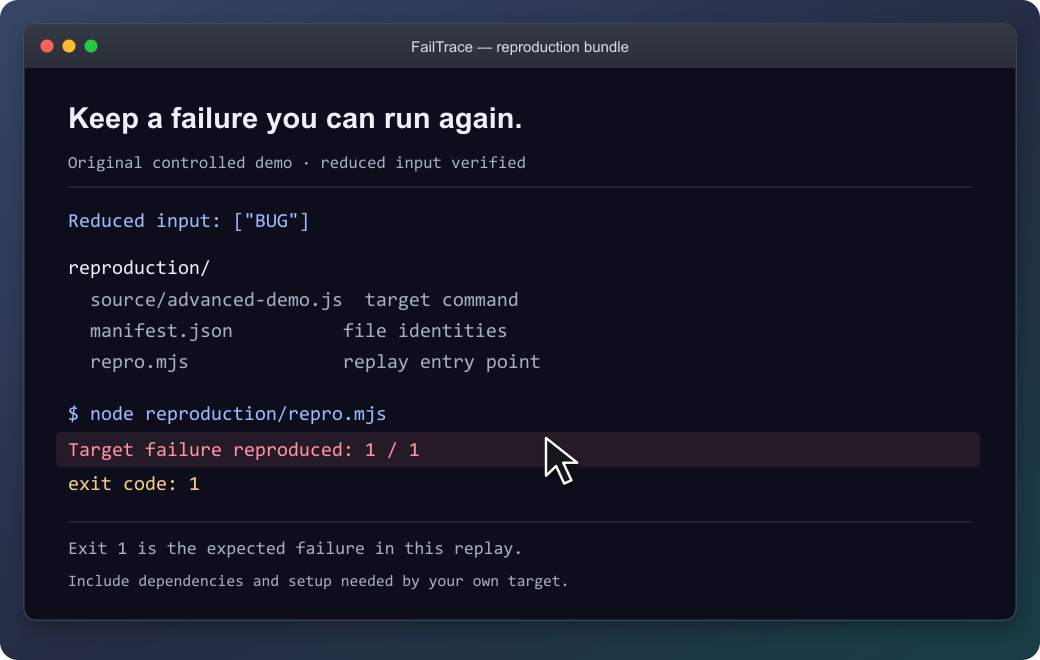
The demo's bundle reproduces its original failure with exit 1. Keep the source, input and replay together; supply the target's prerequisites when packaging your own investigation.
What the results establish
FailTrace reports observations under the chosen settings. Verify separates a target observed, a healthy sample without that target, and inconclusive evidence. Bisect reports a sampled first-parent boundary; minimization rechecks its result without promising the smallest possible input.
The demo shows controlled example outcomes, not performance measurements. A passing sample does not prove a bug is gone.
Commands run with your permissions, and process cleanup is best effort. Retained stdout/stderr is capped by default at 16 MiB per trial and 256 MiB per run or bisect/minimization. Previous investigations accumulate separately. Review logs, commands and selected files before sharing; bundles still require the target's dependencies and setup.
Result and exit-code reference · Resource limits · Storage inventory · Bundle guide
Availability and contributing
The quick start uses npm's latest release; the verified version is 1.5.0. MCP configuration and repeatable installation examples keep that exact version pinned: installation options, GitHub release, and MCP Registry entry.
Version 1.5.0 adds: short run references, Verify readiness and next-step guidance, and intermittent-minimization guidance. See the changelog.
Documentation: choose your next task →
Development instructions · Compatibility · Roadmap · Third-party notices
Вопросы о FailTrace MCP
Как добавить FailTrace MCP в Claude Code?
Выполните claude mcp add failtrace -- npx -y failtrace в терминале. Добавьте --scope user, чтобы сервер был доступен во всех проектах.
Как добавить FailTrace MCP в Cursor?
Откройте ~/.cursor/mcp.json и добавьте сервер в mcpServers, используя конфигурацию Cursor из раздела установки выше.
Требуется ли для FailTrace AI API или аккаунт?
Нет, инструмент выполняет локальное выполнение и не требует использования AI API, аккаунтов или телеметрии.
Можно ли использовать FailTrace с тестами NUnit?
Да, поддержка NUnit включена в версии 1.3.0 и выше как через CLI, так и через MCP.
Каковы ограничения ресурсов для логов?
Объем сохраняемых stdout/stderr ограничен 16 MiB на одну попытку и 256 MiB на один запуск, бисекцию или процесс минимизации.
Доказывает ли успешное прохождение теста, что баг исправлен?
Нет, успешное прохождение теста не является абсолютным доказательством того, что баг полностью устранен.