
MCP server debugium
✓ ПровереноПредоставляет многоязычный отладчик на базе ИИ с веб-интерфейсом в реальном времени и 64 MCP инструментами для сессий отладки, интегрированных с LLM.
Также известен как Algiras/debugium, @algiras/debugium
- Звёзды
- 4
- Инструменты
- —
- Загрузки, 30 дней
- 278
- Последняя версия
- 1.0.0
- Последний коммит
- 16 мар. 2026 г.
- Лицензия
- —
Что такое debugium MCP?
debugium — это MCP server. Предоставляет многоязычный отладчик на базе ИИ с веб-интерфейсом в реальном времени и 64 MCP инструментами для сессий отладки, интегрированных с LLM.
Сводка сгенерирована из README проекта
О debugium MCP server
Debugium предоставляет многоязычную среду отладки, разработанную для разработчиков, которые хотят интегрировать глубокую инспекцию кода в рабочие процессы на базе ИИ. Он поддерживает широкий спектр языков, включая Python, JavaScript, TypeScript, C, C++, Rust, Java, Scala и WebAssembly, выступая в качестве прокси для различных адаптеров Debug Adapter Protocol. Пользователи могут взаимодействовать со своими сессиями отладки через веб-интерфейс в реальном времени с просмотром исходного кода, раскрытием переменных и стеком вызовов или через интерфейс командной строки с 13 подкомандами.
Сервер построен для интеграции с LLM через Model Context Protocol, предоставляя 64 специализированных инструмента таким клиентам, как Claude. Эти инструменты позволяют ИИ выполнять сложные задачи, такие как пошаговое выполнение до изменения значения переменной, объяснение исключений или сравнение снимков состояния программы. Разработчики могут запускать сессии локально или подключаться к удаленным процессам, работающим в контейнерах или на других машинах. Система также поддерживает управление несколькими сессиями, а также экспорт и импорт сессий для сохранения знаний об отладке между различными рабочими сессиями.
Что вы можете с ним делать
- 1Мониторинг изменения состоянияРазработчик может дать команду ИИ выполнять код до тех пор, пока значение определенной переменной не изменится.
- 2Инспекция удаленных процессовВы можете подключить отладчик к процессу, который уже запущен на другой машине или внутри контейнера.
- 3Контекстные снимки отладкиLLM может получить всё текущее состояние программы, включая исходный код и локальные переменные, за один запрос.
Взято из README проекта. Каждый вариант использования проверен на соответствие цитате из него.
Как установить debugium MCP
Форматы проверены 10 ноя 2026Добавить в CursorДобавить в GooseУстановка debugium MCP в Claude Code
$ claude mcp add debugium -- npx -y @algiras/debugiumУстановка debugium MCP в Cursor
~/.cursor/mcp.json
{
  "mcpServers": {
    "debugium": {
      "command": "npx",
      "args": [
        "-y",
        "@algiras/debugium"
      ]
    }
  }
}Установка debugium MCP в VS Code
.vscode/mcp.json
{
  "servers": {
    "debugium": {
      "type": "stdio",
      "command": "npx",
      "args": [
        "-y",
        "@algiras/debugium"
      ]
    }
  }
}Установка debugium MCP в VS Code CLI
$ code --add-mcp '{"name":"debugium","type":"stdio","command":"npx","args":["-y","@algiras/debugium"]}'Установка debugium MCP в Claude Desktop
claude_desktop_config.json
{
  "mcpServers": {
    "debugium": {
      "command": "npx",
      "args": [
        "-y",
        "@algiras/debugium"
      ]
    }
  }
}Установка debugium MCP в Codex
$ codex mcp add debugium -- npx -y @algiras/debugiumУстановка debugium MCP в Codex config.toml
~/.codex/config.toml
[mcp_servers.debugium]
command = "npx"
args = ["-y", "@algiras/debugium"]
Установка debugium MCP в Gemini CLI
$ gemini mcp add -s user debugium npx -- -y @algiras/debugiumУстановка debugium MCP в Gemini settings.json
~/.gemini/settings.json
{
  "mcpServers": {
    "debugium": {
      "command": "npx",
      "args": [
        "-y",
        "@algiras/debugium"
      ]
    }
  }
}Автоматические проверки
Запущено 15 нояб. 2026 г.Полный отчёт →Прошло наши автоматизированные проверки. Это не аудит безопасности: изучите код и предоставьте серверу минимально необходимый доступ. Как работают проверки · Что исправить, чтобы получить больше баллов

- Связанный и доступный исходный репозиторийalgiras/debugium is public and reachablegithub.com/algiras/debugium ↗Пройдено
- Пакет указывает этот репозиторий как источник@algiras/debugium names algiras/debugium as sourcenpmjs.com/package/@algiras/debugium ↗Пройдено
- Происхождение сборки (аттестация Sigstore)No build attestation published for this releaseНе проверялось
- Open source лицензия (OSI)No licenseПроблема
- Коммит или релиз за последний годLast commit or release 2026-03-16github.com/algiras/debugium ↗Пройдено
- OpenSSF ScorecardНе проверялось
- Имя пакета не похоже на популярный пакетNo popular package one edit away from @algiras/debugiumПройдено
- Нет критических предупреждений в пакете или его зависимостях1 resolved dependencies checked; no critical advisoryosv.dev ↗Пройдено
- Нет скрытых инструкций для модели0 tool descriptions and the README read; no override phrases, credential paths or hidden charactersПройдено
- Деструктивные инструменты помеченыНе проверялось
- Удалённая конечная точка отвечает на рукопожатие MCPНе проверялось
README
Открыть на GitHubDebugium
A multi-language debugger with a real-time web UI and LLM integration via MCP.
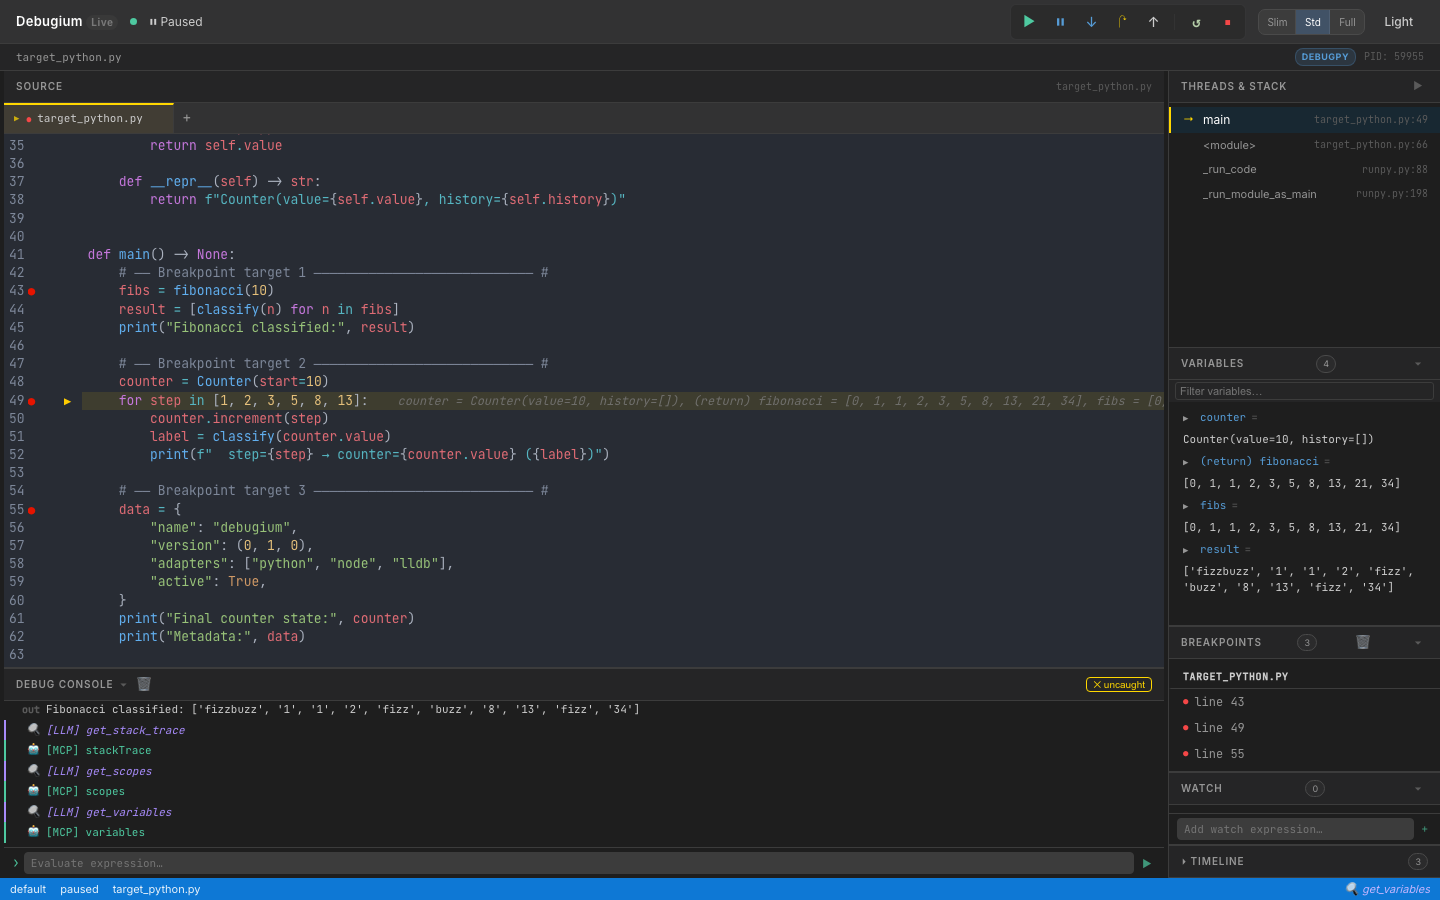
Debug Python, JavaScript, TypeScript, C, C++, Rust, Java, Scala, and WebAssembly programs from your browser — with AI-driven analysis through the Model Context Protocol.


Features
Web UI
- Real-time web UI — source viewer, breakpoints, variables (recursive expansion), call stack, console, timeline, watch expressions, findings — all updated live via WebSocket
- Multi-tab source viewer — open multiple files, click stack frames to navigate
- Variable search — filter variables by name with recursive expansion
- Changed-variable highlighting — variables that changed since last stop shown in orange
- Thread selector — switch between threads in multi-threaded programs
- Panel collapse & resize — drag to resize, toggle to collapse; Slim / Standard / Full layout presets
- Dark / light mode toggle
- Auto-reconnect — UI reconnects after a dropped WebSocket, with visual status indicator
- Keyboard shortcuts — F5 continue, F10 step over, F11 step in, Shift+F11 step out, Ctrl/Cmd+D dark mode
- Button animations — in-flight spinner and completion flash for debug commands
Debugging
- Multi-language — Python (debugpy), Node.js/TypeScript (js-debug), C/C++/Rust (lldb-dap), Java (java-debug), Scala (Metals), WebAssembly (lldb-dap), or any DAP adapter via
dap.json - Comprehensive DAP coverage — 35+ DAP requests: breakpoints, stepping, goto, memory read/write, disassembly, and more
- Breakpoints — conditional, logpoints, hit-count, function, data (watchpoints), exception, run-to-cursor (
continue_until) - Multi-session — debug multiple programs simultaneously, with child session routing (js-debug)
- Remote debugging — attach to debugpy, JDWP, or Node inspector running on another machine or container
LLM / MCP Integration
- 64 MCP tools — the full debug session exposed to Claude or any LLM
- Capability-gated tools — tools automatically shown/hidden based on adapter capabilities
- Compound tools —
get_debug_context(orient in one call),step_until,step_until_change,run_until_exception,explain_exception,get_call_tree,compare_snapshots,find_first_change - Execution timeline — every stop recorded with changed variables and stack summary
- Watch expressions — evaluated automatically at every breakpoint, manageable by LLM or UI
- Annotations & findings — pin notes to source lines, record conclusions visible in the UI
- Session export/import — save and restore debugging knowledge across sessions
CLI Control
- Full CLI — 13 subcommands to drive sessions from a second terminal without the web UI
- Auto-discovery — port file at
~/.debugium/port, session logs in~/.debugium/sessions/
Install
Claude Code Plugin (recommended)
/plugin marketplace add Algiras/debugium
/plugin install debugium@debugium
Then add to your project's .mcp.json (see MCP Tools below).
macOS / Linux binary
curl -fsSL https://raw.githubusercontent.com/Algiras/debugium/main/install.sh | bash
From source
# Prerequisites: Rust stable + wasm-pack
cargo install wasm-pack

# Build UI
wasm-pack build crates/debugium-ui --target web --out-dir pkg
cp crates/debugium-ui/pkg/cm_init.js         crates/debugium-ui/dist/pkg/
cp crates/debugium-ui/pkg/debugium_ui.js      crates/debugium-ui/dist/pkg/
cp crates/debugium-ui/pkg/debugium_ui_bg.wasm crates/debugium-ui/dist/pkg/

# Build & install server
cargo install --path crates/debugium-server
Usage
Debug a Python file
debugium launch my_script.py --adapter python
Debug a Node.js / TypeScript file
debugium launch app.js --adapter node
debugium launch app.ts --adapter typescript
Debug C / C++ / Rust
# C or C++ (compile with -g for debug info)
cc -g -O0 main.c -o main && debugium launch ./main --adapter lldb
c++ -g -O0 main.cpp -o main && debugium launch ./main --adapter lldb

# Rust
cargo build && debugium launch target/debug/my_binary --adapter lldb
Debug Java / Scala
# Java (requires microsoft/java-debug adapter)
debugium launch MainClass --adapter java

# Scala (connect to a running Metals DAP server)
debugium launch build-target --adapter metals
debugium launch build-target --adapter metals:5005  # custom port
Attach to a running process (remote debugging)
# Python (debugpy listening on port 5678)
debugium attach --port 5678 --adapter python

# Java (JDWP on port 5005)
debugium attach --port 5005 --adapter java

# Node.js (inspector on port 9229)
debugium attach --port 9229 --adapter node
Or via MCP: attach_session(port=5678, adapter="python", breakpoints=["/path/app.py:42"])
Use a custom adapter via dap.json
# Create a dap.json (see dap.json.example) then:
debugium launch my_program --config ./dap.json

# Or place dap.json in cwd / .debugium/ for auto-discovery:
debugium launch my_program   # finds ./dap.json automatically
Set initial breakpoints
debugium launch my_script.py --adapter python \
  --breakpoint /abs/path/my_script.py:42 \
  --breakpoint /abs/path/helpers.py:15
Enable LLM / MCP integration
Add a .mcp.json to your project root (Claude Code picks this up automatically):
{
  "mcpServers": {
    "debugium": {
      "command": "debugium",
      "args": ["mcp"]
    }
  }
}
Then launch the session normally — the MCP server connects to whichever port is active:
debugium launch my_script.py --adapter python --breakpoint /abs/path/my_script.py:42
Claude Code will now have access to all Debugium MCP tools. See CLAUDE.md for the recommended workflow and SKILL.md for the full tool reference.
CLI Control Commands
Once a session is running (debugium launch …), you can drive it from a second terminal — or from an LLM agent — without touching the web UI.
Port is auto-discovered from ~/.debugium/port; override with --port.
Global flags (all subcommands)
| Flag | Default | Description |
|---|---|---|
--port PORT |
~/.debugium/port |
Server port to connect to |
--session ID |
default |
Session to target |
--json |
off | Print raw JSON instead of human-readable output |
Inspection
debugium sessions                  # list active sessions
debugium threads                   # list threads
debugium stack                     # show call stack
debugium vars                      # show local variables (auto-resolves top frame)
debugium vars --frame-id 2         # show variables for a specific frame
debugium eval "len(fibs)"          # evaluate expression in top frame
debugium eval "x + 1" --frame-id 2
debugium source path/to/file.py    # print full source file
debugium source path/to/file.py --line 43  # windowed ±10 lines with → marker
debugium context                   # full snapshot: paused-at, stack, locals, source, breakpoints
debugium context --compact         # same but truncated (3 frames, 10 vars)
Breakpoints
debugium bp set FILE:LINE [FILE:LINE …]   # set breakpoints (replaces existing in that file)
debugium bp list                          # list all breakpoints
debugium bp clear                         # clear all breakpoints
Execution control
debugium continue                  # resume execution
debugium step over                 # step over (next line)
debugium step in                   # step into a function call
debugium step out                  # step out of current function
UI annotations (visible in the web UI)
debugium annotate FILE:LINE "message" [--color info|warning|error]
debugium finding "message"         [--level  info|warning|error]
Example workflow
# Terminal A — start the session
debugium launch tests/target_python.py --adapter python \
  --breakpoint "$(pwd)/tests/target_python.py:43"

# Terminal B (or LLM agent) — inspect and drive it
debugium sessions
debugium stack
debugium vars
debugium eval "len(fibs)"
debugium bp set tests/target_python.py:49
debugium continue                  # runs to line 49
debugium vars
debugium step over
debugium context --json            # machine-readable snapshot
debugium annotate tests/target_python.py:43 "called here" --color info
debugium finding "fibs has 10 elements" --level info
debugium bp clear
MCP Tools
When connected via MCP, 64 tools are available. Key ones:
| Category | Tools |
|---|---|
| Orient | get_debug_context ★ (paused location + locals + stack + source in one call) |
| Breakpoints | set_breakpoint, set_breakpoints, set_logpoint, list_breakpoints, clear_breakpoints, set_function_breakpoints, set_exception_breakpoints, set_data_breakpoint, list_data_breakpoints, clear_data_breakpoints, breakpoint_locations |
| Execution | continue_execution, step_over, step_in, step_out, pause, goto, disconnect, terminate, restart |
| Inspection | get_stack_trace, get_scopes, get_variables, evaluate, get_threads, get_source, get_capabilities, loaded_sources, source_by_reference, step_in_targets |
| Mutation | set_variable, set_expression |
| Output | get_console_output, wait_for_output (with from_line to avoid stale matches) |
| Memory | read_memory, write_memory, disassemble (native debugging) |
| History | get_timeline, get_variable_history, compare_snapshots, find_first_change |
| Annotations | annotate, get_annotations, add_finding, get_findings |
| Watches | add_watch, remove_watch, get_watches |
| Compound | step_until, step_until_change, continue_until, run_until_exception, explain_exception, get_call_tree, restart_frame |
| Session | get_sessions, list_sessions, launch_session, attach_session, stop_session, export_session, import_session |
| Control | goto_targets, cancel_request |
Note:
step_over,step_in, andstep_outare blocking — they wait for the adapter to pause before returning. Safe to chain back-to-back without sleeps.continue_executionreturnsconsole_line_countfor use withwait_for_output. Tools likeread_memory,goto, andrestart_frameonly appear when the adapter supports them.
See SKILL.md for the full reference with input schemas.
Keyboard Shortcuts
| Key | Action |
|---|---|
F5 |
Continue |
F10 |
Step Over |
F11 |
Step Into |
Shift+F11 |
Step Out |
Ctrl/⌘+D |
Toggle dark/light mode |
Architecture
debugium-server (Rust + Axum)
├── DAP proxy     — spawns / attaches to debug adapters (debugpy, js-debug, lldb-dap, java-debug, Metals, custom)
├── HTTP API      — /state, /sessions, /annotations, /findings, /watches, /timeline
├── WebSocket     — broadcasts DAP events + enriched stop data (changed vars, timeline) to UI
├── MCP stdio     — JSON-RPC 2.0 server exposing 64 tools for LLM integration
├── CLI control   — 13 subcommands to drive sessions from a second terminal
└── ~/.debugium/  — port file, session logs (events.ndjson), debug log

debugium-ui (Leptos + WASM)
├── CodeMirror 6  — source viewer with breakpoint gutters, exec arrow, LLM annotations, multi-tab
├── Reactive panels — Variables, Stack, Breakpoints, Findings, Watch, Timeline, Console (18 components)
└── WebSocket     — receives events, sends DAP commands, auto-reconnects with status indicator
Supported Languages & Adapters
| Language | --adapter flag |
Prerequisite | Verified |
|---|---|---|---|
| Python | python / debugpy |
pip install debugpy |
✅ |
| Node.js | node / js |
js-debug (bundled or build from vscode-js-debug) | ✅ |
| TypeScript | typescript / ts / tsx |
js-debug + tsx or ts-node in PATH |
✅ |
| C / C++ | lldb / codelldb |
lldb-dap (Xcode on macOS; apt install lldb on Linux) |
✅ |
| Rust | lldb / rust |
lldb-dap + cargo build |
✅ |
| Java | java / jvm |
microsoft/java-debug adapter JAR | ✅ |
| Scala | metals / scala |
Running Metals DAP server | ⚠️ (requires running Metals) |
| WebAssembly | wasm |
lldb-dap (LLVM ≥16) |
⚠️ (requires WASM-aware LLVM) |
| Any DAP adapter | --config dap.json |
See dap.json.example |
✅ |
Remote debugging
Connect to a DAP server running on another machine (or in a container):
{
  "adapterId": "debugpy",
  "request": "attach",
  "host": "192.168.1.100",
  "port": 5678,
  "pathMappings": [{ "localRoot": ".", "remoteRoot": "/app" }]
}
debugium launch app.py --config remote.json
License
MIT
Вопросы о debugium MCP
Как добавить debugium MCP в Claude Code?
Выполните claude mcp add debugium -- npx -y @algiras/debugium в терминале. Добавьте --scope user, чтобы сервер был доступен во всех проектах.
Как добавить debugium MCP в Cursor?
Откройте ~/.cursor/mcp.json и добавьте сервер в mcpServers, используя конфигурацию Cursor из раздела установки выше.
Какие языки программирования поддерживает Debugium?
Он поддерживает Python, JavaScript, TypeScript, C, C++, Rust, Java, Scala и WebAssembly.
Сколько доступно MCP инструментов?
Доступно 64 MCP инструмента, включая инструменты для установки точек остановки, управления выполнением, инспекции и мутации.
Могу ли я отлаживать процесс, запущенный на другой машине?
Да, вы можете использовать удаленную отладку для подключения к debugpy, JDWP или Node inspector, запущенным на другой машине или в контейнере.
Как включить интеграцию с LLM?
Вы можете включить её, добавив файл .mcp.json в корень вашего проекта, указав команду debugium с аргументом mcp.