
MCP server debugium
✓ VerificadoOferece um debugger multilíngue impulsionado por IA com uma interface web em tempo real e 64 ferramentas MCP para sessões de debugging integradas a LLMs.
Também conhecido como Algiras/debugium, @algiras/debugium
- Stars
- 4
- Ferramentas
- —
- Downloads, 30 dias
- 278
- Versão mais recente
- 1.0.0
- Último commit
- 16 de mar. de 2026
- Licença
- —
O que é o MCP debugium?
Oferece um debugger multilíngue impulsionado por IA com uma interface web em tempo real e 64 ferramentas MCP para sessões de debugging integradas a LLMs.
Resumo gerado a partir do README do projeto
Sobre o MCP server de debugium
O Debugium oferece um ambiente de debugging multilíngue projetado para desenvolvedores que desejam integrar inspeção profunda de código em fluxos de trabalho baseados em IA. Ele suporta uma ampla gama de linguagens, incluindo Python, JavaScript, TypeScript, C, C++, Rust, Java, Scala e WebAssembly, atuando como um proxy para diversos adaptadores do Debug Adapter Protocol. Os usuários podem interagir com suas sessões de debugging por meio de uma interface web em tempo real com visualizador de código-fonte, expansão de variáveis e call stack, ou via interface de linha de comando com 13 subcomandos.
O servidor foi construído para integração com LLM através do Model Context Protocol, expondo 64 ferramentas especializadas para clientes como o Claude. Essas ferramentas permitem que uma IA realize tarefas complexas, como avançar o código até que uma variável mude, explicar exceções ou comparar snapshots do estado do programa. Desenvolvedores podem executar sessões localmente ou se conectar a processos remotos rodando em containers ou outras máquinas. O sistema também suporta gerenciamento de múltiplas sessões e exportação/importação de sessões para preservar o conhecimento de debugging entre diferentes fluxos de trabalho.
O que você pode fazer com ele
- 1Monitoramento de mudança de estadoUm desenvolvedor pode instruir uma IA a executar o código até que o valor de uma variável específica seja modificado.
- 2Inspeção de processo remotoVocê pode conectar o debugger a um processo que já esteja rodando em uma máquina diferente ou dentro de um container.
- 3Snapshots de debugging contextualUm LLM pode recuperar todo o estado atual do programa, incluindo o código-fonte e variáveis locais, em uma única requisição.
Escrito a partir do README do projeto. Cada caso de uso é verificado com uma citação dele.
Como instalar o MCP debugium
Formatos verificados em 10 nov 2026Adicionar ao CursorAdicionar ao GooseInstalar o MCP debugium no Claude Code
$ claude mcp add debugium -- npx -y @algiras/debugiumInstalar o MCP debugium no Cursor
~/.cursor/mcp.json
{
  "mcpServers": {
    "debugium": {
      "command": "npx",
      "args": [
        "-y",
        "@algiras/debugium"
      ]
    }
  }
}Instalar o MCP debugium no VS Code
.vscode/mcp.json
{
  "servers": {
    "debugium": {
      "type": "stdio",
      "command": "npx",
      "args": [
        "-y",
        "@algiras/debugium"
      ]
    }
  }
}Instalar o MCP debugium no VS Code CLI
$ code --add-mcp '{"name":"debugium","type":"stdio","command":"npx","args":["-y","@algiras/debugium"]}'Instalar o MCP debugium no Claude Desktop
claude_desktop_config.json
{
  "mcpServers": {
    "debugium": {
      "command": "npx",
      "args": [
        "-y",
        "@algiras/debugium"
      ]
    }
  }
}Instalar o MCP debugium no Codex
$ codex mcp add debugium -- npx -y @algiras/debugiumInstalar o MCP debugium no Codex config.toml
~/.codex/config.toml
[mcp_servers.debugium]
command = "npx"
args = ["-y", "@algiras/debugium"]
Instalar o MCP debugium no Gemini CLI
$ gemini mcp add -s user debugium npx -- -y @algiras/debugiumInstalar o MCP debugium no Gemini settings.json
~/.gemini/settings.json
{
  "mcpServers": {
    "debugium": {
      "command": "npx",
      "args": [
        "-y",
        "@algiras/debugium"
      ]
    }
  }
}Verificações automatizadas
Executado em 15 de nov. de 2026Relatório completo →Passou em nossas verificações automatizadas. Isso não é uma auditoria de segurança: leia o código e dê ao servidor o acesso mais restrito de que ele precisa. Como as verificações funcionam · O que corrigir para ganhar mais pontos

- Repositório de origem vinculado e acessívelalgiras/debugium is public and reachablegithub.com/algiras/debugium ↗Passou
- O pacote indica este repositório como sua origem@algiras/debugium names algiras/debugium as sourcenpmjs.com/package/@algiras/debugium ↗Passou
- Proveniência da build (atestação Sigstore)No build attestation published for this releaseNão verificado
- Licença de código aberto (OSI)No licenseProblema encontrado
- Commit ou release no último anoLast commit or release 2026-03-16github.com/algiras/debugium ↗Passou
- OpenSSF ScorecardNão verificado
- Nome do pacote não é próximo a um pacote popularNo popular package one edit away from @algiras/debugiumPassou
- Nenhum aviso crítico no pacote ou em suas dependências1 resolved dependencies checked; no critical advisoryosv.dev ↗Passou
- Sem instruções ocultas para o modelo0 tool descriptions and the README read; no override phrases, credential paths or hidden charactersPassou
- Ferramentas destrutivas estão rotuladasNão verificado
- O endpoint remoto responde ao handshake do MCPNão verificado
README
Ver no GitHubDebugium
A multi-language debugger with a real-time web UI and LLM integration via MCP.
Debug Python, JavaScript, TypeScript, C, C++, Rust, Java, Scala, and WebAssembly programs from your browser — with AI-driven analysis through the Model Context Protocol.


Features
Web UI
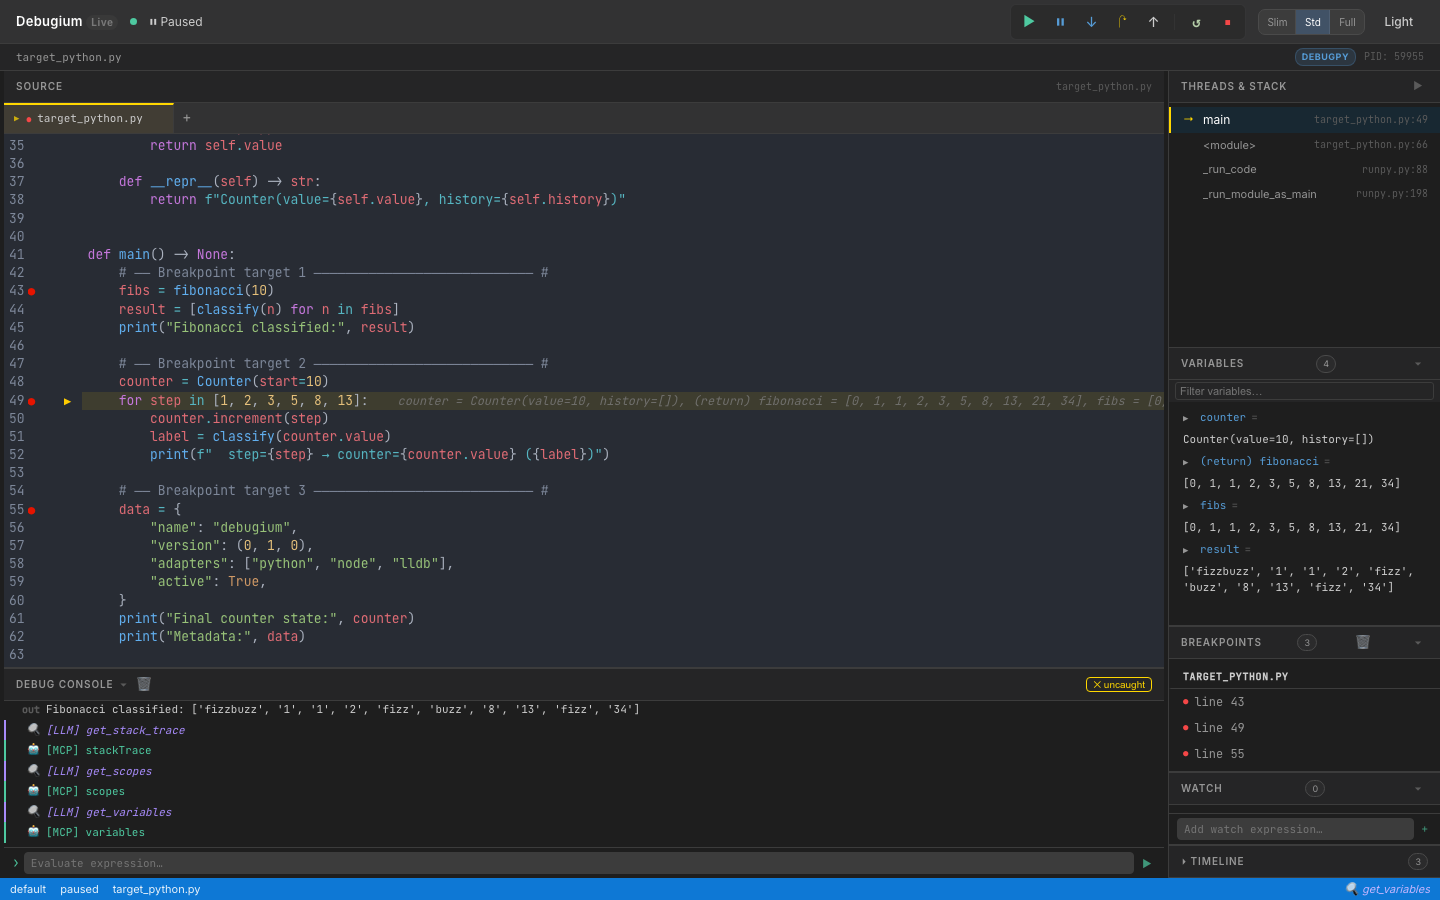
- Real-time web UI — source viewer, breakpoints, variables (recursive expansion), call stack, console, timeline, watch expressions, findings — all updated live via WebSocket
- Multi-tab source viewer — open multiple files, click stack frames to navigate
- Variable search — filter variables by name with recursive expansion
- Changed-variable highlighting — variables that changed since last stop shown in orange
- Thread selector — switch between threads in multi-threaded programs
- Panel collapse & resize — drag to resize, toggle to collapse; Slim / Standard / Full layout presets
- Dark / light mode toggle
- Auto-reconnect — UI reconnects after a dropped WebSocket, with visual status indicator
- Keyboard shortcuts — F5 continue, F10 step over, F11 step in, Shift+F11 step out, Ctrl/Cmd+D dark mode
- Button animations — in-flight spinner and completion flash for debug commands
Debugging
- Multi-language — Python (debugpy), Node.js/TypeScript (js-debug), C/C++/Rust (lldb-dap), Java (java-debug), Scala (Metals), WebAssembly (lldb-dap), or any DAP adapter via
dap.json - Comprehensive DAP coverage — 35+ DAP requests: breakpoints, stepping, goto, memory read/write, disassembly, and more
- Breakpoints — conditional, logpoints, hit-count, function, data (watchpoints), exception, run-to-cursor (
continue_until) - Multi-session — debug multiple programs simultaneously, with child session routing (js-debug)
- Remote debugging — attach to debugpy, JDWP, or Node inspector running on another machine or container
LLM / MCP Integration
- 64 MCP tools — the full debug session exposed to Claude or any LLM
- Capability-gated tools — tools automatically shown/hidden based on adapter capabilities
- Compound tools —
get_debug_context(orient in one call),step_until,step_until_change,run_until_exception,explain_exception,get_call_tree,compare_snapshots,find_first_change - Execution timeline — every stop recorded with changed variables and stack summary
- Watch expressions — evaluated automatically at every breakpoint, manageable by LLM or UI
- Annotations & findings — pin notes to source lines, record conclusions visible in the UI
- Session export/import — save and restore debugging knowledge across sessions
CLI Control
- Full CLI — 13 subcommands to drive sessions from a second terminal without the web UI
- Auto-discovery — port file at
~/.debugium/port, session logs in~/.debugium/sessions/
Install
Claude Code Plugin (recommended)
/plugin marketplace add Algiras/debugium
/plugin install debugium@debugium
Then add to your project's .mcp.json (see MCP Tools below).
macOS / Linux binary
curl -fsSL https://raw.githubusercontent.com/Algiras/debugium/main/install.sh | bash
From source
# Prerequisites: Rust stable + wasm-pack
cargo install wasm-pack

# Build UI
wasm-pack build crates/debugium-ui --target web --out-dir pkg
cp crates/debugium-ui/pkg/cm_init.js         crates/debugium-ui/dist/pkg/
cp crates/debugium-ui/pkg/debugium_ui.js      crates/debugium-ui/dist/pkg/
cp crates/debugium-ui/pkg/debugium_ui_bg.wasm crates/debugium-ui/dist/pkg/

# Build & install server
cargo install --path crates/debugium-server
Usage
Debug a Python file
debugium launch my_script.py --adapter python
Debug a Node.js / TypeScript file
debugium launch app.js --adapter node
debugium launch app.ts --adapter typescript
Debug C / C++ / Rust
# C or C++ (compile with -g for debug info)
cc -g -O0 main.c -o main && debugium launch ./main --adapter lldb
c++ -g -O0 main.cpp -o main && debugium launch ./main --adapter lldb

# Rust
cargo build && debugium launch target/debug/my_binary --adapter lldb
Debug Java / Scala
# Java (requires microsoft/java-debug adapter)
debugium launch MainClass --adapter java

# Scala (connect to a running Metals DAP server)
debugium launch build-target --adapter metals
debugium launch build-target --adapter metals:5005  # custom port
Attach to a running process (remote debugging)
# Python (debugpy listening on port 5678)
debugium attach --port 5678 --adapter python

# Java (JDWP on port 5005)
debugium attach --port 5005 --adapter java

# Node.js (inspector on port 9229)
debugium attach --port 9229 --adapter node
Or via MCP: attach_session(port=5678, adapter="python", breakpoints=["/path/app.py:42"])
Use a custom adapter via dap.json
# Create a dap.json (see dap.json.example) then:
debugium launch my_program --config ./dap.json

# Or place dap.json in cwd / .debugium/ for auto-discovery:
debugium launch my_program   # finds ./dap.json automatically
Set initial breakpoints
debugium launch my_script.py --adapter python \
  --breakpoint /abs/path/my_script.py:42 \
  --breakpoint /abs/path/helpers.py:15
Enable LLM / MCP integration
Add a .mcp.json to your project root (Claude Code picks this up automatically):
{
  "mcpServers": {
    "debugium": {
      "command": "debugium",
      "args": ["mcp"]
    }
  }
}
Then launch the session normally — the MCP server connects to whichever port is active:
debugium launch my_script.py --adapter python --breakpoint /abs/path/my_script.py:42
Claude Code will now have access to all Debugium MCP tools. See CLAUDE.md for the recommended workflow and SKILL.md for the full tool reference.
CLI Control Commands
Once a session is running (debugium launch …), you can drive it from a second terminal — or from an LLM agent — without touching the web UI.
Port is auto-discovered from ~/.debugium/port; override with --port.
Global flags (all subcommands)
| Flag | Default | Description |
|---|---|---|
--port PORT |
~/.debugium/port |
Server port to connect to |
--session ID |
default |
Session to target |
--json |
off | Print raw JSON instead of human-readable output |
Inspection
debugium sessions                  # list active sessions
debugium threads                   # list threads
debugium stack                     # show call stack
debugium vars                      # show local variables (auto-resolves top frame)
debugium vars --frame-id 2         # show variables for a specific frame
debugium eval "len(fibs)"          # evaluate expression in top frame
debugium eval "x + 1" --frame-id 2
debugium source path/to/file.py    # print full source file
debugium source path/to/file.py --line 43  # windowed ±10 lines with → marker
debugium context                   # full snapshot: paused-at, stack, locals, source, breakpoints
debugium context --compact         # same but truncated (3 frames, 10 vars)
Breakpoints
debugium bp set FILE:LINE [FILE:LINE …]   # set breakpoints (replaces existing in that file)
debugium bp list                          # list all breakpoints
debugium bp clear                         # clear all breakpoints
Execution control
debugium continue                  # resume execution
debugium step over                 # step over (next line)
debugium step in                   # step into a function call
debugium step out                  # step out of current function
UI annotations (visible in the web UI)
debugium annotate FILE:LINE "message" [--color info|warning|error]
debugium finding "message"         [--level  info|warning|error]
Example workflow
# Terminal A — start the session
debugium launch tests/target_python.py --adapter python \
  --breakpoint "$(pwd)/tests/target_python.py:43"

# Terminal B (or LLM agent) — inspect and drive it
debugium sessions
debugium stack
debugium vars
debugium eval "len(fibs)"
debugium bp set tests/target_python.py:49
debugium continue                  # runs to line 49
debugium vars
debugium step over
debugium context --json            # machine-readable snapshot
debugium annotate tests/target_python.py:43 "called here" --color info
debugium finding "fibs has 10 elements" --level info
debugium bp clear
MCP Tools
When connected via MCP, 64 tools are available. Key ones:
| Category | Tools |
|---|---|
| Orient | get_debug_context ★ (paused location + locals + stack + source in one call) |
| Breakpoints | set_breakpoint, set_breakpoints, set_logpoint, list_breakpoints, clear_breakpoints, set_function_breakpoints, set_exception_breakpoints, set_data_breakpoint, list_data_breakpoints, clear_data_breakpoints, breakpoint_locations |
| Execution | continue_execution, step_over, step_in, step_out, pause, goto, disconnect, terminate, restart |
| Inspection | get_stack_trace, get_scopes, get_variables, evaluate, get_threads, get_source, get_capabilities, loaded_sources, source_by_reference, step_in_targets |
| Mutation | set_variable, set_expression |
| Output | get_console_output, wait_for_output (with from_line to avoid stale matches) |
| Memory | read_memory, write_memory, disassemble (native debugging) |
| History | get_timeline, get_variable_history, compare_snapshots, find_first_change |
| Annotations | annotate, get_annotations, add_finding, get_findings |
| Watches | add_watch, remove_watch, get_watches |
| Compound | step_until, step_until_change, continue_until, run_until_exception, explain_exception, get_call_tree, restart_frame |
| Session | get_sessions, list_sessions, launch_session, attach_session, stop_session, export_session, import_session |
| Control | goto_targets, cancel_request |
Note:
step_over,step_in, andstep_outare blocking — they wait for the adapter to pause before returning. Safe to chain back-to-back without sleeps.continue_executionreturnsconsole_line_countfor use withwait_for_output. Tools likeread_memory,goto, andrestart_frameonly appear when the adapter supports them.
See SKILL.md for the full reference with input schemas.
Keyboard Shortcuts
| Key | Action |
|---|---|
F5 |
Continue |
F10 |
Step Over |
F11 |
Step Into |
Shift+F11 |
Step Out |
Ctrl/⌘+D |
Toggle dark/light mode |
Architecture
debugium-server (Rust + Axum)
├── DAP proxy     — spawns / attaches to debug adapters (debugpy, js-debug, lldb-dap, java-debug, Metals, custom)
├── HTTP API      — /state, /sessions, /annotations, /findings, /watches, /timeline
├── WebSocket     — broadcasts DAP events + enriched stop data (changed vars, timeline) to UI
├── MCP stdio     — JSON-RPC 2.0 server exposing 64 tools for LLM integration
├── CLI control   — 13 subcommands to drive sessions from a second terminal
└── ~/.debugium/  — port file, session logs (events.ndjson), debug log

debugium-ui (Leptos + WASM)
├── CodeMirror 6  — source viewer with breakpoint gutters, exec arrow, LLM annotations, multi-tab
├── Reactive panels — Variables, Stack, Breakpoints, Findings, Watch, Timeline, Console (18 components)
└── WebSocket     — receives events, sends DAP commands, auto-reconnects with status indicator
Supported Languages & Adapters
| Language | --adapter flag |
Prerequisite | Verified |
|---|---|---|---|
| Python | python / debugpy |
pip install debugpy |
✅ |
| Node.js | node / js |
js-debug (bundled or build from vscode-js-debug) | ✅ |
| TypeScript | typescript / ts / tsx |
js-debug + tsx or ts-node in PATH |
✅ |
| C / C++ | lldb / codelldb |
lldb-dap (Xcode on macOS; apt install lldb on Linux) |
✅ |
| Rust | lldb / rust |
lldb-dap + cargo build |
✅ |
| Java | java / jvm |
microsoft/java-debug adapter JAR | ✅ |
| Scala | metals / scala |
Running Metals DAP server | ⚠️ (requires running Metals) |
| WebAssembly | wasm |
lldb-dap (LLVM ≥16) |
⚠️ (requires WASM-aware LLVM) |
| Any DAP adapter | --config dap.json |
See dap.json.example |
✅ |
Remote debugging
Connect to a DAP server running on another machine (or in a container):
{
  "adapterId": "debugpy",
  "request": "attach",
  "host": "192.168.1.100",
  "port": 5678,
  "pathMappings": [{ "localRoot": ".", "remoteRoot": "/app" }]
}
debugium launch app.py --config remote.json
License
MIT
Perguntas sobre o MCP debugium
Como adiciono o MCP debugium ao Claude Code?
Execute claude mcp add debugium -- npx -y @algiras/debugium no seu terminal. Adicione --scope user para torná-lo disponível em todos os projetos.
Como adiciono o MCP debugium ao Cursor?
Abra ~/.cursor/mcp.json e adicione o servidor em mcpServers, usando a configuração do Cursor mostrada na seção de instalação acima.
Quais linguagens de programação o Debugium suporta?
Ele suporta Python, JavaScript, TypeScript, C, C++, Rust, Java, Scala e WebAssembly.
Quantas ferramentas MCP estão disponíveis?
Estão disponíveis 64 ferramentas MCP, incluindo ferramentas para breakpoints, controle de execução, inspeção e mutação.
Posso debugar um processo rodando em outra máquina?
Sim, você pode usar o debugging remoto para se conectar ao debugpy, JDWP ou Node inspector rodando em outra máquina ou container.
Como eu habilito a integração com LLM?
Você pode habilitá-la adicionando um .mcp.json na raiz do seu projeto que especifique o comando debugium com o argumento mcp.