
PerformanceMonitor MCP server
Commit 15 Nov 2026Memungkinkan AI client untuk melakukan query pada data performa SQL Server dan PostgreSQL, alert, serta execution plan untuk keperluan analisis.
Juga dikenal sebagai erikdarlingdata/PerformanceMonitor
- Stars
- 536
- Tools
- —
- Unduhan, 30 hari
- —
- Versi terbaru
- —
- Commit terakhir
- 15 Nov 2026
- Lisensi
- MIT
Apa itu PerformanceMonitor MCP?
PerformanceMonitor adalah MCP server. Memungkinkan AI client untuk melakukan query pada data performa SQL Server dan PostgreSQL, alert, serta execution plan untuk keperluan analisis.
Ringkasan dibuat dari README proyek
Tentang PerformanceMonitor MCP server
PerformanceMonitor memungkinkan database administrator dan developer untuk menganalisis data performa SQL Server dan PostgreSQL langsung dari dalam AI client. Dengan menghubungkan AI agent ke MCP server bawaan, pengguna dapat melakukan query pada metrik performa yang telah dikumpulkan, alert real-time, dan execution plan untuk mendiagnosis masalah database. Sistem ini menawarkan dua cara operasional yang berbeda: Lite, yaitu aplikasi desktop tunggal untuk monitoring on-demand jarak jauh menggunakan file DuckDB dan Parquet lokal, serta Darling, sebuah service untuk pengumpulan data berkelanjutan 24/7 ke dalam penyimpanan PostgreSQL terpusat.
Tergantung pada edisi yang digunakan, AI agent dapat melakukan lebih dari sekadar membaca laporan. Jika Lite berfokus pada investigasi, edisi Darling memungkinkan agent untuk mengambil tindakan dengan mengubah pengaturan alert, melakukan force atau unforce pada Query Store plans, merecompile module, atau bahkan melakukan kill pada session. Semua tindakan bergantung pada switch yang diaktifkan oleh pengguna untuk memastikan kontrol tetap terjaga. Setup ini bekerja di berbagai lingkungan termasuk server on-premises, Azure SQL Managed Instance, AWS RDS, dan berbagai versi PostgreSQL.
Apa yang bisa Anda lakukan dengannya
- 1Remediasi masalah database secara otomatisSeorang developer dapat memberikan tugas kepada AI untuk mengelola execution plans atau menghentikan session yang bermasalah.
- 2Mengelola konfigurasi alert databasePengguna dapat menggunakan AI client untuk menyesuaikan bagaimana sistem monitoring memberikan notifikasi terkait masalah yang terjadi.
Ditulis berdasarkan README proyek. Setiap use case diperiksa terhadap kutipan dari README tersebut.
Pengecekan otomatis
Berjalan 14 Nov 2026Laporan lengkap →Belum diverifikasi. Sebuah server memerlukan skor 80, tidak ada temuan serius, dan data yang cukup untuk kami periksa. Cara kerja checks · Yang perlu diperbaiki untuk menambah poin

- Source repository terhubung dan dapat dijangkauerikdarlingdata/performancemonitor is public and reachablegithub.com/erikdarlingdata/performancemonitor ↗Lolos
- Nama paket mencantumkan repositori ini sebagai sumbernyaTidak diperiksa
- Provenance build (atestasi Sigstore)Tidak diperiksa
- Lisensi open source (OSI)MITspdx.org/licenses/MIT.html ↗Lolos
- Ada commit atau release dalam satu tahun terakhirLast commit or release 2026-11-13github.com/erikdarlingdata/performancemonitor ↗Lolos
- OpenSSF ScorecardTidak diperiksa
- Nama package tidak mirip dengan package populerTidak diperiksa
- Tidak ada advisory kritis pada paket atau dependensinyaTidak diperiksa
- Tidak ada instruksi tersembunyi untuk model0 tool descriptions and the README read; no override phrases, credential paths or hidden charactersLolos
- Tools yang bersifat destruktif telah diberi labelTidak diperiksa
- Endpoint remote merespons handshake MCPTidak diperiksa
README
Lihat di GitHubSQL Server Performance Monitor
Free, open-source monitoring that replaces the tools charging you thousands per server per year. It includes specialized collectors, real-time alerts, and a built-in MCP server for AI analysis. Nothing phones home. Your data stays on your server and your machine.
If you pay for a monitoring tool now, read the comparison for yours.
Redgate SQL Monitor · SQL Sentry · SolarWinds DPA · Idera SQL Diagnostic Manager · Quest Spotlight · Datadog Database Monitoring · Database Health Monitor
It supports SQL Server 2016 SP2 to 2025. SQL Server 2017 needs CU3 or later. It also supports Azure SQL Managed Instance, AWS RDS for SQL Server, and Azure SQL Database (Lite and Darling). Darling also monitors PostgreSQL. It supports PostgreSQL 14 to 18, plus Amazon RDS, Aurora and Azure Database for PostgreSQL, and makes a best effort on PostgreSQL 10 to 13. See Supported PostgreSQL versions.
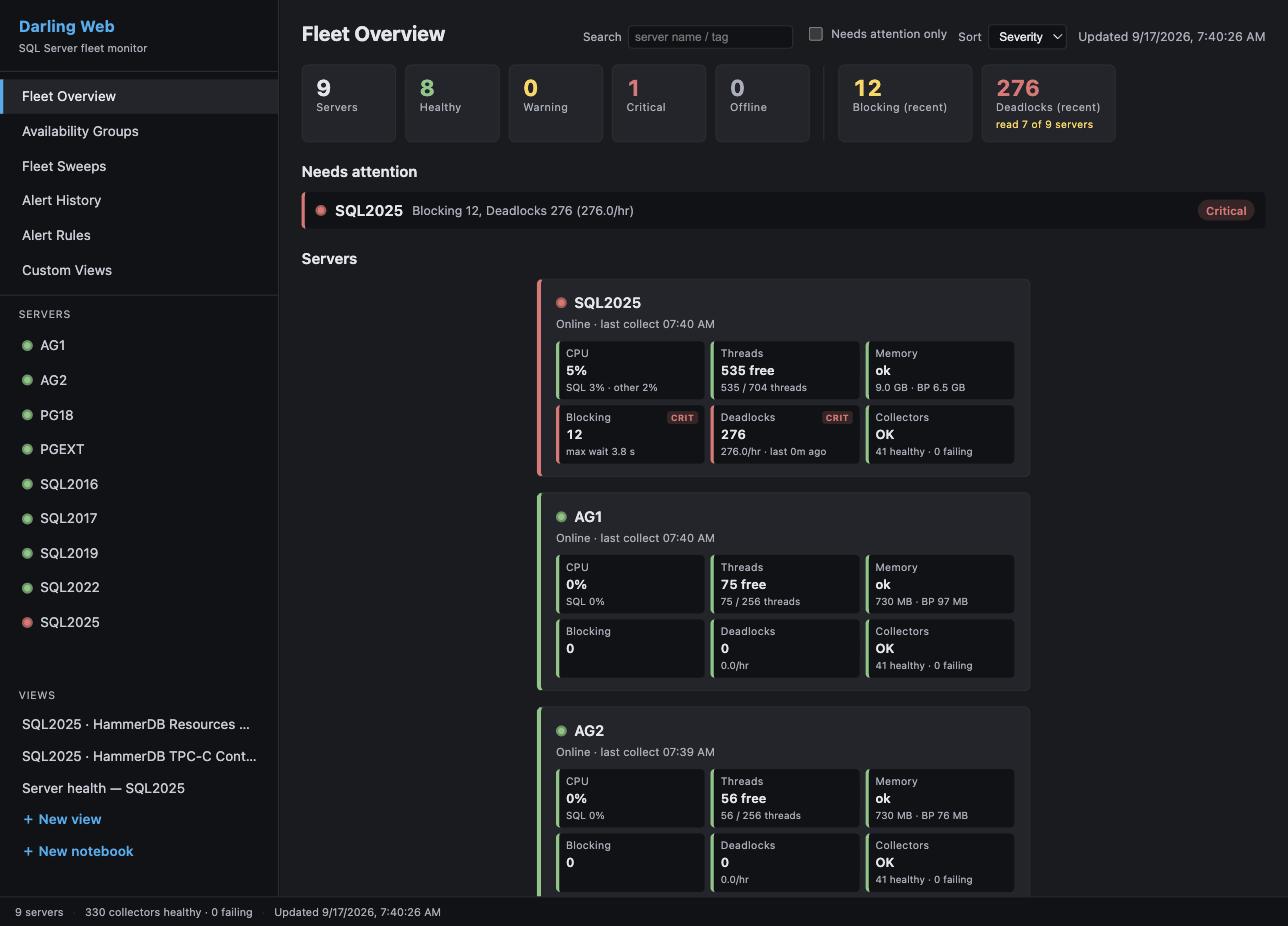
Editions
- Lite is a single desktop app that monitors your servers remotely, on demand. Nothing is installed on your server. It stores data in local DuckDB and Parquet files.
- Darling is a service on Windows or Linux that collects 24/7 into a central PostgreSQL store. The Windows viewer and the web dashboard read that store from any seat.
Both editions can hand an alert to an AI agent that you run, and Lite lets the agent read and report. Darling can also let it change alert settings (mutes, custom alert rules and thresholds). On a server, it can force or unforce a Query Store plan or evict a cached plan. It can recompile a module, create or drop a plan guide, or kill a session. Each of these has its own switch per server, and all are off until you turn them on. Darling records every change. A person can undo alert-setting changes, plan forces and plan guide changes. A plan eviction, a recompile or a session kill cannot be undone. Agent dispatch explains the levels.
The Dashboard edition is deprecated. Existing installs keep working, but we recommend Lite or Darling for new deployments. Choosing an edition compares all three.
Each release ships these downloads. For Lite, a Setup.exe and a portable ZIP. For Darling, the service ZIP (with the viewer inside), a Viewer Setup.exe for a remote seat, and the Linux and Compose tarballs. The Full Dashboard and its CLI installer ship nothing. Their last builds are in the v3.2.0 release.
Not sure which one? Start with Lite. It is one download, nothing is installed on your server, and data starts to flow in under 5 minutes.
Quick start: Lite
- Download
PerformanceMonitorLite-lite-Setup.exe. It is a self-contained build, so you do not install a .NET runtime first. - Run the installer. It adds Start Menu and Desktop shortcuts.
- Start Lite from the Start Menu or the Desktop shortcut.
- Click + Add Server, enter the connection details, test, and save.
- Double-click the server in the sidebar to connect.
Data starts to flow within 1 to 5 minutes. The monitoring login needs VIEW SERVER STATE (Permissions).
Before you upgrade an older install with Setup.exe, read the warning in the Lite guide. On versions older than 3.4.0, Setup.exe deletes the data in the install directory (see Upgrading an install older than 3.4.0). The Lite guide also covers the portable ZIP, collectors, storage, and configuration.
Quick start: Darling
- Download
PerformanceMonitorDarling-<version>.zipandSHA256SUMS.txtfrom the latest release. Check the zip hash againstSHA256SUMS.txt. The zip carries its own .NET runtime, so there is nothing to install first. - Extract the zip to
C:\Program Files\PerformanceMonitorDarling. Do not use your Desktop, Downloads, or any folder underC:\Users\. The service runs as a virtual account that cannot read a user profile (why). - Double-click
Install-Darling.cmdin the install folder. It asks Windows for administrator rights and runsinstall-darling.ps1. You can also run.\install-darling.ps1from an elevated PowerShell. It installs the Windows service and creates a Darling Viewer shortcut. With nodarling.jsonit writes a minimal one, and the service starts with no monitored servers. - Wait about two minutes for the first start, then open Darling Viewer. It opens on the fleet.
- Add your first server in the viewer.
darling.jsonis only a seed. The service reads it on its first start, so a server added to the file later is ignored (why). - The service log is in
%ProgramData%\PerformanceMonitorDarling\logs.
Install Darling gives each step with the log line or screen that proves it worked. To upgrade, run upgrade-darling.ps1. To remove the service, run uninstall-darling.ps1. Both are in the install folder. For Linux and the web dashboard, read the Darling quick start. The Darling operator guide is the configuration reference.
Documentation
| Page | What it covers |
|---|---|
| Choosing an edition | Lite, Darling, and Dashboard side by side |
| Features and screenshots | What you get, with screenshots |
| Lite guide | Install, upgrade, where Lite keeps its files, configuration, appearance, collectors |
| Lite Extended Events sessions | The sessions Lite creates on a monitored server, and how to remove them |
| Darling quick start | Install on Windows, Linux notes, web dashboard |
| Darling operator guide | Darling configuration, permissions, operations |
| Darling store sizing | Disk, RAM and vCPU for a store host, by number of servers |
| Back up, restore and move the store | Back up a Darling store, restore it, or move it to another machine |
| Darling guides | Install, viewer, web dashboard, MCP, day-to-day admin and command line reference |
| PostgreSQL target runbook | Point Darling at a PostgreSQL target, with a proof point at each step |
| Retention Held runbook | Clear a Retention Held alert |
| How collection works | A tour of the collection pipeline, for people who read the code |
| Documentation index | Every page in docs/, grouped by audience |
| Tabs | What each tab shows |
| Alerts and notifications | Alert types, channels, routes, email |
| Agent dispatch | Hand an alert to your own AI agent: levels, the brief and report, undo, the remediation login |
| Signed webhooks | Verify that a generic webhook post came from Darling |
| Agent job monitoring | Running SQL Agent jobs and jobs that run longer than expected |
| MCP server | Setup, the tool list and the Lite investigation tools for AI analysis |
| Authentication | Authentication types and credential profiles |
| Permissions | Grants for on-premises, Azure, and AWS RDS. The optional agent remediation login is in Agent dispatch |
| Platform notes | AWS RDS and Aurora configuration |
| Performance impact | Load on monitored servers, and local resources for Lite |
| Troubleshooting | Common problems for Lite and Darling |
| Building from source | Folder structure and build commands |
| Support and sponsorship | Commercial support tiers and sponsorship |
| Third-party components | Third-party components and their licenses |
| Changelog | Changes in each release |
Support
Performance Monitor is free and open source under the MIT License, with no features withheld. The tools that it replaces charge thousands of dollars per server per year. A support subscription covers all of your SQL Server instances.
| Tier | Cost per year | Email response | Includes |
|---|---|---|---|
| Supported | $500 | Within 2 business days | Guaranteed compatibility updates for new SQL Server versions, priority feature requests, a support agreement and invoices, unlimited instances |
| Priority | $2,500 | By the next business day | Everything in Supported, plus a quarterly live Q&A session, early access to new features, and direct input on the roadmap |
Support and sponsorship says what support gets you and has the link to buy. You can also sponsor on GitHub.
Sponsors
License
Copyright (c) 2026 Darling Data, LLC. Licensed under the MIT License. See LICENSE for details.
Author
Erik Darling: erikdarling.com and Darling Data, LLC
Pertanyaan tentang PerformanceMonitor MCP
Database apa saja yang bisa dimonitor oleh PerformanceMonitor?
PerformanceMonitor memonitor SQL Server 2016 SP2 hingga 2025, Azure SQL Managed Instance, AWS RDS for SQL Server, dan PostgreSQL 14 hingga 18 termasuk RDS, Aurora, dan Azure Database for PostgreSQL.
Apakah AI agent memerlukan izin khusus untuk mengubah pengaturan alert?
AI agent hanya akan memiliki kemampuan tersebut jika Anda mengaktifkannya per server; semua switch seperti itu dalam kondisi mati secara default dan setiap perubahan akan dicatat.
Edisi apa saja yang ditawarkan oleh PerformanceMonitor?
Ada dua edisi utama: Lite, sebuah aplikasi desktop tunggal yang menyimpan data secara lokal, dan Darling, sebuah service yang mengumpulkan data 24/7 ke dalam penyimpanan PostgreSQL terpusat.
Apakah PerformanceMonitor gratis?
Ya, ini gratis dan open source di bawah MIT License tanpa ada fitur yang dikurangi; langganan dukungan berbayar bersifat opsional.
Bagaimana cara memulai dengan PerformanceMonitor?
Mulailah dengan Lite: cukup satu kali download, tidak ada yang perlu diinstall di server Anda, dan data akan mulai mengalir dalam beberapa menit.