
Permite que los agentes de programación reproduzcan fallos intermitentes en las pruebas, minimicen los inputs de reproducción y verifiquen correcciones de código con evidencia empírica.
También conocido como LBarimi/FailTrace
- Stars
- 0
- Herramientas
- —
- Descargas, 30 días
- —
- Última versión
- 1.5.0
- Último commit
- 7 sept 2026
- Licencia
- MIT
¿Qué es FailTrace MCP?
Permite que los agentes de programación reproduzcan fallos intermitentes en las pruebas, minimicen los inputs de reproducción y verifiquen correcciones de código con evidencia empírica.
Resumen generado a partir del README del proyecto
Acerca del MCP server de FailTrace
FailTrace ofrece una forma para que los agentes de programación gestionen fallos intermitentes en las pruebas mediante la creación de evidencia empírica para el debugging. Funciona a través de un MCP server local por stdio o mediante una CLI, lo que permite a los desarrolladores capturar una línea base de fallo, minimizar los inputs de reproducción y verificar parches de código. La herramienta se ejecuta localmente en tu máquina usando Node.js 22.12+ y npm, lo que significa que no requiere APIs de IA externas, cuentas ni telemetría para funcionar.
Los agentes pueden utilizar siete herramientas MCP específicas para gestionar el ciclo de vida de la investigación, incluyendo la búsqueda de regresiones, la minimización y la verificación. El sistema realiza un seguimiento de las firmas de error y de la evidencia de investigación a través de múltiples intentos. Es compatible con los test runners y assertions existentes, incluyendo soporte específico para NUnit y pruebas de Unity EditMode. Para evitar la acumulación excesiva de datos, el servidor limita el stdout y stderr retenidos a 16 MiB por intento y 256 MiB por proceso de ejecución o minimización.
Qué puedes hacer con él
- 1Minimizar inputs de reproducciónUn agente puede reducir un conjunto complejo de inputs al conjunto de datos más pequeño posible necesario para activar un fallo de prueba específico.
- 2Verificar parches de códigoUn desarrollador puede usar la herramienta para comprobar si una corrección propuesta realmente resuelve el fallo objetivo en comparación con una línea base guardada.
- 3Identificar fuentes de regresiónEl sistema puede ayudar a encontrar qué cambio específico en Git introdujo una prueba fallida mediante un proceso de bisect.
- 4Capturar fallos intermitentesLos usuarios pueden ejecutar un comando para repetir una prueba varias veces y así capturar una firma de fallo consistente.
Escrito a partir del README del proyecto. Cada caso de uso se verifica con una cita del mismo.
Cómo instalar FailTrace MCP
Formatos verificados el 10 nov 2026Añadir a CursorAñadir a GooseInstalar FailTrace MCP en Claude Code
$ claude mcp add failtrace -- npx -y failtraceInstalar FailTrace MCP en Cursor
~/.cursor/mcp.json
{
  "mcpServers": {
    "failtrace": {
      "command": "npx",
      "args": [
        "-y",
        "failtrace"
      ]
    }
  }
}Instalar FailTrace MCP en VS Code
.vscode/mcp.json
{
  "servers": {
    "failtrace": {
      "type": "stdio",
      "command": "npx",
      "args": [
        "-y",
        "failtrace"
      ]
    }
  }
}Instalar FailTrace MCP en VS Code CLI
$ code --add-mcp '{"name":"failtrace","type":"stdio","command":"npx","args":["-y","failtrace"]}'Instalar FailTrace MCP en Claude Desktop
claude_desktop_config.json
{
  "mcpServers": {
    "failtrace": {
      "command": "npx",
      "args": [
        "-y",
        "failtrace"
      ]
    }
  }
}Instalar FailTrace MCP en Codex
$ codex mcp add failtrace -- npx -y failtraceInstalar FailTrace MCP en Codex config.toml
~/.codex/config.toml
[mcp_servers.failtrace]
command = "npx"
args = ["-y", "failtrace"]
Instalar FailTrace MCP en Gemini CLI
$ gemini mcp add -s user failtrace npx -- -y failtraceInstalar FailTrace MCP en Gemini settings.json
~/.gemini/settings.json
{
  "mcpServers": {
    "failtrace": {
      "command": "npx",
      "args": [
        "-y",
        "failtrace"
      ]
    }
  }
}Verificaciones automáticas
Ejecutado 15 nov 2026Informe completo →Pasó nuestras verificaciones automáticas. Esto no es una auditoría de seguridad: lee el código y dale al servidor el acceso más limitado que necesite. Cómo funcionan las verificaciones

- Repositorio de origen vinculado y accesiblelbarimi/failtrace is public and reachablegithub.com/lbarimi/failtrace ↗Aprobado
- El paquete indica este repositorio como su origenfailtrace names lbarimi/failtrace as sourcenpmjs.com/package/failtrace ↗Aprobado
- Procedencia de la compilación (atestación de Sigstore)No build attestation published for this releaseNo verificado
- Licencia de código abierto (OSI)MITspdx.org/licenses/MIT.html ↗Aprobado
- Commit o lanzamiento en el último añoLast commit or release 2026-09-07github.com/lbarimi/failtrace ↗Aprobado
- OpenSSF ScorecardNo verificado
- El nombre del paquete no es similar a un paquete popularNo popular package one edit away from failtraceAprobado
- No hay avisos críticos en el paquete ni en sus dependencias6 resolved dependencies checked; no critical advisoryosv.dev ↗Aprobado
- Sin instrucciones ocultas para el modelo0 tool descriptions and the README read; no override phrases, credential paths or hidden charactersAprobado
- Las herramientas destructivas están etiquetadasNo verificado
- El endpoint remoto responde al handshake de MCPNo verificado
README
Ver en GitHubFailTrace
Reproduce the failure. Check the fix.
A test fails intermittently. Your coding agent changes the code. One passing retry leaves you guessing.
FailTrace repeats the same check, saves a failing baseline, and checks the proposed fix against it. Use the CLI or MCP tools to get trial results, a smaller reproducer, and evidence your agent can inspect before accepting a patch.


Local execution. No AI API, account, or telemetry required. Keep your existing test runner and assertions.
Quick start
With Node.js 22.12+ and npm, run this in any working directory:
npx --yes failtrace demo
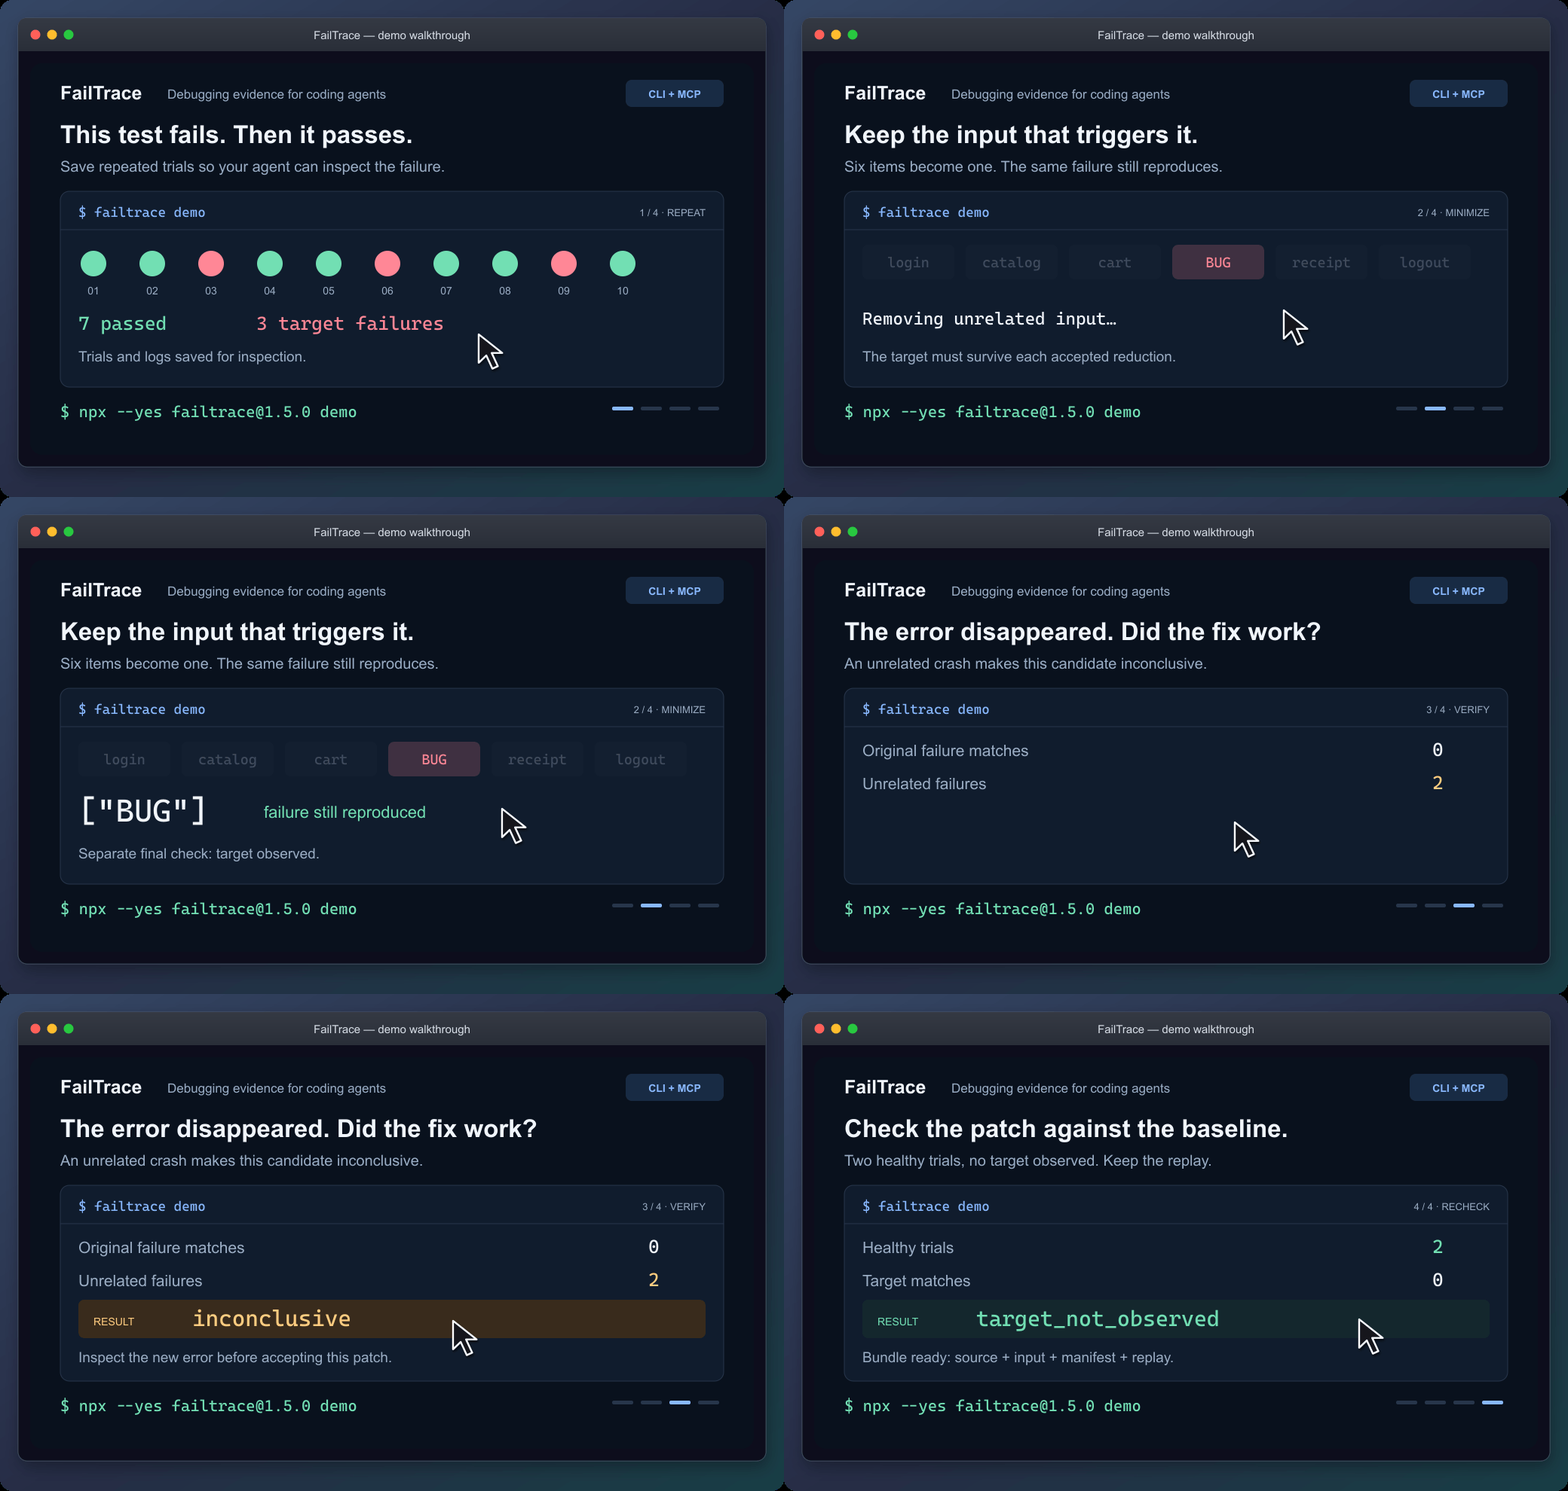
Static walkthrough · Static poster · Demo guide
The demo reduces six input items to ["BUG"], rejects a patch that crashes for another reason, and checks a working patch. It saves the evidence in .failtrace/ and prints a replay command.
For coding agents
Connect the local stdio MCP server through your client's configuration:
npx --yes failtrace@1.5.0 mcp --cwd "/absolute/path/to/your/project"
Copy the MCP configuration and check the connection →
Your client launches this command. Running it alone in a terminal waits for MCP requests. The guide includes Windows setup.
Then ask your agent:
Use FailTrace to capture this test failure before editing. Choose the exact test or failure message, save a bounded baseline, and inspect the matching trial. After the change, verify against that baseline and explain any unrelated errors or incomplete evidence.
The seven MCP tools share the CLI's Core engine. They retain the failure signature and investigation evidence across repetition, comparison, regression search, minimization, verification and replay. Agents can retrieve saved trial and log pages without rerunning the command. Shell-capable agents can also use the CLI with --json.
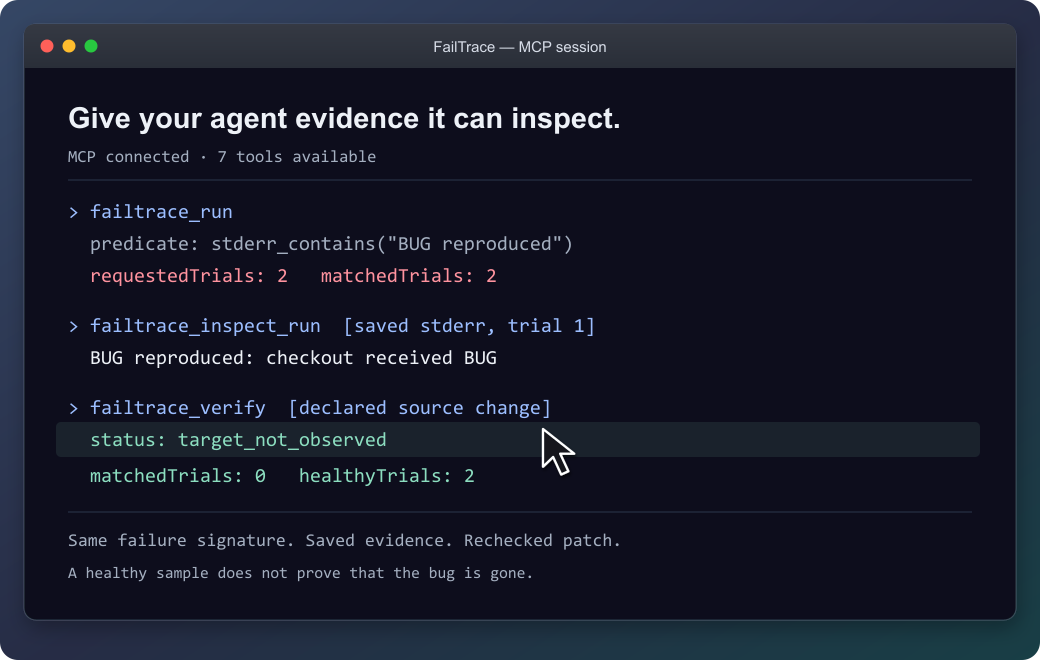
The agent can inspect the saved failure before checking the patch.
Recheck an existing unit test
Follow an exact NUnit or Unity test through a fix. Each attempt gets a fresh NUnit 3 report. Missing or skipped tests and unrelated failures stay inconclusive, so an agent cannot accept them as evidence that the selected test passed.
Connect your test or try the original EditMode example →
NUnit support is included in 1.3.0 through CLI and MCP. The documented Unity validation covers the Windows EditMode example.
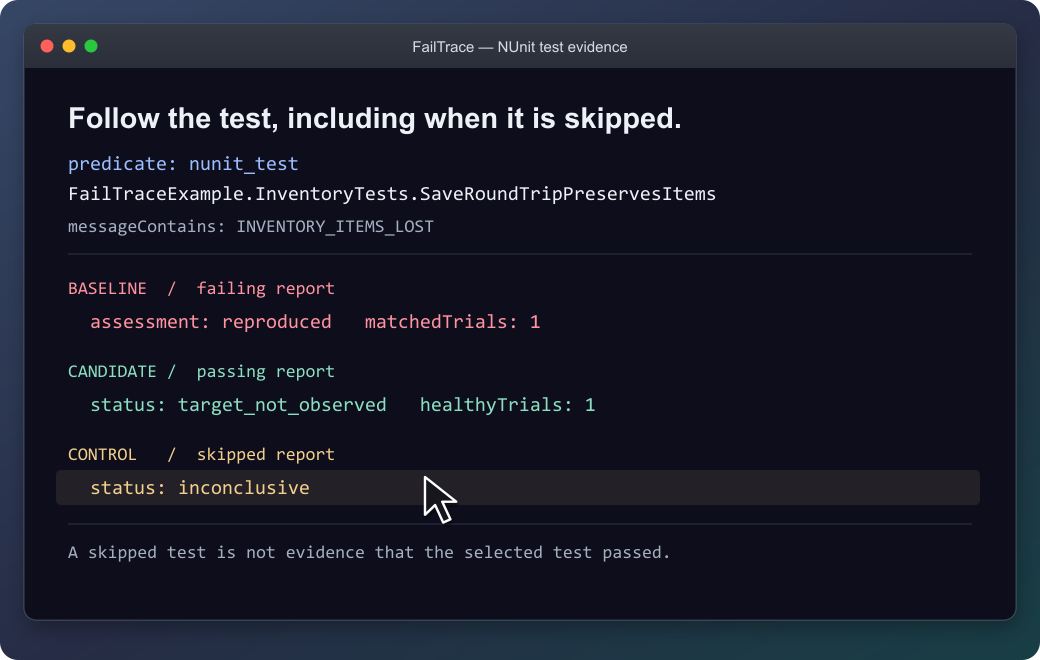
The selected test stays the same; a skipped report is not accepted as a passing test.
Use it on your own failure
From your project, replace the command and message with your own:
npx --yes failtrace@1.5.0 run "npm test -- checkout" --repeat 20 --stderr-contains "checkout failed" --capture-context
Run this before editing in a Git project. --capture-context records source identity for Verify; outside Git, select files with --context-source. Each trial saves its output, and exit 1 can mean the target was captured successfully. Then edit and verify the patch →
| Your next question | Command |
|---|---|
| How often does this failure appear? | run |
| What differs between a healthy and failing trial? | compare |
| Which Git change introduced it? | bisect |
| What input is enough to reproduce it? | minimize |
| What happened after the proposed fix? | verify |
| How can I replay this investigation? | bundle |
Command reference · Literal executable arguments · Reusable project scripts
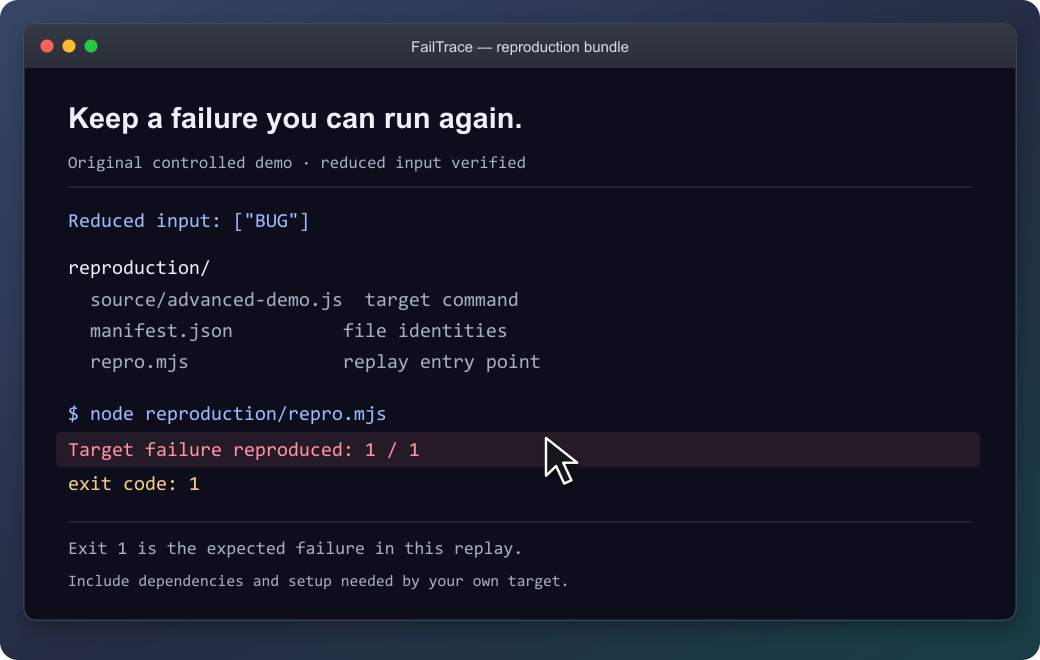
The demo's bundle reproduces its original failure with exit 1. Keep the source, input and replay together; supply the target's prerequisites when packaging your own investigation.
What the results establish
FailTrace reports observations under the chosen settings. Verify separates a target observed, a healthy sample without that target, and inconclusive evidence. Bisect reports a sampled first-parent boundary; minimization rechecks its result without promising the smallest possible input.
The demo shows controlled example outcomes, not performance measurements. A passing sample does not prove a bug is gone.
Commands run with your permissions, and process cleanup is best effort. Retained stdout/stderr is capped by default at 16 MiB per trial and 256 MiB per run or bisect/minimization. Previous investigations accumulate separately. Review logs, commands and selected files before sharing; bundles still require the target's dependencies and setup.
Result and exit-code reference · Resource limits · Storage inventory · Bundle guide
Availability and contributing
The quick start uses npm's latest release; the verified version is 1.5.0. MCP configuration and repeatable installation examples keep that exact version pinned: installation options, GitHub release, and MCP Registry entry.
Version 1.5.0 adds: short run references, Verify readiness and next-step guidance, and intermittent-minimization guidance. See the changelog.
Documentation: choose your next task →
Development instructions · Compatibility · Roadmap · Third-party notices
Preguntas sobre FailTrace MCP
¿Cómo agrego FailTrace MCP a Claude Code?
Ejecuta claude mcp add failtrace -- npx -y failtrace en tu terminal. Añade --scope user para que esté disponible en todos los proyectos.
¿Cómo agrego FailTrace MCP a Cursor?
Abre ~/.cursor/mcp.json y añade el servidor en mcpServers, usando la configuración de Cursor que se muestra en la sección de instalación de arriba.
¿Requiere FailTrace una API de IA o una cuenta?
No, realiza la ejecución local sin necesidad de ninguna API de IA, cuenta o telemetría.
¿Puedo usar FailTrace con pruebas de NUnit?
Sí, el soporte para NUnit está incluido desde la versión 1.3.0 en adelante, tanto a través de la CLI como de MCP.
¿Cuáles son los límites de recursos para los logs?
El almacenamiento de stdout/stderr está limitado a 16 MiB por intento y 256 MiB por ejecución, bisect o minimización.
¿Un ejemplo que pase demuestra que el error se ha corregido?
No, un ejemplo que pase no proporciona una prueba absoluta de que el error haya desaparecido.