
MCP server de debugium
✓ VerificadoOfrece un depurador multilingüe impulsado por IA con una interfaz web en tiempo real y 64 herramientas MCP para sesiones de depuración integradas con LLM.
También conocido como Algiras/debugium, @algiras/debugium
- Stars
- 4
- Herramientas
- —
- Descargas, 30 días
- 278
- Última versión
- 1.0.0
- Último commit
- 16 mar 2026
- Licencia
- —
¿Qué es debugium MCP?
debugium es un MCP server. Ofrece un depurador multilingüe impulsado por IA con una interfaz web en tiempo real y 64 herramientas MCP para sesiones de depuración integradas con LLM.
Resumen generado a partir del README del proyecto
Acerca del MCP server de debugium
Debugium proporciona un entorno de depuración multilingüe diseñado para desarrolladores que buscan integrar una inspección de código profunda en flujos de trabajo impulsados por IA. Soporta una amplia gama de lenguajes, incluyendo Python, JavaScript, TypeScript, C, C++, Rust, Java, Scala y WebAssembly, actuando como un proxy para varios adaptadores del Debug Adapter Protocol. Los usuarios pueden interactuar con sus sesiones de depuración a través de una interfaz web en tiempo real que incluye un visor de código fuente, expansión de variables y un call stack, o mediante una interfaz de línea de comandos con 13 subcomandos.
El servidor está construido para la integración con LLM a través del Model Context Protocol, exponiendo 64 herramientas especializadas a clientes como Claude. Estas herramientas permiten que una IA realice tareas complejas, como avanzar paso a paso hasta que una variable cambie, explicar excepciones o comparar instantáneas del estado del programa. Los desarrolladores pueden ejecutar sesiones localmente o conectarse a procesos remotos que se ejecuten en contenedores u otras máquinas. El sistema también admite la gestión de múltiples sesiones y la exportación/importación de sesiones para preservar el conocimiento de depuración entre diferentes sesiones de trabajo.
Qué puedes hacer con él
- 1Monitoreo de cambios de estadoUn desarrollador puede instruir a una IA para que ejecute el código hasta que el valor de una variable específica se modifique.
- 2Inspección de procesos remotosPuedes conectar el depurador a un proceso que ya se esté ejecutando en una máquina diferente o dentro de un contenedor.
- 3Instantáneas de depuración contextualesUn LLM puede recuperar todo el estado actual del programa, incluyendo el código fuente y las variables locales, en una sola solicitud.
Escrito a partir del README del proyecto. Cada caso de uso se verifica con una cita del mismo.
Cómo instalar debugium MCP
Formatos verificados el 10 nov 2026Añadir a CursorAñadir a GooseInstalar debugium MCP en Claude Code
$ claude mcp add debugium -- npx -y @algiras/debugiumInstalar debugium MCP en Cursor
~/.cursor/mcp.json
{
  "mcpServers": {
    "debugium": {
      "command": "npx",
      "args": [
        "-y",
        "@algiras/debugium"
      ]
    }
  }
}Instalar debugium MCP en VS Code
.vscode/mcp.json
{
  "servers": {
    "debugium": {
      "type": "stdio",
      "command": "npx",
      "args": [
        "-y",
        "@algiras/debugium"
      ]
    }
  }
}Instalar debugium MCP en VS Code CLI
$ code --add-mcp '{"name":"debugium","type":"stdio","command":"npx","args":["-y","@algiras/debugium"]}'Instalar debugium MCP en Claude Desktop
claude_desktop_config.json
{
  "mcpServers": {
    "debugium": {
      "command": "npx",
      "args": [
        "-y",
        "@algiras/debugium"
      ]
    }
  }
}Instalar debugium MCP en Codex
$ codex mcp add debugium -- npx -y @algiras/debugiumInstalar debugium MCP en Codex config.toml
~/.codex/config.toml
[mcp_servers.debugium]
command = "npx"
args = ["-y", "@algiras/debugium"]
Instalar debugium MCP en Gemini CLI
$ gemini mcp add -s user debugium npx -- -y @algiras/debugiumInstalar debugium MCP en Gemini settings.json
~/.gemini/settings.json
{
  "mcpServers": {
    "debugium": {
      "command": "npx",
      "args": [
        "-y",
        "@algiras/debugium"
      ]
    }
  }
}Verificaciones automáticas
Ejecutado 15 nov 2026Informe completo →Pasó nuestras verificaciones automáticas. Esto no es una auditoría de seguridad: lee el código y dale al servidor el acceso más limitado que necesite. Cómo funcionan las verificaciones · Qué corregir para obtener más puntos

- Repositorio de origen vinculado y accesiblealgiras/debugium is public and reachablegithub.com/algiras/debugium ↗Aprobado
- El paquete indica este repositorio como su origen@algiras/debugium names algiras/debugium as sourcenpmjs.com/package/@algiras/debugium ↗Aprobado
- Procedencia de la compilación (atestación de Sigstore)No build attestation published for this releaseNo verificado
- Licencia de código abierto (OSI)No licenseHallazgo
- Commit o lanzamiento en el último añoLast commit or release 2026-03-16github.com/algiras/debugium ↗Aprobado
- OpenSSF ScorecardNo verificado
- El nombre del paquete no es similar a un paquete popularNo popular package one edit away from @algiras/debugiumAprobado
- No hay avisos críticos en el paquete ni en sus dependencias1 resolved dependencies checked; no critical advisoryosv.dev ↗Aprobado
- Sin instrucciones ocultas para el modelo0 tool descriptions and the README read; no override phrases, credential paths or hidden charactersAprobado
- Las herramientas destructivas están etiquetadasNo verificado
- El endpoint remoto responde al handshake de MCPNo verificado
README
Ver en GitHubDebugium
A multi-language debugger with a real-time web UI and LLM integration via MCP.
Debug Python, JavaScript, TypeScript, C, C++, Rust, Java, Scala, and WebAssembly programs from your browser — with AI-driven analysis through the Model Context Protocol.


Features
Web UI
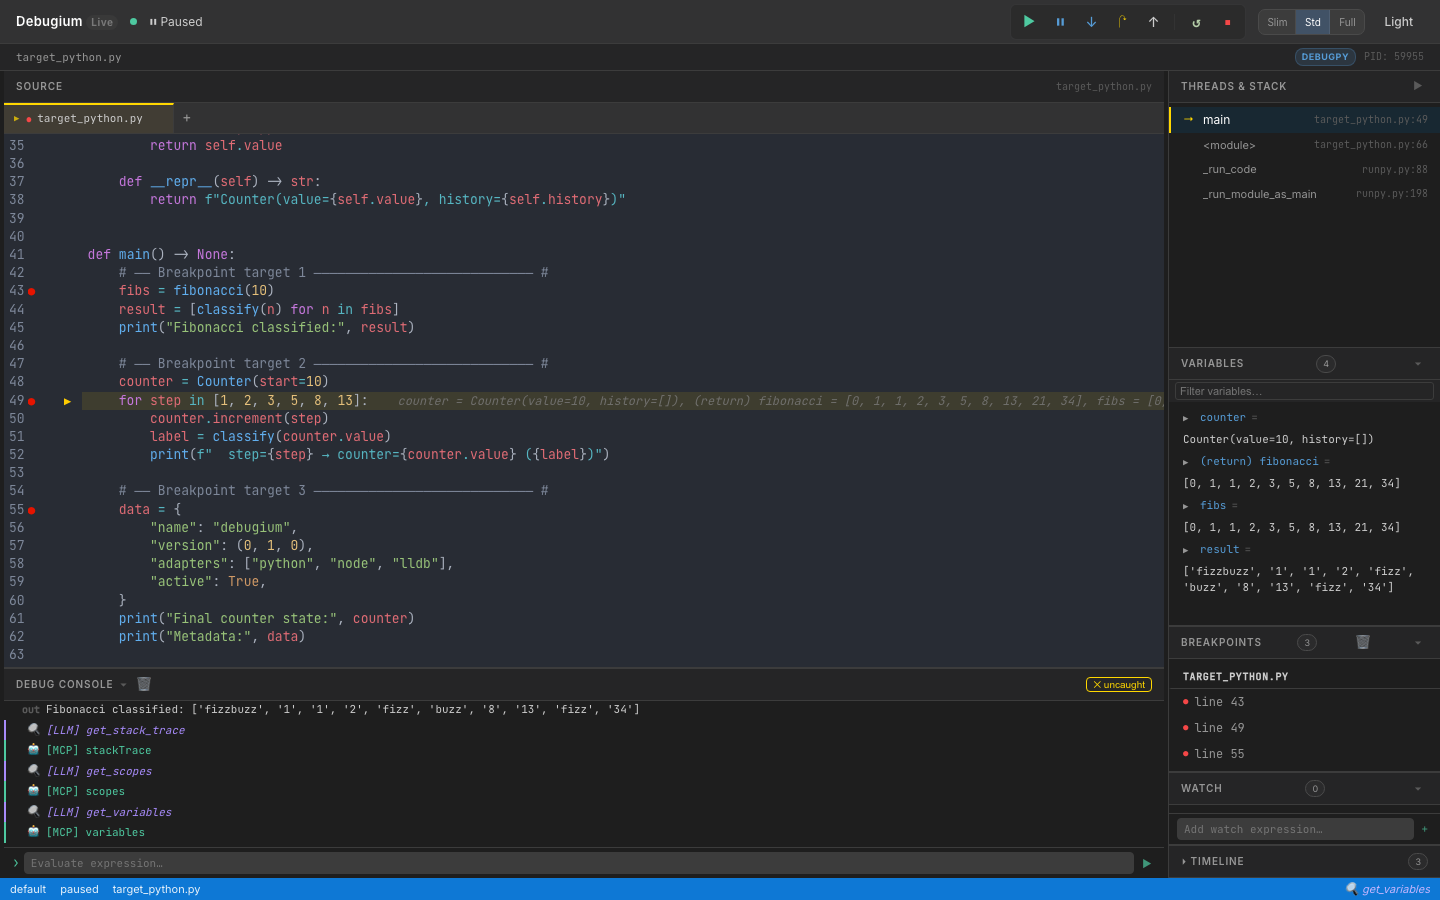
- Real-time web UI — source viewer, breakpoints, variables (recursive expansion), call stack, console, timeline, watch expressions, findings — all updated live via WebSocket
- Multi-tab source viewer — open multiple files, click stack frames to navigate
- Variable search — filter variables by name with recursive expansion
- Changed-variable highlighting — variables that changed since last stop shown in orange
- Thread selector — switch between threads in multi-threaded programs
- Panel collapse & resize — drag to resize, toggle to collapse; Slim / Standard / Full layout presets
- Dark / light mode toggle
- Auto-reconnect — UI reconnects after a dropped WebSocket, with visual status indicator
- Keyboard shortcuts — F5 continue, F10 step over, F11 step in, Shift+F11 step out, Ctrl/Cmd+D dark mode
- Button animations — in-flight spinner and completion flash for debug commands
Debugging
- Multi-language — Python (debugpy), Node.js/TypeScript (js-debug), C/C++/Rust (lldb-dap), Java (java-debug), Scala (Metals), WebAssembly (lldb-dap), or any DAP adapter via
dap.json - Comprehensive DAP coverage — 35+ DAP requests: breakpoints, stepping, goto, memory read/write, disassembly, and more
- Breakpoints — conditional, logpoints, hit-count, function, data (watchpoints), exception, run-to-cursor (
continue_until) - Multi-session — debug multiple programs simultaneously, with child session routing (js-debug)
- Remote debugging — attach to debugpy, JDWP, or Node inspector running on another machine or container
LLM / MCP Integration
- 64 MCP tools — the full debug session exposed to Claude or any LLM
- Capability-gated tools — tools automatically shown/hidden based on adapter capabilities
- Compound tools —
get_debug_context(orient in one call),step_until,step_until_change,run_until_exception,explain_exception,get_call_tree,compare_snapshots,find_first_change - Execution timeline — every stop recorded with changed variables and stack summary
- Watch expressions — evaluated automatically at every breakpoint, manageable by LLM or UI
- Annotations & findings — pin notes to source lines, record conclusions visible in the UI
- Session export/import — save and restore debugging knowledge across sessions
CLI Control
- Full CLI — 13 subcommands to drive sessions from a second terminal without the web UI
- Auto-discovery — port file at
~/.debugium/port, session logs in~/.debugium/sessions/
Install
Claude Code Plugin (recommended)
/plugin marketplace add Algiras/debugium
/plugin install debugium@debugium
Then add to your project's .mcp.json (see MCP Tools below).
macOS / Linux binary
curl -fsSL https://raw.githubusercontent.com/Algiras/debugium/main/install.sh | bash
From source
# Prerequisites: Rust stable + wasm-pack
cargo install wasm-pack

# Build UI
wasm-pack build crates/debugium-ui --target web --out-dir pkg
cp crates/debugium-ui/pkg/cm_init.js         crates/debugium-ui/dist/pkg/
cp crates/debugium-ui/pkg/debugium_ui.js      crates/debugium-ui/dist/pkg/
cp crates/debugium-ui/pkg/debugium_ui_bg.wasm crates/debugium-ui/dist/pkg/

# Build & install server
cargo install --path crates/debugium-server
Usage
Debug a Python file
debugium launch my_script.py --adapter python
Debug a Node.js / TypeScript file
debugium launch app.js --adapter node
debugium launch app.ts --adapter typescript
Debug C / C++ / Rust
# C or C++ (compile with -g for debug info)
cc -g -O0 main.c -o main && debugium launch ./main --adapter lldb
c++ -g -O0 main.cpp -o main && debugium launch ./main --adapter lldb

# Rust
cargo build && debugium launch target/debug/my_binary --adapter lldb
Debug Java / Scala
# Java (requires microsoft/java-debug adapter)
debugium launch MainClass --adapter java

# Scala (connect to a running Metals DAP server)
debugium launch build-target --adapter metals
debugium launch build-target --adapter metals:5005  # custom port
Attach to a running process (remote debugging)
# Python (debugpy listening on port 5678)
debugium attach --port 5678 --adapter python

# Java (JDWP on port 5005)
debugium attach --port 5005 --adapter java

# Node.js (inspector on port 9229)
debugium attach --port 9229 --adapter node
Or via MCP: attach_session(port=5678, adapter="python", breakpoints=["/path/app.py:42"])
Use a custom adapter via dap.json
# Create a dap.json (see dap.json.example) then:
debugium launch my_program --config ./dap.json

# Or place dap.json in cwd / .debugium/ for auto-discovery:
debugium launch my_program   # finds ./dap.json automatically
Set initial breakpoints
debugium launch my_script.py --adapter python \
  --breakpoint /abs/path/my_script.py:42 \
  --breakpoint /abs/path/helpers.py:15
Enable LLM / MCP integration
Add a .mcp.json to your project root (Claude Code picks this up automatically):
{
  "mcpServers": {
    "debugium": {
      "command": "debugium",
      "args": ["mcp"]
    }
  }
}
Then launch the session normally — the MCP server connects to whichever port is active:
debugium launch my_script.py --adapter python --breakpoint /abs/path/my_script.py:42
Claude Code will now have access to all Debugium MCP tools. See CLAUDE.md for the recommended workflow and SKILL.md for the full tool reference.
CLI Control Commands
Once a session is running (debugium launch …), you can drive it from a second terminal — or from an LLM agent — without touching the web UI.
Port is auto-discovered from ~/.debugium/port; override with --port.
Global flags (all subcommands)
| Flag | Default | Description |
|---|---|---|
--port PORT |
~/.debugium/port |
Server port to connect to |
--session ID |
default |
Session to target |
--json |
off | Print raw JSON instead of human-readable output |
Inspection
debugium sessions                  # list active sessions
debugium threads                   # list threads
debugium stack                     # show call stack
debugium vars                      # show local variables (auto-resolves top frame)
debugium vars --frame-id 2         # show variables for a specific frame
debugium eval "len(fibs)"          # evaluate expression in top frame
debugium eval "x + 1" --frame-id 2
debugium source path/to/file.py    # print full source file
debugium source path/to/file.py --line 43  # windowed ±10 lines with → marker
debugium context                   # full snapshot: paused-at, stack, locals, source, breakpoints
debugium context --compact         # same but truncated (3 frames, 10 vars)
Breakpoints
debugium bp set FILE:LINE [FILE:LINE …]   # set breakpoints (replaces existing in that file)
debugium bp list                          # list all breakpoints
debugium bp clear                         # clear all breakpoints
Execution control
debugium continue                  # resume execution
debugium step over                 # step over (next line)
debugium step in                   # step into a function call
debugium step out                  # step out of current function
UI annotations (visible in the web UI)
debugium annotate FILE:LINE "message" [--color info|warning|error]
debugium finding "message"         [--level  info|warning|error]
Example workflow
# Terminal A — start the session
debugium launch tests/target_python.py --adapter python \
  --breakpoint "$(pwd)/tests/target_python.py:43"

# Terminal B (or LLM agent) — inspect and drive it
debugium sessions
debugium stack
debugium vars
debugium eval "len(fibs)"
debugium bp set tests/target_python.py:49
debugium continue                  # runs to line 49
debugium vars
debugium step over
debugium context --json            # machine-readable snapshot
debugium annotate tests/target_python.py:43 "called here" --color info
debugium finding "fibs has 10 elements" --level info
debugium bp clear
MCP Tools
When connected via MCP, 64 tools are available. Key ones:
| Category | Tools |
|---|---|
| Orient | get_debug_context ★ (paused location + locals + stack + source in one call) |
| Breakpoints | set_breakpoint, set_breakpoints, set_logpoint, list_breakpoints, clear_breakpoints, set_function_breakpoints, set_exception_breakpoints, set_data_breakpoint, list_data_breakpoints, clear_data_breakpoints, breakpoint_locations |
| Execution | continue_execution, step_over, step_in, step_out, pause, goto, disconnect, terminate, restart |
| Inspection | get_stack_trace, get_scopes, get_variables, evaluate, get_threads, get_source, get_capabilities, loaded_sources, source_by_reference, step_in_targets |
| Mutation | set_variable, set_expression |
| Output | get_console_output, wait_for_output (with from_line to avoid stale matches) |
| Memory | read_memory, write_memory, disassemble (native debugging) |
| History | get_timeline, get_variable_history, compare_snapshots, find_first_change |
| Annotations | annotate, get_annotations, add_finding, get_findings |
| Watches | add_watch, remove_watch, get_watches |
| Compound | step_until, step_until_change, continue_until, run_until_exception, explain_exception, get_call_tree, restart_frame |
| Session | get_sessions, list_sessions, launch_session, attach_session, stop_session, export_session, import_session |
| Control | goto_targets, cancel_request |
Note:
step_over,step_in, andstep_outare blocking — they wait for the adapter to pause before returning. Safe to chain back-to-back without sleeps.continue_executionreturnsconsole_line_countfor use withwait_for_output. Tools likeread_memory,goto, andrestart_frameonly appear when the adapter supports them.
See SKILL.md for the full reference with input schemas.
Keyboard Shortcuts
| Key | Action |
|---|---|
F5 |
Continue |
F10 |
Step Over |
F11 |
Step Into |
Shift+F11 |
Step Out |
Ctrl/⌘+D |
Toggle dark/light mode |
Architecture
debugium-server (Rust + Axum)
├── DAP proxy     — spawns / attaches to debug adapters (debugpy, js-debug, lldb-dap, java-debug, Metals, custom)
├── HTTP API      — /state, /sessions, /annotations, /findings, /watches, /timeline
├── WebSocket     — broadcasts DAP events + enriched stop data (changed vars, timeline) to UI
├── MCP stdio     — JSON-RPC 2.0 server exposing 64 tools for LLM integration
├── CLI control   — 13 subcommands to drive sessions from a second terminal
└── ~/.debugium/  — port file, session logs (events.ndjson), debug log

debugium-ui (Leptos + WASM)
├── CodeMirror 6  — source viewer with breakpoint gutters, exec arrow, LLM annotations, multi-tab
├── Reactive panels — Variables, Stack, Breakpoints, Findings, Watch, Timeline, Console (18 components)
└── WebSocket     — receives events, sends DAP commands, auto-reconnects with status indicator
Supported Languages & Adapters
| Language | --adapter flag |
Prerequisite | Verified |
|---|---|---|---|
| Python | python / debugpy |
pip install debugpy |
✅ |
| Node.js | node / js |
js-debug (bundled or build from vscode-js-debug) | ✅ |
| TypeScript | typescript / ts / tsx |
js-debug + tsx or ts-node in PATH |
✅ |
| C / C++ | lldb / codelldb |
lldb-dap (Xcode on macOS; apt install lldb on Linux) |
✅ |
| Rust | lldb / rust |
lldb-dap + cargo build |
✅ |
| Java | java / jvm |
microsoft/java-debug adapter JAR | ✅ |
| Scala | metals / scala |
Running Metals DAP server | ⚠️ (requires running Metals) |
| WebAssembly | wasm |
lldb-dap (LLVM ≥16) |
⚠️ (requires WASM-aware LLVM) |
| Any DAP adapter | --config dap.json |
See dap.json.example |
✅ |
Remote debugging
Connect to a DAP server running on another machine (or in a container):
{
  "adapterId": "debugpy",
  "request": "attach",
  "host": "192.168.1.100",
  "port": 5678,
  "pathMappings": [{ "localRoot": ".", "remoteRoot": "/app" }]
}
debugium launch app.py --config remote.json
License
MIT
Preguntas sobre debugium MCP
¿Cómo agrego debugium MCP a Claude Code?
Ejecuta claude mcp add debugium -- npx -y @algiras/debugium en tu terminal. Añade --scope user para que esté disponible en todos los proyectos.
¿Cómo agrego debugium MCP a Cursor?
Abre ~/.cursor/mcp.json y añade el servidor en mcpServers, usando la configuración de Cursor que se muestra en la sección de instalación de arriba.
¿Qué lenguajes de programación soporta Debugium?
Soporta Python, JavaScript, TypeScript, C, C++, Rust, Java, Scala y WebAssembly.
¿Cuántas herramientas MCP hay disponibles?
Hay 64 herramientas MCP disponibles, incluyendo herramientas para breakpoints, control de ejecución, inspección y mutación.
¿Puedo depurar un proceso que se ejecuta en otra máquina?
Sí, puedes usar la depuración remota para conectarte a debugpy, JDWP o Node inspector que se ejecuten en otra máquina o contenedor.
¿Cómo activo la integración con LLM?
Puedes activarla añadiendo un .mcp.json a la raíz de tu proyecto que especifique el comando debugium con el argumento mcp.